Emergency Stroke Care - How are we doing? Southeast Regional & District Acute Stroke Protocol Committee
←
→
Page content transcription
If your browser does not render page correctly, please read the page content below
Emergency Stroke Care
          How are we doing?

   Southeast Regional & District
  Acute Stroke Protocol Committee
             May 2021

                with thanks to
          All 5 Paramedic Services
Regional Paramedic Program of Eastern Ontario
        (S. Duncan) for Stroke Report
               QHC and KHSC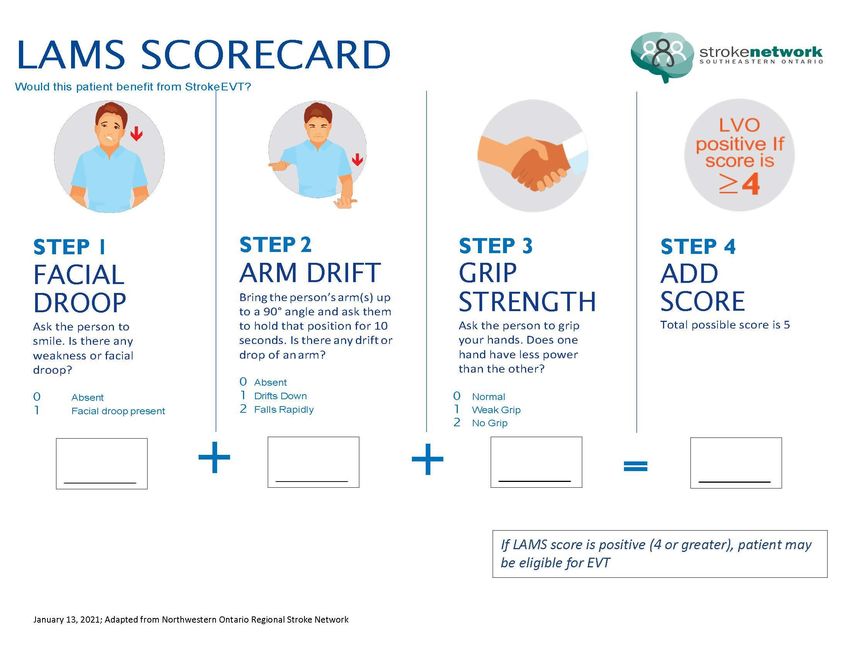
What is included in this slide deck?
• Due to COVID-19 the annual 2021 Regional Acute Stroke Protocol (RASP) evaluation
meeting has been cancelled
• As per Previous years, these evaluation slides have been prepared for your review:
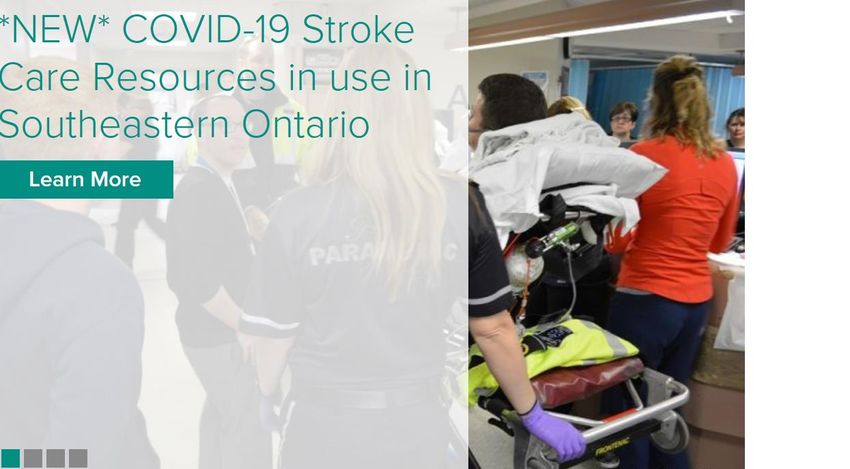
• Links to COVID-19 stroke care guidelines & resources;
• Ontario CTAS stroke data before and after COVID-19 Pandemic;
• Annual data trends from KHSC, QHC and RPPEO on stroke ASP volumes, % treated,
DTN times, stroke volumes by paramedic service, transfers etc;
• Endovascular Treatment (EVT) outcomes, including the 6 to 24 hour time window;
• Inpatient stroke unit utilization and mortality graphs
• Reminders regarding changes in the paramedic prompt card, LVO screening tools and
walk-in protocols related to extended time window for treatment.
• If you have any concerns about Acute Stroke Protocol (ASP) processes, please do not
hesitate to be in touch – contacts provided on last slide
• Thank you for all you are doing to keep emergency stroke care protocols working
well - Dr Jin and Cally Martin.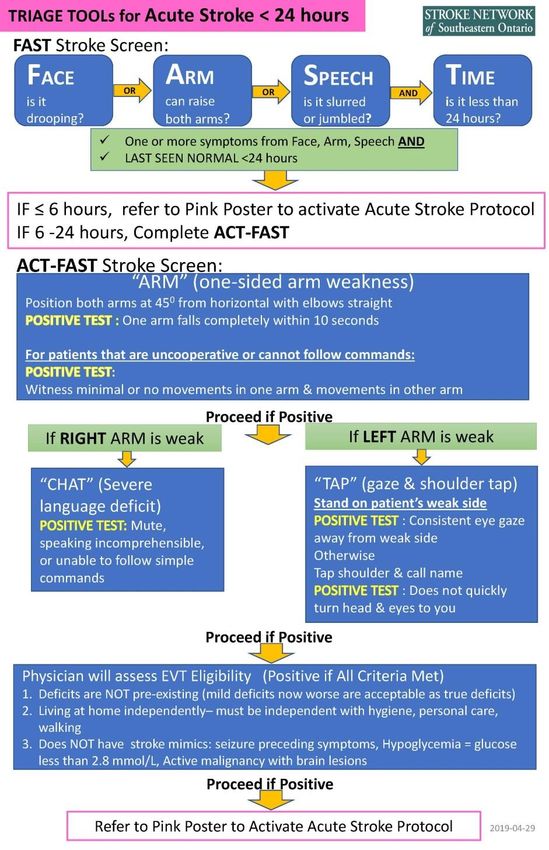
Stroke Care During COVID-19
https://www.strokebestpractices.ca/
Stroke Care Resources during COVID-19
Pandemic www.strokenetworkseo.ca
Public Awareness during COVID-19
Ontario eCTAS data:
Stroke-related ED Visits during COVID-19
KHSC-KGH Stroke Activations
                        COVID Impact?
                                                  KHSC-KGH Stroke Protocol Activation, Feb2019-Apr2021
          65

          60
                                                                                                      COVID                                                                    KGH Activations
                                                                                                      Impact?
          55

          50

          45

          40

          35

          30

          25
                  Feb'1 Mar'1        May'1        July'1 Aug'1 Sept'1        Nov'1 Dec'1        Feb'2 Mar'2        May'2 June'2 July'2 Aug'2 Sept'2        Nov'2 Dec'2        Feb'2 Mar'2
                              Apr'19       Jun'19                     Oct'19             Jan'20             Apr'20                                  Oct'20             Jan'21             Apr'21
                    9    9            9             9      9     9             9     9            0    0            0      0      0      0     0             0     0            1    1
KGH Activations    44    59     51    58     62    52     43    54     42    53     41    47     40    48     34    49     61    54     60    39     41    47     61    55     43    41     40

      Unlike the Ontario e-CTAS data, at KHSC we have observed decreased stroke
      presentation to ED in April 2020 and again in 2021. NOTE: Overall KHSC ED
          volumes were low in April but resuming more normal trends in May.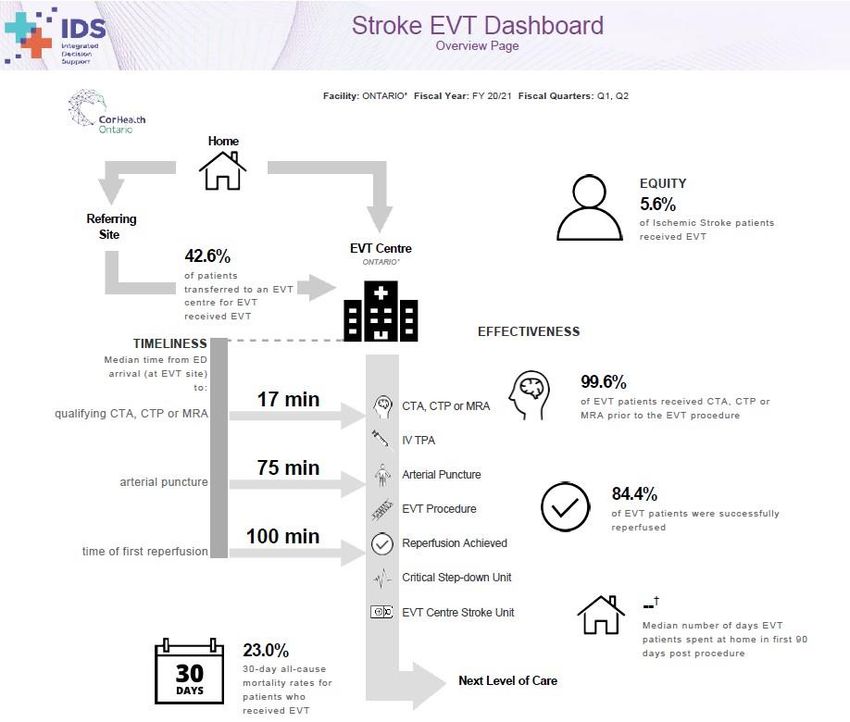
KHSC-KGH Stroke Hyperacute Rx
            COVID Impact?
    26             KHSC-KGH Stroke Thrombolysis & EVT, Feb2019-Apr2021
    24
    22
    20
    18
    16
    14
                                                                         KGH EVT only
    12                                                                   KGH thrombolysis & EVT
    10                                                                   KGH thrombolysis only
     8
     6
     4
     2
     0

• Decrease in access to hyperacute Rx in April 2020 but less impact in April 2021
   • Appears that those with most severe strokes are still presenting to ED
• Concern is access to secondary prevention for those with minor stroke and TIA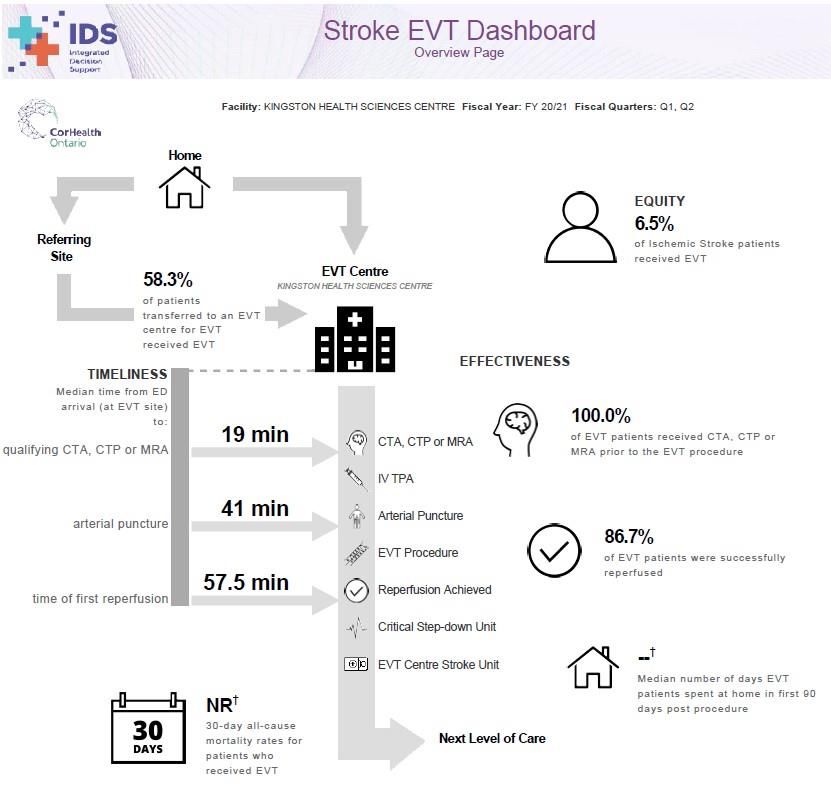
KHSC-KGH Stroke Prevention Clinic
                      COVID Impact?
                           Stroke Prevention Clinic Monthly TIA Referrals Feb 2019- Apr 2021 by Referral Source (excluding discharged
                                                                           inpatients)

                      50

                      40
                                                                   COVID
                                                                   Impact?                                                COVID
Number of Referrals

                      30                                                                                                  Impact?

                      20                                                                                                    KGH/HDH ER

                                                                                                                            COMMUNITY ER

                      10                                                                                                    FAMILY PHYSICIAN

                                                                                                                            SPECIALIST/CVD
                       0

      • Decrease in TIA referrals from ED and family practice in April 2020
 • Decrease in referrals from ED but family practice referrals sustained April 2021
• Concern is to sustain access to secondary prevention for minor stroke and TIA
KGH + QHC
  stroke protocol activations
             and
hyperacute treatment volumes
SEO ASP Activations KGH/QHC
by Fiscal Year Total of 933
1000 activations
across SE
900
800
700
600
500 QHC
400 KGH
300
200
100
0
2020-21 – 933 stroke protocol activations at QHC and KHSC
Includes 121 In-hospital stroke protocol activations
Note re In-hospital activations:
• growth from 78 last FY - due to ↑ time window
• 83 at KGH – 6 treated (2 tPA + 4 EVT); 38 at QHC – 0 tPA
• 7% of KHSC in-hospital activations received RxKGH/QHC tPA and EVT Volumes
by Fiscal Year – unique patients
66 EVT cases
250 at KHSC
NOTE: This graph shows volumes by unique patients FY 2020-21
– i.e. those who receive both EVT at KHSC and tPA at
200 either KHSC or QHC are only counted once and are
indicated in the green section
150
SEO EVT only
SEO tPA&EVT
100 QHC tPA only
KGH tPA only
50
0
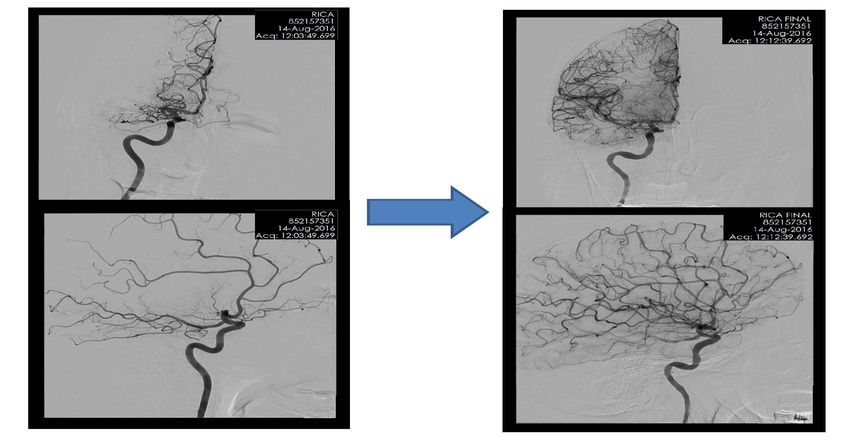
Growth in EVT rates; RAPID imaging contributes to patient selection
Median Door-to Needle (DTN) times:
2020-21 KGH 27 mins; QHC 37 mins and still improving – last Q 27.5 mins!SE Region: % Stroke Activations Treated
with tPA or EVT at KGH & QHC by FY
Hyperacute Treatment Expressed as % of ASP Activations
35.0%
30.0%
25.0%
20.0%
15.0% % treated
10.0%
5.0%
0.0%
Per slide 11 - Volumes of stroke activations have risen each year.
Per slide 12 - Volumes treated have stabilized this year.
Over past 4 years, across the region, % activations treated with tPA, EVT or both
have ranged between 20 and 25%% Ischemic Stroke Receiving Thrombolysis
Source: SE Stroke Dashboard CIHI NACRS & 340 2017-2021
45.0
40.0
% Ischemic Stroke Receiving Thrombolysis
35.0
30.0
25.0
20.0 KGH
QHC
15.0
10.0
5.0
0.0
Q1 Q2 Q3 Q4 Q1 Q2 Q3 Q4 Q1 Q2 Q3 Q4 Q1 Q2 Q3
FY2017-18 FY2018-19 FY2019-20 FY2020-21
Over recent years, % ischemic stroke patients who received thrombolysis
has generally ranged between 20 and 30% at both KGH and QHCQHC Code Stroke Activations (20/21)
38
20
6
8
EMS to BG ER
Walkins at BG ER
QHC Data
Transferred from TMH ER
Transferred from NH ER
53
Transferred from PEC ER
224
Inpatients
QHC Code Stroke Activations (19/20)
26
8 9
EMS to BG ER
20
Walkins at BG ER
Transferred from TMH ER
Transferred from NH ER
71 196 Transferred from PEC ER
InpatientsQHC DTN QI Work
• Kaizen Event held July 2019 to target stroke emergency care
• Focus was to improve 4 key areas:
√ Reduce practice variation
√ Improve nursing teamwork in ICU and ED
√ Renew momentum and ownership for hyperacute care
√ Reduce door-to-needle (DTN) times for tPA
• By FY 2020-21 QHC had reduced median DTN from 60 to 37 mins!
• Work is ongoing
Most recent quarter:
2020-21 Q3 DTN of 27.5 mins!
CONGRATS
to the QHC team!Regional Paramedic Program for Eastern Ontario Stroke Report 2020 Calendar Year 2020 – with thanks to Susan Duncan and Ben De Mendonca
All Stroke Patients by Paramedic Service x 10 yrs
Data Source: RPPEO Stroke Report CY 2020
                                               All Stroke Patients by Service 2011 - 2020
   450
                                                                                                                                            1183
                                                                                                                          1096
                                                                                              1047          1041
                                                                              1011
                                                     962             981
   360
                            845          852
         780

   270

   180

   90

    0
         2011               2012        2013         2014            2015     2016            2017          2018          2019             2020

                Frontenac          Hastings-Quinte         Lanark County    Leeds-Grenville          Lennox & Addington          All Services
Growth in ALL Stroke Calls by Local Area
over past 10 years Data Source: RPPEO 2020 Stroke Report
Hastings-Quinte 330
320
300
280
Frontenac 278
260
240 Leeds Grenville 228
220
200
180
Lanark 167
160
140
120
100 Lennox & Addington
117
80
60
40 Prince Edward 59
20
0
2011 2012 2013 2014 2015 2016 2017 2018 2019 2020Growth in Stroke Protocol Calls by Area
over past 10 years Data Source: RPPEO 2020 Stroke Report
Frontenac Hastings-Quinte Lanark
Leeds & Grenville Lennox & Addington Prince Edward
180 Hastings Quinte -178
160
Frontenac -147
140
120
100 Leeds & Grenville - 97
Lanark - 83
80
60 Lennox & Addington - 58
40
Prince Edward - 35
20
0
2011 2012 2013 2014 2015 2016 2017 2018 2019 2020ACUTE STROKE PROTOCOL (ASP) PATIENTS IN 2020 (N=599)
Data Source: RPPEO 2020 Stroke Report
BY RESPONDING PARAMEDIC SERVICE
Lennox &
Leeds-Grenville Addington Frontenac
Paramedic Service
99
Paramedic Services
63
Paramedic Service
141
2020
17% 10% 24%
ASP stroke calls
by service
N=599
Lanark County
Paramedic Service
86 Hastings-Quinte
14% Paramedic Service
210
35%
2019
ASP stroke calls
by service
N=596% STROKE PATIENTS TRANSPORTED IN EACH COUNTY WHO MET ACUTE STROKE PROTOCOL
Data Source: RPPEO 2020 Stroke Report
70.0%
63.6%
60.2% 59.3%
60.0%
54.1% 53.9% 54.4% 54.4%
52.9% 53.5%
52.4% 52.4%
51.0% 51.2% 50.6%
49.7% 49.6%
50.0% 47.1%
45.8% 46.5% 45.9%
43.4% 44.0%
43.0% 42.5% 42.7%
41.6%
40.4%
39.0% 38.8%
40.0% 37.9% 37.5%
36.3%
30.9% 30.6%
29.6% 29.4% 29.1%
30.0%
25.2% 25.0%
23.2%
20.0%
10.0%
0.0%
Frontenac Hastings-Quinte Lanark Leeds & Grenville Lennox & Prince Edward Other UTM's All Municipalities
Addington
2007 - 2010 2011 - 2014 2015 - 2018 2019 20202012 2013 2014 2015 2016 2017 2018 2019 2020
Stroke 161 176 165 165 183 191 220 253 251
Centre is (46%) (49%) (43%) (41%) (41%) (38%) (39%) (42%) (42%)
closest
Bypass 133 146 135 168 183 210 224 237 236
(38%) (41%) (35%) (42%) (41%) (41%) (40%) (40%) (39%)
Transfers 56 38 86 66 82 107 121 106 112
(16%) (11%) (22%) (17%) (18%) (21%) (21%) (18%) (19%)
TOTAL 350 360 386 400 448 508 565 596 599
Home location for the 41 patients arriving by car
Reasons for the transfers in 2020: Almonte 1 Napanee 3
- 41 were brought by private car (37% of transfers) Bancroft 1 Perth 9
- 14 In-hospital strokes Brockville 4 Picton 2
- 42 brought to local ED – 8 were TIA, 18 outside time window Carleton Place 4 Smiths Falls 6
- 12 EVT transfers after 6 hour time window Kemptville 2 Trenton 6
Kingston 3Contraindications for transport under ASP
Data Source: RPPEO 2020 Stroke Report
Unable to determine when patient last seen normal 36
Unable to deliver patient to stroke centre within timeline 208
6 - 12 hours 86
12 - 24 hours 95
greater than 24 hours 27
Patient was unconscious or unstable 23
Terminally ill or palliative care patient 12
Seizure at onset of symptoms 13
Symptoms resolved prior to paramedic departing scene 283
Symptoms mild 3
Patient refused 2
Should have been ASP 4
Total 584KHSC EVT Outcomes to Date
KHSC EVT Process Times – last 2 yrs CURRENT - 2020-21 LAST YEAR - 2019-20 63 anterior and 3 posterior cases 55 anterior and 2 posterior cases Current KHSC median times for Past KHSC median times for Anterior cases Anterior cases Door to CT: 14 mins Door to CT: 12 mins (ON target 15 mins) (ON target 15 mins) Door to Needle: 25 mins Door to Needle: 22 mins (ON target 30 mins) (ON target 30 mins) Door to Puncture: 47 mins Door to Puncture: 41 mins (ON target 60 mins) (ON target 60 mins) Door to First Reperfusion: 68 mins Door to First Reperfusion: 58 mins (ON target 90 mins) (ON target 90 mins)
KHSC EVT Current Outcomes Target*: 46% with 90 day Modified Rankin Scale (MRS) score of ≤ 2 (minimal to no disability) *based on Hermes Meta-Analysis TOTAL of 196 cases to March 31 2021: 185 Anterior and 11 posterior Most recent analysis FY 2020-21 : 63 anterior, 3 posterior circulation cases ~5 to 6 cases per month (ongoing growth from last fiscal) Geographic distribution: HPE – 22; KFLA – 26 (8 from L&A); LLG – 16 (plus 1 from Campbellford; 1 from Toronto) 32/66 cases treated after hours; 17/66 received tPA Average age 68 years (41 to 94 years); 34 female/32 male For the 63 anterior cases 29/63 (46.0%) with minimal to no disability MRS
CorHealth Ontario EVT Report
                      March 2020-21 – Q1, Q2
        Kingston                       Ontario

16.7%
CorHealth Ontario EVT Report
March 2020-21 – Q1, Q2
ACCESS PROCESS TIMES
OUTCOMES
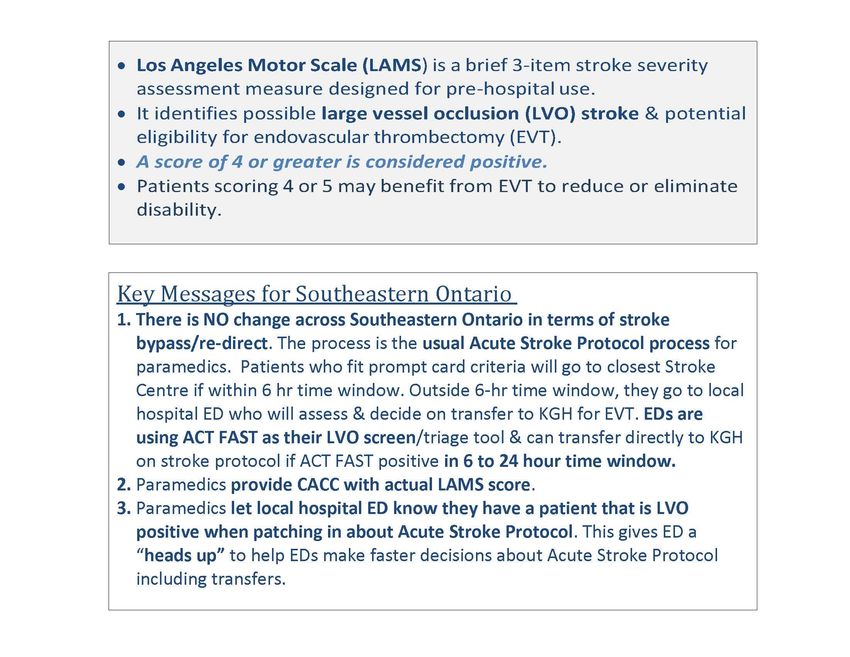
KHSC 16.7%Paramedic Prompt Card
Revised BLS 3.3 launch Jan 2021
LAMS Large Vessel Occlusion
Screening Tool
now in Use by Paramedic Services
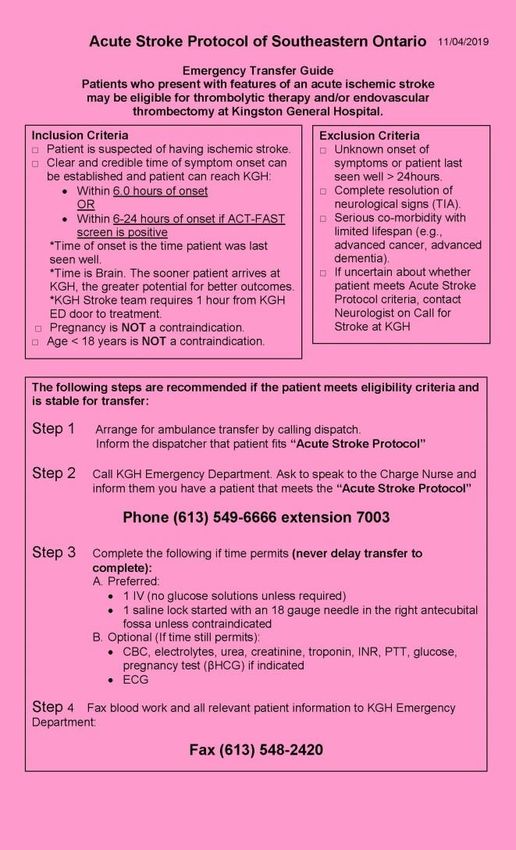
ED Walk-in Protocols
revised in 2019-20
“ACT-FAST” screening tools in use in
EDs up to 24-hours post stroke onset DAWN and DEFUSE-3 trials supported extended treatment
window for EVT beyond 6 hours in select cases
Hyperacute Best Practice Guidelines summer 2018
included expanded time window for EVT
Eligibility based on quantifiable measure of mismatch
between ischemic core and penumbra
“RAPID” advanced CT perfusion software installed KHSC
Jan 2019 and QHC Dec 2019 allowing evidence-based
approach to patient selection for EVT after 6 hours
Cases now selected for EVT up to 24 hours
ACT-FAST triage process now in place in all South East
EDs to identify and select patients in extended time windowBLS 3.3 Stroke Paramedic Prompt Card Jan 2021: “Perform secondary LVO Screen and inform CACC to aid in determination of most appropriate centre” NO CHANGE to bypass protocol in our region but please let hospital EDs know if screen LVO positive
Reminder: Sample USED by ED STAFF
 in Brockville, Perth & Smiths Falls,
         Napanee and HDH
Walk-in ASP transfer protocol: - L&ACGH - Brockville - PSFDH - HDH site
Sample Poster USED by ED STAFF
 in Bancroft, Picton and Trenton
Walk-in protocol
Quinte – Bancroft, Trenton, Picton
Stroke Units:
Impact on Outcome

 Source: Regional Stroke Network Dashboard
KHSC, QHC and BrGH Hospital Stroke Evaluation
              Data to FY 20-21
           ◦ CIHI administrative data
            ◦ CIHI 340 – stroke data
% Accessing Acute Stroke Unit Care
Data Source: Hospital CIHI 340 Stroke Data - FY2017-18 to 2020-21
100.0
Stroke Unit Utilization
90.0
80.0
KGH
QHC
70.0
BrGH
60.0
50.0
Q1 Q2 Q3 Q4 Q1 Q2 Q3 Q4 Q1 Q2 Q3 Q4 Q1 Q2 Q3
FY2017-18 FY2018-19 FY2019-20 FY2020-21
• Over past 3 years, hospitals have struggled to sustain a target of 75-80%
stroke unit utilization.
• Mortality rates increase when stroke patients do not access stroke unit care.
• See next 2 slides showing stroke unit utilization against mortality rates.KHSC: % Stroke Unit Utilization vs Mortality
Data Source: Hospital CIHI 340 Stroke Data - FY 2017-18 to 20-21
NOTE Higher mortality when KHSC - High
Stroke Unit utilization is low annual inpatient
volume stabilized
100.0 18.0
at about 650
90.0 in 2019-20 and
16.0
2020-21
80.0 (growth from 553
14.0
in 2018-19)
70.0
Stroke Unit Utilization Rate (%)
12.0
Of CONCERN:
Mortality Rate (%)
60.0 Ongoing QI work
10.0 needed to sustain
50.0 stroke unit
8.0 utilization to
40.0 prevent associated
drop in mortality
6.0
30.0
4.0
20.0
2.0 KGH Stroke Unit
10.0
KGH Mortality
0.0 0.0
Q1 Q2 Q3 Q4 Q1 Q2 Q3 Q4 Q1 Q2 Q3 Q4 Q1 Q2 Q3
FY2017-18 FY2018-19 FY2019-20 FY2020-21QHC: % Stroke Unit Utilization vs Mortality
Data Source: Hospital CIHI 340 Stroke Data - FY 2017-18 to 20-21 (Q1,Q2)
100.0 18.0
QHC Belleville
90.0 Annual stroke
16.0
inpatient
80.0
14.0
volume stable
at 422-424 in
70.0 2018-19 and
Stroke Unit Utilization Rate
12.0
2019-20
60.0
Mortality Rate
10.0
50.0
Inpatient
8.0 Volume of 326
40.0 in first 3
6.0 quarters of
30.0 2020-21
4.0
20.0
10.0 2.0 QHC Stroke Unit
QHC Mortality
0.0 0.0
Q2 Q3 Q4 Q1 Q2 Q3 Q4 Q1 Q2 Q3 Q4 Q1 Q2 Q3
FY2017-18 FY2018-19 FY2019-20 FY2020-21Other updates – NEW!!!
• Acute Research Trials ongoing at KHSC:
• AcT trial of TNK vs tPA – RCT for all eligible for thrombolysis
• TEMPO trial - RCT investigating thrombolysis in mild stroke
• Several other secondary prevention trials also ongoing
• KHSC has received designation for endovascular coiling
of cerebral aneurysms
• Ruptured coiling for those with subarachnoid haemorrhage
has been underway; program growth over last 2 years
• Work now underway to begin elective coiling as well
• Patients will no longer need to be transferred to Toronto or
Ottawa for this treatmentFinal reminders!!
• Feedback and questions welcome- contacts:
Regional Stroke Director, Cally Martin
cally.martin@kingstonhsc.ca
Regional Stroke Best Practice Coordinator, Colleen Murphy
colleen.murphy@kingstonhsc.ca
Quinte Health Care Stroke Resource Nurse, Melissa Roblin
MRoblin@QHC.on.ca
• Dispatch must be contacted for walk-in transfers on
stroke protocol
• Importance of early pre-notification including whether a
patient score is LVO positive
• Importance of access to stroke unit care
• Encourage public awareness of FAST, especially during
COVID-19
STAY WELL!!www.strokenetworkseo.ca
You can also read