Real-time modelling of novel coronavirus - Daniel Coombs Department of Mathematics & Institute of Applied Mathematics University of British ...
←
→
Page content transcription
If your browser does not render page correctly, please read the page content below
Real-time modelling of novel coronavirus

                                 Daniel Coombs
            Department of Mathematics & Institute of Applied Mathematics
                           University of British Columbia

UBC, Jan 31, 2020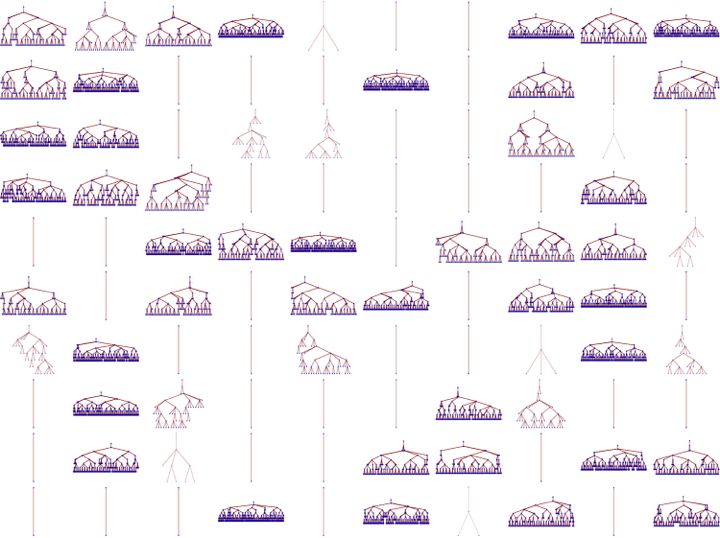
Acknowledgments and disclaimer:

1. Synthesized high quality modelling from around the world
2. Highly influenced by post-SARS modelling efforts
3. This talk is like sushi
Incidence data (Wuhan)

• 5806 confirmed cases and
  42 deaths in Hubei
  province (to Jan 31)

           Huang et al, Lancet preprint (Jan 24); Liu et al, biorxiv 2020.01.25.919787 (Jan 25)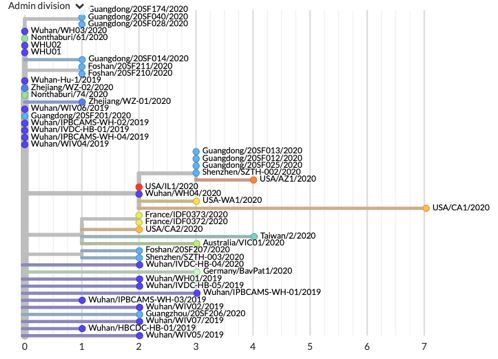
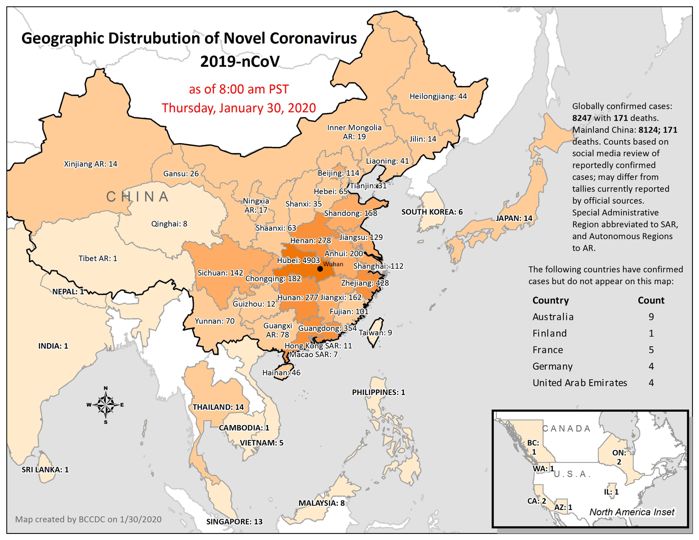
Incidence data (China)

                                               •   Logplot shows exp growth
                                                   from Jan 16-30
                                               •   Doubling time ~1.8days

•   9 deaths outside Hubei province (to Jan 31)
•   Over 15,000 suspected cases and over 100,000 under observation

        Wikipedia: Timeline of the 2019–20 Wuhan coronavirus outbreak (accessed Jan 31)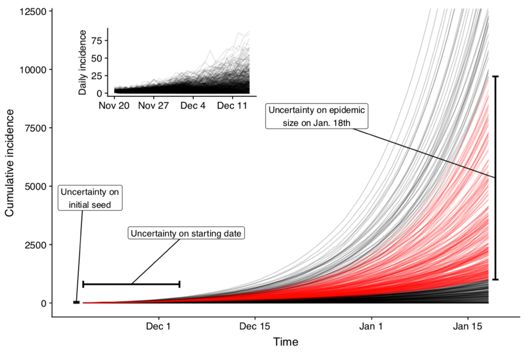
Incidence data (International)

                       (from Wuhan)
                                                            Travel restrictions
                                                            start Jan 23

                                                   •   Total int’l Jan 30AM = 123 cases

                    (from rest of China)           •   Person to person outside China:
                                                        • Germany (report 28 Jan)
                                                        • Japan (report 28 Jan)
                                                        • Taiwan (report 28 Jan)
                                                        • USA (report 30 Jan)
                                                        • Thailand (report 31 Jan)

https://docs.google.com/spreadsheets/d/1jS24DjSPVWa4iuxuD4OAXrE3QeI8c9BC1hSlqr-NMiU/
edit#gid=1187587451 (data of Dr Kaiyuan Sun, NIH)
https://docs.google.com/spreadsheets/d/1itaohdPiAeniCXNlntNztZ_oRvjh0HsGuJXUJWET008/
edit#gid=0 (data compiled by Kraemer et al…)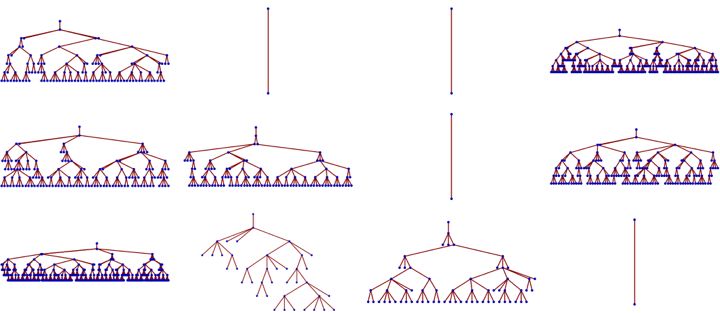
Clinical Progression

        •   Retrospective study:
                  • 99 confirmed cases in Wuhan Jinyintan Hospital, January 1-20 (follow
                     up to Jan 25)
                  • 67 men, 32 women,
                  • average age 55.5 (sd 13.1 so mostly over 40)
                  • 50% exposed to Huanan seafood market
                  • 50% had chronic disease
                  • Fever, cough, shortness of breath, pneumonia
                  • 31 patients discharged by Jan 25
                  • 17 patients had severe disease and 11 died

Chen et al, Lancet, January 29, 2020 (https://doi.org/10.1016/ S0140-6736(20)30211-7)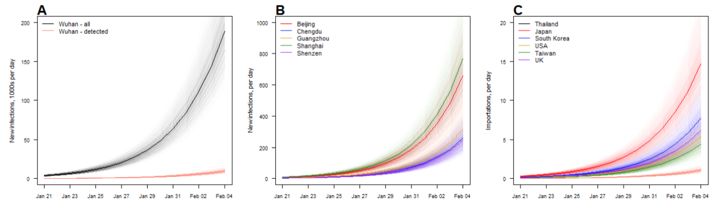
Coronavirus (CoV) infections

        • Four circulating coronaviruses causing influenza-like illness (ILI)
           • CoV found in 12% of ILI-presenting patients in 2018 USA
           • Of 111 CoV+ patients, 1 day total of hospitalization

        • Middle East Respiratory Syndrome (MERS)
           • Sporadically seen in people contacting dromedary camels
           • Occasional human-human transmission (larger outbreak in South
             Korea 2015)
           • Case fatality rate 30-40% (!!)

        • Sudden Acute Respiratory Syndrome (SARS)
           • Large outbreak 2002-2003
           • Approx 8000 cases worldwide (mostly China/Taiwan/HK)
           • 10% case fatality (!)
           • 250 cases in Canada, 43 deaths

Bouvier et al, Influenza Other Respir Viruses (2018)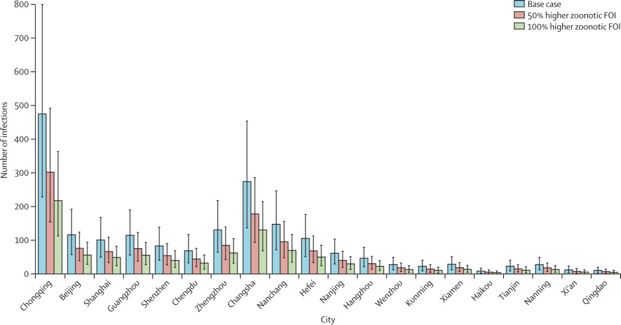
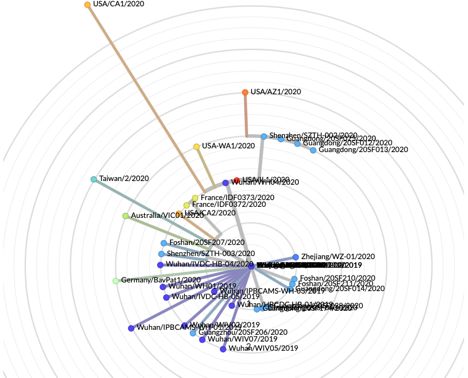
Evolution / phylogeny of nCoV in humans

        • With 42 public nCoV genomes, estimate phylogeny (family tree)

Trevor Bedford et al, posted at nextstrain.org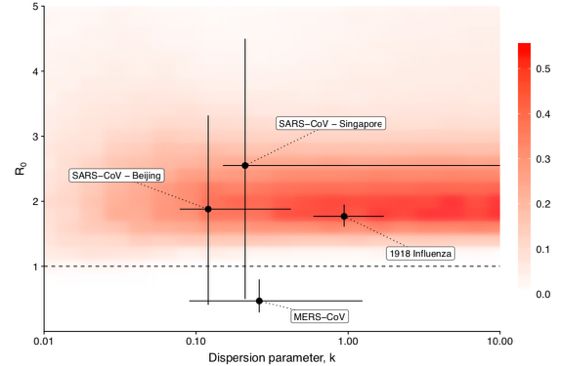
Evolution / phylogeny of nCoV in humans

        • With 42 public nCoV genomes, estimate phylogeny (family tree)

Trevor Bedford et al, posted at nextstrain.org
Evolution / phylogeny of nCoV in humans
• Minimal variation across samples points to single introduction into
human population in November / early December
Onset of first
confirmed case
Dec 1
Trevor Bedford et al, posted at nextstrain.orgQuestions to address through modeling / data: • What is the rate of spread in and among different populations? • How effective must public health measures be to stop the epidemic? • What is the course of disease in an infected person? • What is the predicted final size / end date of the epidemic?
The basic reproductive number: R0

• R0 is the average number of new infections caused by a single newly
  infected person at the beginning of the epidemic

• R0 > 1 : “exponential growth is possible”

• R0 < 1 : “extinction is guaranteed”
The basic reproductive number: R0

• R0 is the average number of new infections caused by a single newly
  infected person at the beginning of the epidemic

• R0 > 1 : “exponential growth is possible”

• R0 < 1 : “extinction is guaranteed”

    •   “Pandemic” influenza: R0 ~ 1.6
    •   Polio: R0 ~ 6
    •   SARS R0 ~ 2.5
    •   Measles: R0 ~ 18
    •   Pertussis: R0 ~15

• To find R0 empirically requires contact tracing and is a lot of work.
  Modeling infection process is important.
The basic reproductive number: R0
• Define:
• average contact rate c (per day)
• average probability of infection per contact p
• average duration of infectiousness T (day)
• Then R0 = c p T
• To control an epidemic, reduce c, p or T so R0 < 1.
• Reduce by
• Influenza: R0 ~ 1.6 so reduce contacts by 37%
• Measles: R0 ~ 18 so reduce contacts by 94%
• Achieve by vaccination (herd immunity) or segregation
• R0 tells us how strong must the public health response beEstimating R0 from incidence data
• Need serial interval information
(average time between serial
infection events)
• Use a model to parameterize the
serial interval
• Simple, useful: SEIR model
• Susceptible – Exposed – Infectious – Removed
• assume non-infectious for an exponentially-distributed period
(exposed class)
• then infectious for an exponentially-distributed period (infectious
class)Estimating R0 from incidence data
Estimating R0 from incidence data
Estimating R0 from incidence data
Incidence-based R0 for nCoV

                                        Using SARS estimates for serial interval, and
                                        SEIR or close variant:

                                        Zhao: 2.7 < R0 < 5.4 (Jan 23)
                                        Liu: 2.3 < R0 < 3.6 (Jan 25)

Liu: also estimate of incubation period 4.8+/-2.6 days

Zhao et al, bioRxiv 2020.01.23.916395
Liu et al, bioRxiv 2020.01.25.919787
Simulation-based R0 estimates for nCoV • Count “Infected people”: • Start with (e.g.) ONE infected person. • Each infected person makes k new infections with probability qk : R0 = average number of new infections produced by one infected cell, at the start of the infection. R0 = 1.5
1000
                                  500

               Number of cases
                                  100
   Number of infected people

                                   50

                                   10
                                    5

                                    1
                                        0   5   10       15         20   25
                                                Generation number

R0 = average number of new infections produced by one
infected person, at the start of the infection.
R0 = 1.5
After 10 generations
400
300
Frequency
200
100
0
0 100 200 300 400
# infected Number of cases
people after after 10 generations
10 generations
On average 41% of all these epidemics go extinct “early”“Super-spreader” model • Consider more aborted infections but a small probability of 10 new infections. R0 = 1.5 (maintained)
1000
                                        500
Number of cases

                                        100
                                         50
             Number of infected cells

                                         10
                                         5

                                         1
                                              0   5   10     15     20     25   30
                                                       Generation number
After 10 generations
80%
8000
Frequency
6000
4000
2000
A few
0
0 200 400 600 800 1000 1200
# infections
Number after
of 10 generations
cases after 10 generations
Observe: many extinctions (small outbreaks)
a few BIG epidemicsSimulation-based R0 estimates for nCoV
• Imai et al:
• Run many simulations with SARS-like new infection distribution and
SARS generation time (8.4 days)
• Include possible super-spreaders via wide distribution
• Keep only those parameter sets where >5% of all simulations with
those parameters match the data through 18 Jan.
• Estimate 1.5 < R0 < 3.5
• Note (baseline) 40 zoonotic infections (contradicts new info from
nextstrain.org)
• Riou et al:
• Similar approach
• Obtain 1.4 < R0 < 3.8
Imai et al (https://www.imperial.ac.uk/mrc-global-infectious-disease-analysis/news--wuhan-
coronavirus/, Jan 25)
Riou et al (bioRxiv 2020.01.23.917351, Jan 24)Simulation-based R0 estimates for nCoV
• Riou et al one parameter set:
Riou et al (bioRxiv 2020.01.23.917351, Jan 24)Simulation-based R0 estimates for nCoV
• Riou: heat map and comparison with previous epidemics
Riou et al (bioRxiv 2020.01.23.917351, Jan 24)Models with geographical spread
Kucharski et al:
•Stochastic SEIR model with time-varying
infectivity and wide infection distribution
•SARS incubation+infectious periods
•Fit to Wuhan and total int’l locations up to Jan
23
•Infectivity follows geometric Brownian
motion
•Include likelihood of reporting
Est. R0 = 1.6 – 2.9
P(outbreak) ~ 25%
Kucharski et al, https://cmmid.github.io/ncov/wuhan_early_dynamics/index.html (Jan 31)Models with geographical spread
• Read et al:
• Multi-location differential equation model
• Cities in China, other countries, data to Jan 21
• Each location has an SEIR model
• Linkages according to commercial air traffic data
• Predictions!
Read et al, medRxiv 2020.01.23.20018549 (Jan 24)Models with geographical spread
• Read et al:
• Multi-location differential equation model
• Cities in China, other countries, data to Jan 21
• Each location has an SEIR model
• Linkages according to commercial air traffic data
• Predictions!
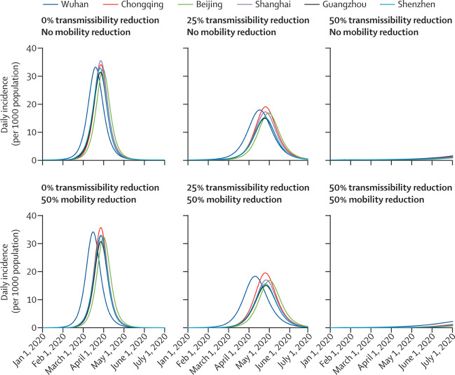
Read et al, medRxiv 2020.01.23.20018549 (Jan 24)Models with geographical spread Wu et al, Lancet, Jan 31 “Nowcasting and forecasting the potential domestic and international spread of the 2019-nCoV outbreak originating in Wuhan, China: a modelling study” •Data from Wuhan, Chinese cities and Int’l cases to Jan 28 •SEIR-type model in each location •SARS estimates for serial interval •Int’l flights and human mobility data for China •Estimate R0 = 2.47-2.86 •Chinese cities have large numbers of infections already and will see exponential growth, lagging Wuhan by 1-2 weeks
Models with geographical spread

Wu et al, Lancet, Jan 31 “Nowcasting and forecasting the potential domestic and
international spread of the 2019-nCoV outbreak originating in Wuhan, China: a
modelling study”

     Number of cases exported to each city
Models with geographical spread Wu et al, Lancet, Jan 31 “Nowcasting and forecasting the potential domestic and international spread of the 2019-nCoV outbreak originating in Wuhan, China: a modelling study”
Models with geographical spread
Backer et al, medRxiv 2020.01.27.20018986 (Jan 28)

•34 cases that were detected outside Wuhan with known travel dates

•Estimate incubation period 5.8 days (4.6-7.9 days)

•“findings of previous studies that have assumed incubation period distribution
similar to MERS or SARS will not have to be adapted because of a shorter or
longer incubation period”
R0 Summary
                           R0_lowe
study               R0     r       R0_upper               interval_type        approach

imai2020             2.6          1.5                3.5 uncertainty           branching process, NB offspring
riou2020             2.2          1.4                3.8 hpd            branching process, NB offspring
bedford2020                       1.5                3.5 uncertainty    simple branching process
                                                                        deterministic metapopulation
read2020             3.1          2.4                4.1 95% confidence SEIR transmission model

liu2020              2.9          2.3                3.6 95% confidence regression

zhao2020             3.3          2.7                  4 95% confidence regression
majumder2020                         2               3.1 uncertainty           regression (IDEA model)
                                                                               stochastic SEIR fitted by
kucharski2020                     1.5                  4 time-varying          sequential Monte Carlo

li2020               2.2          1.4                3.9 95% confidence renewal equation
abbott2020                           2               2.7 90% credible          branching process, NB offspring
                                                                               deterministic metapopulation
wu2020               2.7          2.5                2.9 95% credible          SEIR transmission model
Park et al (this afternoon) meta-analysis: “median of 3.1, 95% CI 2.1-5.7”
Fred Brauer (yesterday): “probably around 2”

Simon Frost, Microsoft
https://docs.google.com/spreadsheets/d/1QP5vM62ctnMRYdkQ4J5IqaOmB3hISGvYqCvnB8rBmNY/edit#gid=0
Caveats and Notes
• Data is likely to be patchy and not up-to-date
• Almost certainly there are more cases than reported
• How many asymptomatic cases?
• All studies have homogeneous populations
• if travel correlates negatively with infection, intercity spread before quarantine
was less
• Uncertainty around initial number of cases
• Changes in travel behaviour pre-restrictions
• Seasonality of infectiousness?References - General and Updating
• BC CDC Coronavirus updates (updated daily M-F)
• http://www.bccdc.ca/about/news-stories/stories/2020/information-on-novel-
coronavirus
• Imperial college modelling group page (includes Imai preprint)
• https://www.imperial.ac.uk/mrc-global-infectious-disease-analysis/
• Lancet coronavirus (includes Joe Wu preprint)
• https://www.thelancet.com/coronavirus
• Modelling virus evolution at Fred Hutchinson (very good site)
• nextstrain.org
• Simon Frost model summary page
• https://docs.google.com/spreadsheets/d/
1QP5vM62ctnMRYdkQ4J5IqaOmB3hISGvYqCvnB8rBmNY/edit#gid=0
• Data repositories
• https://docs.google.com/spreadsheets/d/
1jS24DjSPVWa4iuxuD4OAXrE3QeI8c9BC1hSlqr-NMiU/edit#gid=1187587451
• (data of Dr Kaiyuan Sun, NIH)
• https://docs.google.com/spreadsheets/d/
1itaohdPiAeniCXNlntNztZ_oRvjh0HsGuJXUJWET008/edit#gid=0
• (data compiled by Kraemer et al…)References - Preprints
• Bouvier et al 2018 (circulating coronavirus paper)
• https://onlinelibrary.wiley.com/doi/full/10.1111/irv.12538
• Zhao and Lu regression-based estimates of R0:
• https://www.biorxiv.org/content/10.1101/2020.01.23.916395v2
• https://www.biorxiv.org/content/10.1101/2020.01.25.919787v1
• Rio simulation approach
• https://www.biorxiv.org/content/10.1101/2020.01.23.917351v1
• Kucharski and Read simulation models with geo spread
• https://cmmid.github.io/ncov/wuhan_early_dynamics/index.html
• https://www.medrxiv.org/content/10.1101/2020.01.23.20018549v2
• Park et al (McMaster/Princeton group) meta- and sensitivity- analysis
• https://github.com/parksw3/nCoV_framework/blob/master/v2/ncov.pdf
• https://www.biorxiv.org/content/10.1101/683326v1You can also read