INNOVATING FOR 30 YEARS - REGIOGRAPH 2021 - LEADING SOFTWARE FOR GEOMARKETING - GFK GEOMARKETING WEBSHOP

Page created by Jennifer Sullivan
 
CONTINUE READING
INNOVATING FOR 30 YEARS - REGIOGRAPH 2021 - LEADING SOFTWARE FOR GEOMARKETING - GFK GEOMARKETING WEBSHOP
Innovating
for 30 years
RegioGraph 2021 –
leading software for geomarketing
INNOVATING FOR 30 YEARS - REGIOGRAPH 2021 - LEADING SOFTWARE FOR GEOMARKETING - GFK GEOMARKETING WEBSHOP
Celebrating 30 years of RegioGraph
              The development journey

                 1999                               2007                                        2011                                    2019                  TODAY
           More intuitive           extended analysis options,                            RegioGraph Strategy                      Add-on RegioGraph        Calculate score
         user interface and            incl. current maps &            2009               for detailed location                TeamConnect fort sharing      & workload,
            drag & drop               GfK Purchasing Power                                     evaluations                       results online with your    RegioGraph
                                                                 Planning of optimal
                                                            distribution areas as well as                                        team, planning view for    TeamConnect
  1991                       2001                               distance/time zones;                                 2017              more control         extended with
Presentation                 English                        incl. geocoder, background                         incl. online maps                             notifications
  at CeBIT              language version                      & Tele Atlas road maps                         from Microsoft Bing

               Celebrate with us, as we proudly look back on 30 years of RegioGraph — full of features,
                enhancements and innovations. With more than 40,000 users, RegioGraph is considered
                one of the leading software options in the field of geomarketing. Since then, a wide
                range of analysis tools have supported decision-makers from all industries in the spatial
                processing of their questions in marketing, sales, controlling and expansion.

  26-Feb-21    RegioGraph 2021 | www.gfk-regiograph.com                                                                                                       © GfK          2
INNOVATING FOR 30 YEARS - REGIOGRAPH 2021 - LEADING SOFTWARE FOR GEOMARKETING - GFK GEOMARKETING WEBSHOP
RegioGraph 2021
            Professional desktop software for wide-ranging analyses
Our award-winning geomarketing software gives you powerful tools for
optimizing sales territories, evaluating locations and analyzing markets directly
on digital maps. A user-friendly interface allows you to import your company
data at the click of a button and then compare it to the included GfK
purchasing power data.

The desktop version of RegioGraph is the right choice if you want to analyze
your markets or plan and evaluate your locations and sales territories using
non-standardized criteria and a broad spectrum of powerful analytic tools.

Key features of the desktop software:

   easy installation and quick importing
   tutorials and training courses* to get you up and running with the software
   comprehensive tools for analyzing and planning on digital maps
   numerous visualization options and free formatting of your data
   easy updating of your project data
   exporting in all common formats (PDF, spreadsheets, graphics, etc.)
   expandable with additional countries
   RegioGraph TeamConnect ADD-ON* available for sharing results online
    with your team

            *requires an additional fee
            © GfK | www.gfk-regiograph.com | Screenshot created with RegioGraph
26-Feb-21    RegioGraph 2021 | www.gfk-regiograph.com                              © GfK   3
INNOVATING FOR 30 YEARS - REGIOGRAPH 2021 - LEADING SOFTWARE FOR GEOMARKETING - GFK GEOMARKETING WEBSHOP
RegioGraph
                                                         applications

26-Feb-21    RegioGraph 2021 | www.gfk-regiograph.com                  © GfK   4
INNOVATING FOR 30 YEARS - REGIOGRAPH 2021 - LEADING SOFTWARE FOR GEOMARKETING - GFK GEOMARKETING WEBSHOP
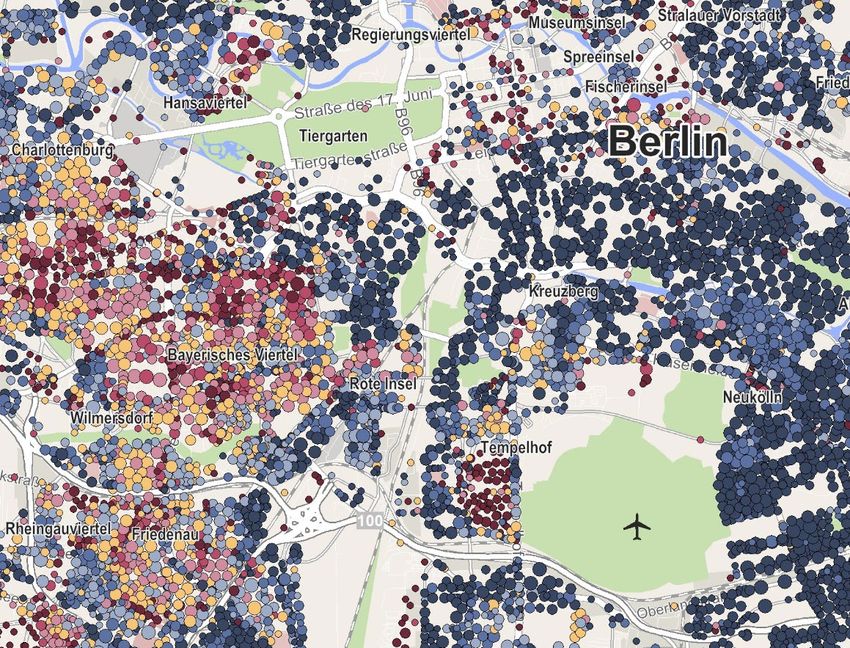
Import your company data for new insights
            Display your data by dragging & dropping it onto the map. This quickly reveals your
            customer and site distribution, turnover performance, sales assignments & product lines.

                                                                                           Customer
                                                                                           classification

                                                                                                category A

                                                                                                category B

                                                                                                category C

            © GfK | www.gfk-regiograph.com | Map created with RegioGraph
26-Feb-21    RegioGraph 2021 | www.gfk-regiograph.com                                                      © GfK   5
INNOVATING FOR 30 YEARS - REGIOGRAPH 2021 - LEADING SOFTWARE FOR GEOMARKETING - GFK GEOMARKETING WEBSHOP
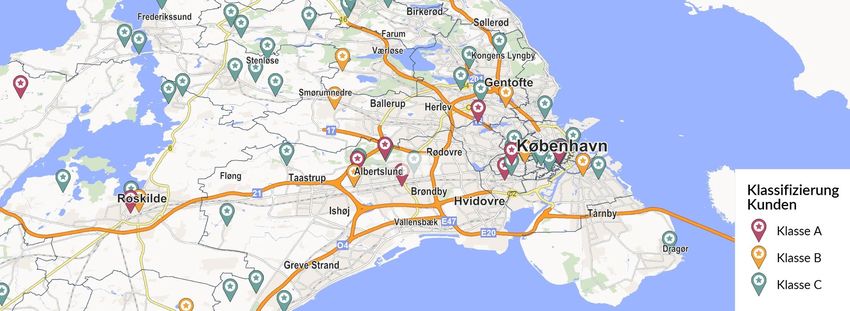
Pinpoint new market potential
            RegioGraph includes detailed, up-to-date data on inhabitants, households and purchasing
            power. Use these insights to identify new sales opportunities.

              2-digit postcodes

                    purchasing power
                                                                           5-digit postcodes
              low                          high

            © GfK | www.gfk-regiograph.com | Map created with RegioGraph
26-Feb-21    RegioGraph 2021 | www.gfk-regiograph.com                                            © GfK   6
INNOVATING FOR 30 YEARS - REGIOGRAPH 2021 - LEADING SOFTWARE FOR GEOMARKETING - GFK GEOMARKETING WEBSHOP
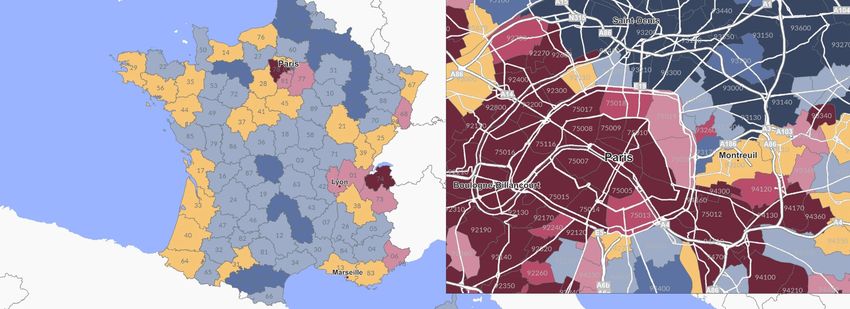
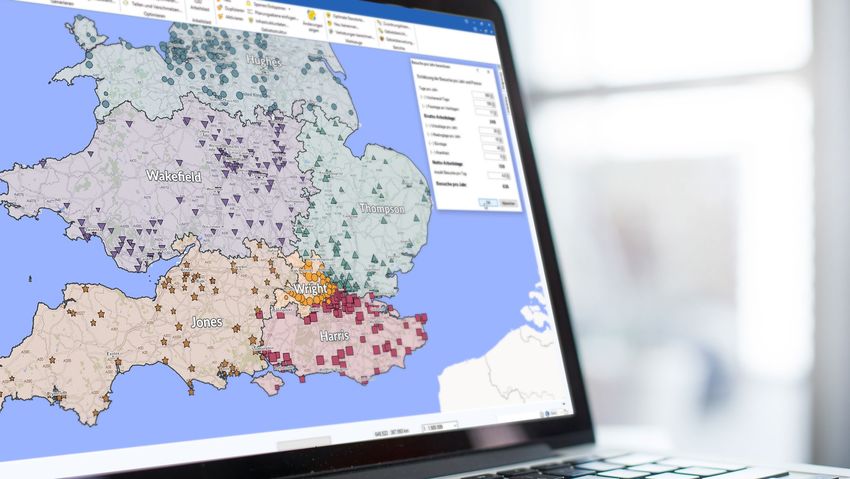
Identify your strong and weak regions
            Compare your sales territories based on criteria, such as turnover, customers and workload.
            This quickly reveals regional differences and provides the basis for subsequent optimizations.

                                                                       365 customers                                               694 h
                                                                       730 h
                                                                       € 14,729,482                                                                    126 h

                                                                                                                     364 h

                                                                                                                                                                 350 h
                                                                                                                                           480 h
                                                                                                                      714 h

                                                                                                           1,250 h

                                                                                                                                 730 h

                                                                                                              748 h
                                                                                                                                                     540 h
                                                                                                                                 1,114 h

                                                                                                                       1,692 h
                                                                                                                                                   1,200 h
                                    364 customers
                                    748 h                                              557 customers
                                    € 9,838,516                                        1,114 h
                                                                                       € 19,760,297
                                                                                                       Deviation from workload target
                                                                                                          on target                      too low               too high

            © GfK | www.gfk-regiograph.com | Maps created with RegioGraph
26-Feb-21    RegioGraph 2021 | www.gfk-regiograph.com                                                                                                                    © GfK   7
INNOVATING FOR 30 YEARS - REGIOGRAPH 2021 - LEADING SOFTWARE FOR GEOMARKETING - GFK GEOMARKETING WEBSHOP
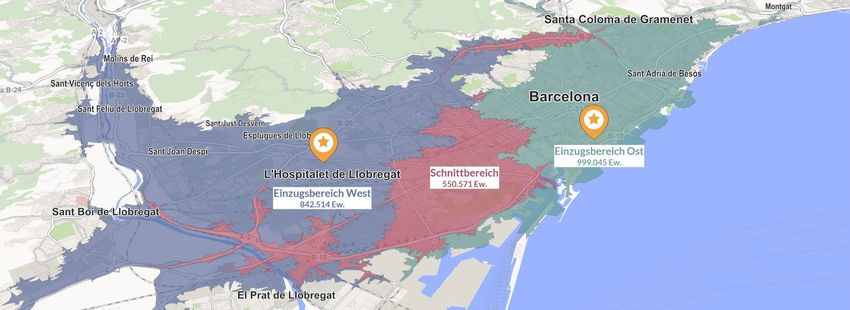
Analyze your branch network
            Optimize your catchment areas according to driving distance, driving time or competitor
            factors. This brings clarity and efficiency to your operations.

                                                                                                                         catchment area EAST
                                                                                                                           999,045 inhabitants
                                                                                                        overlap
                                                                                                   550,571 inhabitants
                                                                           catchment area WEST
                                                                             842,514 inhabitants

            © GfK | www.gfk-regiograph.com | Map created with RegioGraph
26-Feb-21    RegioGraph 2021 | www.gfk-regiograph.com                                                                                           © GfK   8
INNOVATING FOR 30 YEARS - REGIOGRAPH 2021 - LEADING SOFTWARE FOR GEOMARKETING - GFK GEOMARKETING WEBSHOP
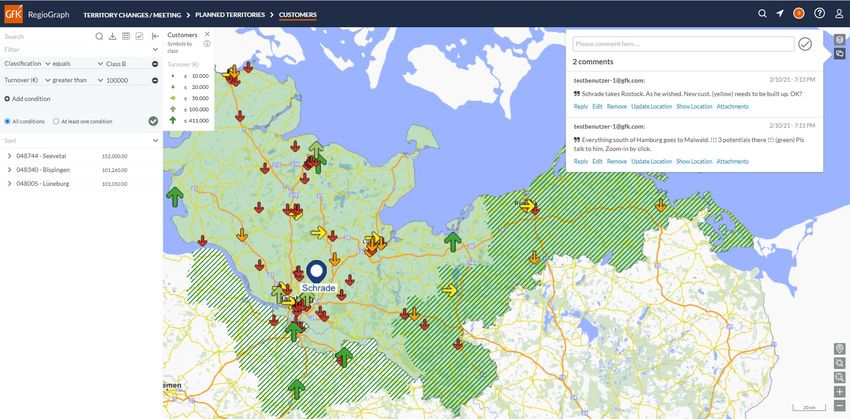
Locate your target groups at
            detailed regional levels
            Integrate street segment-level GfK data on end consumers or D&B address data on
            business potential to pinpoint your target groups.

                                                                            D&B business potential
                                                                                                             GfK consumer potential, Germany
                                                                            NACE description
                                                                                manufacturer of beer (331)
                                                                                manufacturer of soft                 purchasing power
                                                                                drinks (22)
                                                                            number of employees
                                                                                                             low                        high

                                                                                                                        inhabitants
                                                                                                             fewer                      more

            © GfK | www.gfk-regiograph.com | Maps created with RegioGraph
26-Feb-21    RegioGraph 2021 | www.gfk-regiograph.com                                                                                         © GfK   9
INNOVATING FOR 30 YEARS - REGIOGRAPH 2021 - LEADING SOFTWARE FOR GEOMARKETING - GFK GEOMARKETING WEBSHOP
Communicate results with
            illuminating reports
            Create multi-page PDFs that show detailed analyses of locations or territories.

                                Contents
                                                       Overview of branch network
                                                       Overview map                 Potential
                                                                                    Potential    [retail
                                                                                              [retail    purchasing
                                                                                                      purchasing powerpower
                                                                                                                      €]    €]

             Branch network                                                                                                      Market
                                                                                                                                 Marketshare zones
                                                                                                                                         share     for Westerstr.
                                                                                                                                                zones             34
                                                                                                                                                        for Westerstr. 34
             analysis

                                                                                                                                                                            Retail purchasing power (€)
                                                                                                                                                                            Market share zones (current)

            © GfK | www.gfk-regiograph.com | Report created with RegioGraph
26-Feb-21    RegioGraph 2021 | www.gfk-regiograph.com                                                                                                                                                     © GfK   10
Share results online with your team
            using the TeamConnect add-on
            Want your colleagues to have
            access to your current project
            from wherever they are?

            Use the TeamConnect add-on to
            share market analyses and quarterly
            evaluations with your colleagues.
            Browser-based access means your
            team is always on the same page,
            regardless of their location. You also
            have full control over who sees what.

            © GfK | www.gfk-regiograph.com/connect | Screenshot created with RegioGraph TeamConnect
26-Feb-21    RegioGraph 2021 | www.gfk-regiograph.com                                                © GfK   11
Highlights of the
                                                         new version

26-Feb-21    RegioGraph 2021 | www.gfk-regiograph.com                 © GfK   12
Calculate your workload
            and set realistic goals
            Using the new calculation wizard you can determine the ideal workload of your sales force
            for customer visits. This provides you with a realistic basis to plan and optimize your targets.

            © GfK | www.gfk-regiograph.com | Map created with RegioGraph
26-Feb-21    RegioGraph 2021 | www.gfk-regiograph.com                                                 © GfK   13
Evaluate and compare locations
            using an individual benchmark score
            RegioGraph calculates a score based on your criteria and weighting. This allows you to
            compare the performance of your locations or the potential in regions.

            © GfK | www.gfk-regiograph.com | Map created with RegioGraph
26-Feb-21    RegioGraph 2021 | www.gfk-regiograph.com                                               © GfK   14
Easily find the right parameters
            for your data analysis
            Solid data analysis will quickly give you the right answers. The newly integrated histogram
            helps you set the ideal value limits to achieve better informative value of your analyses.

            © GfK | www.gfk-regiograph.com | Map created with RegioGraph
26-Feb-21    RegioGraph 2021 | www.gfk-regiograph.com                                               © GfK   15
Work only with map sections
            or regions that you need
            If you work on regional level, you can cut all layers of a project to the selected area,
            such as a state or your individual sales territory.

            © GfK | www.gfk-regiograph.com | Map created with RegioGraph
26-Feb-21    RegioGraph 2021 | www.gfk-regiograph.com                                                 © GfK   16
Notify your colleagues online
            with reference to a map section
            Communicate with your team via the new notifications function to exchange information directly
            online, referring to a map section. For example, you can point out current figures or new customers.

            © GfK | www.gfk-regiograph.com/connect | Screenshot created with RegioGraph TeamConnect
26-Feb-21    RegioGraph 2021 | www.gfk-regiograph.com                                                   © GfK     17
Key new features
            Version 2021 and later:                                                 Version 2020 and later:
             Calculate workload                                                     Enhanced planning view
              Using the new calculation wizard you can determine the ideal            up to four charts simultaneously and compare additional
              workload of your sales force for customer visits. This provides         data columns for more control when planning.
              you with a realistic basis to plan and optimize your targets.
                                                                                     Display of territory changes
             Calculate a score (comparison value)                                    Show changes to your territories at any time at the click of a
              RegioGraph calculates a score based on your criteria and                button. Impacted areas are shaded for easy recognition.
              weighting. This allows you to compare the performance of your
              locations or the potential in regions.                                 TeamConnect add-on
                                                                                      The latest version of TeamConnect comes with new
             Set value limits with histogram                                         features. Legends and labels are imported from your
              The newly integrated histogram helps you set the ideal value            RegioGraph project and can be shown or hidden at any time.
              limits to achieve better informative value of your analyses.            Display many additional analyses, such as delivery flows,
                                                                                      drive-time zones, etc. You can also access a comprehensive
             Cut layer                                                               table with filter functionality for each layer.
              You can cut all layers of a project to the selected area, such as a
              state or your individual sales territory.
             Add-on RegioGraph TeamConnect
              Communicate with your team via the new notifications
              function to exchange information directly online, referring to a
              map section. Search, filter and sort functions have been added
              to the overall table.

26-Feb-21    RegioGraph 2021 | www.gfk-regiograph.com                                                                                   © GfK         18
Select the software version that’s right for you
            Learn more about the applications of the software versions
            in a short video: www.gfk-regiograph.com/comparison.

RegioGraph Analysis                                                 RegioGraph Planning                                    RegioGraph Strategy                                    Add-on RegioGraph TeamConnect
offers the fundamental tools necessary for                          includes intelligent tools for sales territory         provides powerful tools for detailed location          allows you to share results online with your team
analyzing your customers, turnover and potential.                   planning and optimization as well as                   evaluations based on potential and                     for current insights into your planning.
                                                                    street-level customer analyses.                        competitor influences.

Basic version

    easy data import by postal codes (geocoding)
                                                                    In addition to all contents of Analysis

                                                                        easy data import by address (geocoding)
                                                                                                                           In addition to all contents of Planning

                                                                                                                               street segment-level analyses
                                                                                                                                                                              +       RegioGraph Analysis, Planning, or Strategy
                                                                                                                                                                                      required for project creation
                                                                                                                                                                                  easy uploading project results to your company’s
   updating of data                                                   professional sales territory optimization tools       e.g. competition, prospective customers                own web server
   diverse market analyses (e.g., ABC, customer density,              planning view with dashboard interface,               location evaluation and planning with                 incl. 10 viewers with browser-based access to
    portfolio, charts, etc.) & customizable formatting                 including map, charts and a table                      consideration of competitors                           shared projects from various end devices
   NEW: Set value limits with histogram                               NEW: Calculate workload                               detailed reporting for micro-data in data             (extension for additional viewers possible)
   NEW: Calculate a score (comparison value)                          calculation of catchment areas                         analysis mode                                         assign access rights for selected viewers
   NEW: Cut layer                                                     detailed reporting                                    optional integration of detailed data on end          presentation of the diverse market analyses and
   results exportable as a PDF, MS Excel file, image, etc.            online maps and aerial imagery from Bing**             consumers and business potential possible              sales structures on the interactive map
                                                                                                                                                                                     overview of all data in an overall table
from 920€ per year*                                                 from 2,570€ per year*                                  from 4,370€ per year*                                      with search, filter, and sort functions
                                                                                                                                                                                     NEW: Notifications with location reference for
                                                                                                                                                                                      team communication

                                                                                                                                                                                  ab 2.570€ pro Jahr*

            All prices exclude VAT. GfK GeoMarketing’s licensing conditions and general terms and conditions apply (www.gfk-geomarketing.com/licensing).

            * Price for the first year within a 3-year subscription with an annual increase of max. 3%.
            ** License to use Bing for 12 months or until the next update.
26-Feb-21    RegioGraph 2021 | www.gfk-regiograph.com                                                                                                                                                                 © GfK             19
How RegioGraph adds value

                         professional analysis tools       actual, integrated GfK maps and data        share results online & communicate

                         usability for business users    quick start thanks to GfK training courses   free customer hotline & video tutorials

26-Feb-21    RegioGraph 2021 | www.gfk-regiograph.com                                                                             © GfK        20
30 years of RegioGraph, more than 40,000 users
            We say "Thank you!" for your loyalty

            With RegioGraph, we convince our customers and
            colleagues with clear and professional visualizations on
            maps. The software enables us to identify and communicate
            sometimes confusing correlations between data in an
            understandable way and with little effort.

            Matthias Schäfer
            Project Manager Logistics, MAZMAIL GmbH

26-Feb-21    RegioGraph 2021 | www.gfk-regiograph.com                  © GfK   21
We work with market leading companies

26-Feb-21    RegioGraph 2021 | www.gfk-regiograph.com   © GfK   22
Questions?
            Contact us at any time.

            Your Geomarketing team

                +49 7251 9295 200

                geomarketing@gfk.com

                www.gfk-regiograph.com

            More about our solutions:

                       PRODUCT CATALOG

                              WEBSHOP

26-Feb-21    RegioGraph 2021 | www.gfk-regiograph.com   © GfK   23
You can also read