Stock Market Prediction using Machine Learning Techniques - irjet
←
→
Page content transcription
If your browser does not render page correctly, please read the page content below
International Research Journal of Engineering and Technology (IRJET)                                          e-ISSN: 2395-0056
         Volume: 07 Issue: 06 | June 2020                   www.irjet.net                                              p-ISSN: 2395-0072

          Stock Market Prediction using Machine Learning Techniques
                                            Vaibhavi1, K. Viswavardhan Reddy2
                     1Student,   Dept. Tele Communication, RV College of Engineering, Bengaluru, India
              2Assistant   Professor, Dept. Tele Communication, RV College of Engineering, Bengaluru, India
---------------------------------------------------------------------***----------------------------------------------------------------------
Abstract - Stock market prediction is act of trying to                    index is very significant for various objectives. Few of old
determine future value of stock. As study of stock market                 methods reduced the risk of investment for investor and
subject is very vast and huge; hence, it is difficult to predict          supported in identifying prospects for investor.
accurate value of stock. So, in this work we will be using
machine learning algorithms to predict the accurate value of                 From the study, it is observed that machine learning is
stock. There are numerous ways of executing the forecast                  widely used technique in the field of stock market prediction.
system like Fundamental Analysis, Technical Analysis, Market              Also it is found that most of the authors implemented
Mimicry and Time series aspect structuring. Machine learning              Random Forest and Long Short Term Memory (LSTM)
is one of the trending and promising technologies in the field            techniques to forecast the future value of stock [2], [3], [8].
of stock market. In this paper we used Linear Regression (LR),               In [1] authors implemented linear regression and LSTM
Random Forest and Time Series Prediction algorithms. From                 (Long Short Term Memory) models. The built model is then
the results, it is seen that Random Forest has shown promising            evaluated by using test dataset of stock market which is
results when the system is trained with 80-20%.                           taken from Yahoo Finance. And authors deduce that
                                                                          Regression encompasses minimizing error and Long Short
Key Words: -Stock market, Machine Learning, Linear                        Term Memory says to remember the data and results for the
Regression, Random Forest, Time series Prediction.                        long run.

                                                                             Authors have suggested a stock market forecast based on
1. INTRODUCTION
                                                                          social media opinions [2]. Where authors seek to forecast the
                                                                          stock market prices of numerous organizations by carrying
An individual owning a percentage of the share in a                       out sentiment analysis of the social media data such as
corporation has the ownership in the corporation                          tweets associated with the respective organization. The
proportionate to his share that is an inventory in preferred              paper describes how Twitter will support you to become a
indicates rights on business enterprise with the aid of a                 better investor by making suitable investment choices with
selected individual or a set of people. The stock market is               its information of the market emotions.
mainly a combination of various buyers of stock and sellers
of stock, which signify ownership rights on businesses; these                 [7] Proposed a method of feature extraction for selection
may comprise securities listed on a public stock exchange, as             of useful stock indexes and proposes deep learning model to
well as stock that are traded private only. The effort to define          perform sentiment analysis of financial news as another
the future rate of the stock market is known as a stock                   influencing factor for influencing stock trend. Then it
market prediction. The system must predict as per the real-               proposes model which forecasts share market price by using
life conditions and should suit to real world applications. The           LSTM. Proposed paper method with feature compression
model is also has to consider all the variables that may affect           and sentiment analysis for stock market forecasting and it
the stock's price and performance such as Stock bonus /split              improved accuracy than SVR (support vector regression) by
/dividend, Management change (weak/strong) Political and                  about 20%. Market sentiments were trapped by sentiment
regulatory environment/statement by a political leader, new               analysis and it is a very significant factor for influencing
releases on earnings and profits etc.                                     stock trends and improves prediction accuracy by 5%.
  Stock market forecasting has expanded massive
popularity in financial markets across the world. The
proficiency to predict the direction of a stock price or an

© 2020, IRJET        |     Impact Factor value: 7.529          |    ISO 9001:2008 Certified Journal             |   Page 6780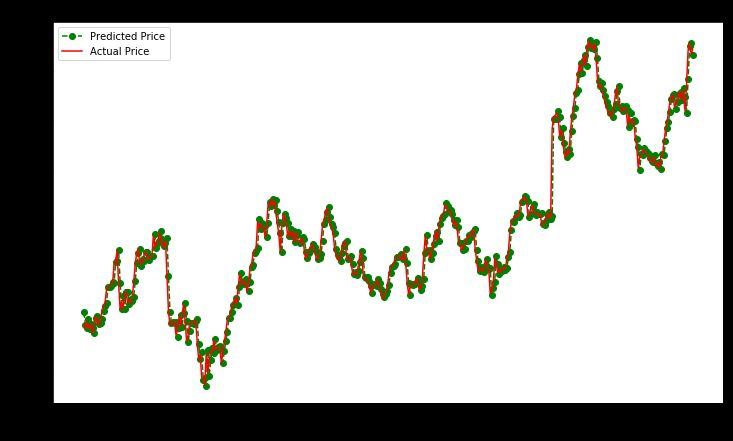
International Research Journal of Engineering and Technology (IRJET)                                     e-ISSN: 2395-0056
         Volume: 07 Issue: 06 | June 2020               www.irjet.net                                            p-ISSN: 2395-0072

2. PROPOSED METHODOLOGY

Figure 1 shows the process involving in stock market prediction.

                                                    Fig -1: System Architecture
   For this work input data is collected from yahoo finance.
We have collected data of 5 years from 2016 to 2020. The                                                                         (2)
collected dataset has four features that is Open, Close, High
and Low. Further the dataset is divided into two parts, that is
training and testing dataset. We examined algorithms for                  In this work X is date, y is open, close, high and low price
three cases, 1. 80% training and 20% testing, 2. 70% training          of stock. Where, open price is stock at which opens at the
and 30% testing and 3. 60% training and 40% testing to                 start of market, close price is price at the closing hour, high
check the accuracy of algorithms.                                      price is highest bid of the day, and low price is lowest bid of
                                                                       the day.
2.1 Linear Regression Model
                                                                          Accuracy of the linear regression algorithm is calculated
Basically regression based models are used in evaluation of            by using R-Square method as discussed in equation 3. R2 is
continuous data. It is predictive modelling technique which            used to determine best fit of the line which is given as
is used to determine the relationship between independent              follows,
and dependent variables as discussed in equation (1). It also
                                                                                                                                 (3)
determines the correlation between two variables. Equation
for linear regression is as follows,

                                                         (1)             Where, yp is predicted value and y is actual value.

                                                                       2.2 Random Forest Model
   Where, X is independent variable and y is dependent
variable, m is slope of the line as discussed in equation 2 and
                                                                       Random forest is one of the widely used model in prediction
c is intercept. Least square method is used to determine the
                                                                       of stock [9]. It works on the principle of decision tree. It is a
regression line (the one with least error). Slope of the line is
                                                                       type of ensemble learning. The figure 2 shows the basic
calculated by following equation,
                                                                       diagram of random forest where it uses many decision trees
                                                                       to predict the outcomes therefore it is also called as
                                                                       ensemble learning technique. Steps involved in creating tree
                                                                       are as follows:

© 2020, IRJET       |   Impact Factor value: 7.529         |       ISO 9001:2008 Certified Journal         |   Page 6781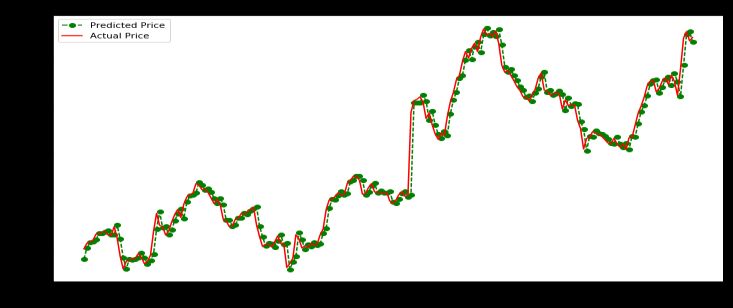
International Research Journal of Engineering and Technology (IRJET)                                    e-ISSN: 2395-0056
         Volume: 07 Issue: 06 | June 2020                  www.irjet.net                                        p-ISSN: 2395-0072

   i.    Consider a parent node and split the parent node              3. EXPERIMENT RESULTS
         into two daughter nodes.
  ii.    Splitting of parent node into daughter nodes is               In this work, data is collected from yahoo finance and the
         depends on splitting principle as in equation (4).            collected data is divided into training and testing set.

 iii.    Base (bottom) nodes are known as terminal nodes.                 Chart 1 shows the HUL stock performance of last five
                                                                       years. From graphs it is observed that, stock market rate of
  iv.    For regression the predicted value at a node is               HUL varies randomly. In above figures open, close, high and
         calculated by taking the average response of                  low prices of stocks are indicated by red, yellow, orange and
         variable for all observations in the node.                    green colors respectively. Open price is day’s opening price,
                                                                       close price is day’s closing price, high price is day’s highest
  v.     Splitting principle: For Regression splitting of nodes
                                                                       bid, and low price is day’s lowest bid.
         is calculated by using residual sum square
                                                             (4)

         Where,     = mean y-value for left node

                        = mean y-value for right node

                                                                               Chart -1: 5 Years stock performance of HUL

                                                                       From yahoo finance, we have collected previous five years
                                                                       data for eight stocks that is Asian Paints, Axis Bank, Bajaj
                                                                       Finance, HUL, Titan, TCS, Titan, Tech Mahindra.
                                                                          Chart 2 shows the graph between actual price and
                                                                       predicted price of Hindustan Unilever Limited of Linear
                                                                       Regression for 3 cases 80% training 20% testing shown in
           Fig -2: Random Forest’s Decision Tree                       2(a), 70% training 30% testing shown in 2(b) and 60%
                                                                       training 40% testing shown in 2(c). In the below charts red
                                                                       line is indicating the regression line which maps predicted
2.3 Time Series Prediction Model                                       values with actual data points. Moreover, it is seen that from
                                                                       regression line, the actual data points are far away and this
In time series prediction there are many methods to analyze            indicates the error. Therefore, accuracy obtained for 80-20%
input stock data in order to extract useful information and            is 94.35, for 70-30% is 94.16 and for 60-40% is 93.46. And it
characteristics of data. In this, for prediction of future stock       is seen that for Hindustan Unilever Limited, Linear
price previous year data is used. An autoregressive                    Regression gives better accuracy for 80% training and 20%
integrated moving average (ARIMA) model is an overview of              testing set.
an autoregressive moving average (ARMA) model. Both of
these models are used to predict the future values in the
series as in equation 5 and to understand the data
thoroughly. Essentially the ARIMA model is a "cascade" of
two models. The first is non-stationary and the second is
wild stationary,
                                                     (5)

                                                                             Chart 2(a): Hindustan Unilever Limited[80-20]

© 2020, IRJET       |    Impact Factor value: 7.529          |     ISO 9001:2008 Certified Journal        |   Page 6782
International Research Journal of Engineering and Technology (IRJET) e-ISSN: 2395-0056
Volume: 07 Issue: 06 | June 2020 www.irjet.net p-ISSN: 2395-0072
Chart 2(b): Hindustan Unilever Limited[70-30]
Chart 3(a): Hindustan Unilever Limited[80-20]
Chart 2(c): Hindustan Unilever Limited[60-40]
Table 1 shows the accuracy calculated by Linear Chart 3(b): Hindustan Unilever Limited[70-30]
Regression model for 3 cases. From the table, it is observed
that Linear Regression model of Machine Learning technique
gives better accuracy when we consider 80% training and
20% testing set.
Table -1: Accuracy Calculated by LR
Chart 3(c): Hindustan Unilever Limited[60-40]
Table 2 shows the accuracy calculated by Random Forest
model for 3 cases. From the table, it is observed that Random
Forest model of Machine Learning technique gives better
accuracy when we consider 80% training and 20% testing
set.
Table -2: Accuracy Calculated by RF
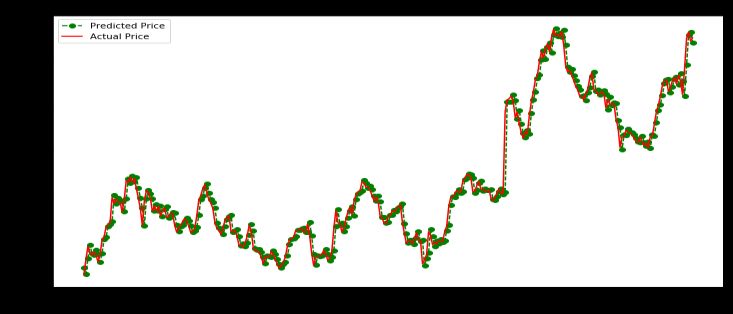
Chart 3 shows the graph between actual price and
predicted price of Hindustan Unilever Limited of Random
Forest for 3 cases 80% training 20% testing shown in 3(a),
70% training 30% testing shown in 3(b) and 60% training
40% testing shown in 3(c). In the below charts red curve
indicates predicted points and blue points are actual data
points. From charts it’s observed that predicted data points
exactly matches to actual data points. Accuracy obtained for
80-20 is 99.9, for 70-30 is 99.88 and for 60-40 is 99.77. And
it is seen that for Hindustan Unilever Limited, Random
Forest model gives better accuracy for 80% training and
20% testing set.
© 2020, IRJET | Impact Factor value: 7.529 | ISO 9001:2008 Certified Journal | Page 6783International Research Journal of Engineering and Technology (IRJET) e-ISSN: 2395-0056
Volume: 07 Issue: 06 | June 2020 www.irjet.net p-ISSN: 2395-0072
Chart 4 shows the graph between actual price and Table -3: Accuracy Calculated by TSP
predicted price of Hindustan Unilever Limited of Time Series
Prediction for 3 cases 80% training 20% testing shown in
4(a), 70% training 30% testing shown in 4(b) and 60%
training 40% testing shown in 4(c). In the above figures red
curve indicates predicted points and green points are actual
data points. From figures it’s observed that predicted data
points exactly matches to actual data points. Accuracy
obtained for 80-20 is 97.82, for 70-30 is 97.89 and for 60-40
is 98.09. And it is seen that for Hindustan Unilever Limited,
Time Series Prediction gives better accuracy for 60%
training and 40% testing set.
By comparing accuracy of different algorithms, it is
noticed that Linear Regression model and Random Forest of
Machine Learning technique gives better accuracy when we
given with 80% training set and 20% testing set. Also it is
seen that Time Series Prediction model of Machine Learning
technique gives better accuracy when we given with 60%
training and 40% testing set. From this we can conclude that
Chart 4(a): Hindustan Unilever Limited[80-20] Random Forest gives better accuracy compared to Linear
Regression model and Time Series Prediction algorithm in
prediction of stock prices.
4. CONCLUSIONS
Proposed models are used to predict the accurate value of
stock index from the given inputs as well as used to calculate
the accuracy of each algorithm. We study the use of Linear
Regression, Random Forest and Time Series Prediction
models to predict price of different stocks.
Chart 4(b): Hindustan Unilever Limited[70-30] Of these algorithms, we saw that Random Forest model
gave us accurate results with an accuracy of (98 ±1) %. So
we conclude that Random Forest model gives better
accuracy and it is most suitable algorithm for forecasting the
price of stock. From this work we have got satisfactory
results by predicting the price of stock from historical data.
And as the proposed models can only predict the price of
stock for next trading day.
In the future we will be trying to predict price of stock by
using real time signals, and we will try to implement
different algorithms which will gives better accuracy than
Random Forest Algorithm.
Chart 4(c): Hindustan Unilever Limited[60-40]
Table 3 shows the accuracy calculated by Time Series REFERENCES
prediction for 3 cases. From the table, it is observed that Time
Series Prediction model of Machine Learning technique gives [1] I. Parmar et al., "Stock Market Prediction Using Machine
better accuracy when we consider 60% training set and 40% Learning," in the proceeding of First International
testing set. Conference on Secure Cyber Computing and
Communication (ICSCCC), Jalandhar, India, 2018, pp.
574-576.
[2] T. Mankar, T. Hotchandani, M. Madhwani, A. Chidrawar
and C. S. Lifna, "Stock Market Prediction based on Social
© 2020, IRJET | Impact Factor value: 7.529 | ISO 9001:2008 Certified Journal | Page 6784International Research Journal of Engineering and Technology (IRJET) e-ISSN: 2395-0056
Volume: 07 Issue: 06 | June 2020 www.irjet.net p-ISSN: 2395-0072
Sentiments using Machine Learning," in the proceeding
of International Conference on Smart City and Emerging
Technology (ICSCET), Mumbai, 2018, pp. 1-3.
[3] R. Batra and S. M. Daudpota, "Integrating Stock Twits
with sentiment analysis for better prediction of stock
price movement," in the proceeding of International
Conference on Computing, Mathematics and
Engineering Technologies (iCoMET), Sukkur, 2018, pp.
1-5.
[4] Hegazy, Osman et al., “A Machine Learning Model for
Stock Market Prediction,” in the proceeding of
International Journal of Computer Science and
Telecommunications, Egypt, 2016, volume 4,pp. 17-23.
[5] H. Gündüz, Y. Yaslan and Z. Çataltepe, "Stock market
prediction with deep learning using financial news," in
the proceeding of 26th Signal Processing and
Communications Applications Conference (SIU), Izmir,
2018, pp. 1-4.
[6] Mruga Gurjar et al., “ Stock market prediction using
ANN,” in the proceedings of International Research
Journal of Engineering and Technology (IRJET), Pune,
India, 2018, volume 5.
[7] S. S. Maini and K. Govinda, "Stock market prediction
using data mining techniques," in the proceeding of
International Conference on Intelligent Sustainable
Systems (ICISS), Palladam, 2017, pp. 654-661.
[8] B. Jeevan, E. Naresh, B. P. V. kumar and P. Kambli, "Share
Price Prediction using Machine Learning Technique," in
the proceeding of 3rd International Conference on
Circuits, Control, Communication and Computing (I4C),
Bangalore, India, 2018, pp. 1-4.
[9] Hakob GRIGORYAN, “A Stock Market Prediction Method
Based on Support Vector Machines (SVM) and
Independent Component Analysis (ICA)”, in the
proceeding of DSJ 2016.
© 2020, IRJET | Impact Factor value: 7.529 | ISO 9001:2008 Certified Journal | Page 6785You can also read