Prediction of Stock Exchange Share Price using ANN and PSO
←
→
Page content transcription
If your browser does not render page correctly, please read the page content below
Prediction of Stock Exchange Share Price using ANN and PSO
 Atanu Pal (11111012)                                   Diptarka Chakraborty (11111016)

 palatanu@iitk.ac.in                                diptarka@iitk.ac.in
Abstract:                                                 will give better estimation on share market
Stock Exchange Share Price is very hard to predict
                                                          return than that given by already existing
since there are no significant rules to estimate or       system.
predict that. Stock price prediction is one of the
emerging field of research and many methods like             Artificial Neural Network:
technical analysis, statistical analysis, time series
analysis etc are used for this purpose. Artificial           Artificial neural networks (ANN) have been
Neural Network is a popular technique for the stock          developed        as    generalizations     of
price prediction. Here we use Multilayer Feed-               mathematical models of biological nervous
forward network as a network model for predicting            systems. A first wave of interest in neural
stock price and to train this network model we are           networks (also known as connectionist
going to use Particle Swarm Optimization.                    models or parallel distributed processing)
                                                             emerged after the introduction of simplified
Introduction:                                                neurons by McCulloch and Pitts (1943). The
                                                             basic processing elements of neural
The stock market is one of the most popular                  networks are called artificial neurons, or
investing places because of its expected                     simply neurons or nodes. In a simplified
high profit. So, people always want to know                  mathematical model of the neuron, the
expectation of return on investment in                       effects of the synapses are represented by
share market before investing money. In                      connection weights that modulate the
                                                             effect of the associated input signals, and
recent years, most of the researchers have
                                                             the nonlinear characteristic exhibited by
been concentrating their research work on                    neurons is represented by a transfer
the future prediction of share market return                 function. The neuron impulse is then
by using Artificial Neural Network. All the                  computed as the weighted sum of the input
researchers use different learning algorithm                 signals, transformed by the transfer
to train their system and to determine                       function.
different parameters of their system and                     The learning capability of an artificial
                                                             neuron is achieved by adjusting the weights
the learning algorithms include minimizing
                                                             in accordance to the chosen learning
least-square based objective function or                     algorithm. There are several learning
using gradient descent learning algorithm.                   algorithm (e.g. Hebbian Learning Rule,
Our motivation is also design this problem                   Perceptron Learning Rule, Backpropagation
using Artificial Neural Network, but we                      Learning Rule) known for such weight
want to apply Particle Swarm Optimization                    adjustment and now-a-days Genetic
                                                             Algorithm       (GA),    Particle      Swarm
to update different parameters of the
                                                             Optimization (PSO) are also be used for
system. As Particle Swarm Optimization
                                                             adjustment of weight of ANN.
method optimizes a problem by iteratively
trying to improve a candidate solution, so it
may possible that if we apply it for this                    Particle Swarm Optimization:
problem to update different parameters of
                                                             Particle swarm optimization (PSO) is a
Artificial Neural Network, then our system
                                                             population based stochastic optimization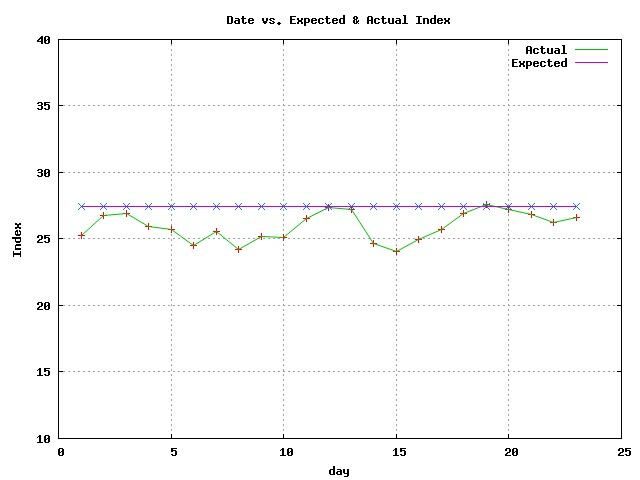
technique developed by Dr. Eberhart and 4. Terminate on some condition
Dr. Kennedy in 1995, inspired by social
5. Go to step 2
behavior of bird flocking or fish schooling.
The system is initialized with a population 6. Update each particle in each
of random solutions and searches for generation using
optima by updating generations. In PSO, the
potential solutions, called particles, fly v[i] = v[i] + * rand() * (pbest[i] -
through the problem space by following the present[i]) + * rand() * (gbest[i] -
current optimum particles. Each particle present[i])
keeps track of its coordinates in the and
problem space which are associated with
the best solution (fitness) it has achieved so present[i] = persent[i] + v[i]
far. (The fitness value is also stored.) This
where c1 and c2 are learning factors
value is called pbest. Another "best" value
(weights)
that is tracked by the particle swarm
optimizer is the best value, obtained so far Inertia Weight
by any particle in the neighbors of the
particle. This location is called lbest. When a d is the dimension, c1 and c2 are positive
particle takes all the population as its constants, rand1 and rand2 are random
topological neighbors, the best value is a numbers, and w is the inertia weight
global best and is called gbest. The particle
vidnew wi vidold c1 rand1 ( pid xid ) c2 rand2 ( pgd xid )
swarm optimization concept consists of, at
each time step, changing the velocity of xidnew xidold vidnew
(accelerating) each particle toward its
Velocity can be limited to Vmax
pbest and lbest locations (local version of
PSO). Acceleration is weighted by a random Multilayer Feed-forward Neural
term, with separate random numbers being
Network:
generated for acceleration
towards pbest and lbest locations. The basic architecture consists of three
types of neuron layers: input, hidden, and
PSO Algorithm: output layers. In feed-forward networks,
the signal flow is from input to output units,
1. Initialize population in hyperspace
strictly in a feed-forward direction. The data
processing can extend over multiple (layers
2. Evaluate fitness of individual
of) units, but no feedback connections are
particles
present.
3. Modify velocities based on previous
best and global (or neighborhood)
best positionsavailable closing price for the stock was
used.
Here we use data for trading days only and
also we ignore the data for certain trading
days for which some of the element of the
data (like stock volume) is missing.
Model Analysis:
There are two main phase
i. Training phase
ii. Prediction phase or testing phase
Fig 1: An example of Multilayer Feed-forward
The first phase training phase also can be
Neural Network
divided into two parts, building ANN model
and weight updation phase.
We use only one hidden layer but the
number of nodes in the hidden layer will be Multilayer Feed-forward Neural Network
selected later during the time of training Model:
and testing. We’ll run the training and We have used Multilayer Feed-forward
testing for different number of nodes in Neural Network to model the stock price
hidden layer and choose the number that prediction problem. Here we are predicting
will give the best result. closing price of a stock on the next day.
Thus input variables that are considered to
Preprocessing:
affect the stock exchange market are
Before using the data for analyzing,
preprocessing of data is needed. The 1. Last-day opening Stock Price
problem arises when there is no trading 2. Last-day high Value of Stock Price
data or partial trading data corresponding 3. Last-day low Value of Stock Price
certain days. Heinkel and Kraus [6] stated 4. Last-day stock Volume
that there are three possible ways dealing 5. Last-day closing price
with days having no trading, viz. ignore the
days with no trading and use data for Thus input layer of our neural network
trading days, assign a zero value for the model consists of five input nodes.
days which have no trading, build a linear
model which can be used to estimate the The output layer consists of only one node
data value for the day with no trading. In that gives the predicted Closing Stock Price.
most of times, weekly closing price refers to
each Friday’s closing prices. In the event of We have used only one hidden layer and we
Friday being a holiday, the most recently have found the number of nodes in the
hidden layer after trying out 5-15 numbersof nodes, and the best result we have found rate of the month August ,i.e, from 01-08-
for the number of nodes in the hidden layer 2011 to 31-08-2011 and match it with the
equal to 10. closing data of that period.
We have used sigmoid function Error is calculated using the following
(f(x)=( ) as activation function. formula
)
Relative Absolute Error (%) =
Weight Updation using PSO: | |
× 100
Here we have used Particle Swarm
Optimization to update the weight of our The table given below is showing the
Neural Network model. percentage relative error in prediction for
that period
The optimal PSO parameters have been
determined by varying the inertia weight Date Actual Predicted Error(%)
( ), maximum velocity ( ), social and 8/1/2011 25.27 24.13 3.96
cognitive coefficient ( and ) and the 8/2/2011 26.80 26.68 0.00
swarm size and the values of the 8/3/2011 26.92 26.50 0.00
8/4/2011 25.94 26.60 0.00
parameters for which we have found the
8/5/2011 25.68 25.41 0.00
best result in our training set are as follows:
8/8/2011 24.48 24.79 0.00
Inertia weight=0.3 8/9/2011 25.58 24.20 3.91
8/10/2011 24.20 24.58 0.00
Maximum velocity=2.0 8/11/2011 25.19 24.69 0.00
8/12/2011 25.10 26.46 3.98
=0.15 8/15/2011 26.51 27.71 0.00
8/16/2011 27.35 27.83 0.00
=0.8
8/17/2011 27.25 27.87 0.00
Swarm size=100 8/18/2011 24.67 28.07 12.16
8/19/2011 24.05 25.85 4.16
8/22/2011 24.98 27.54 8.01
Data Set Used: 8/23/2011 25.72 28.71 7.78
8/24/2011 26.90 28.32 3.72
Historical Stock Price data (from 01.01.11 to 8/25/2011 27.57 28.75 0.00
31.08.11) of Microsoft Corporation (MSFT) 8/26/2011 27.25 28.38 0.00
collected from http://in.finance.yahoo.com 8/29/2011 26.84 27.21 0.00
8/30/2011 26.23 28.62 7.62
Result: 8/31/2011 26.60 27.49 0.00
Here we have used data from 01-01-2011 to Table 1: Predicting price, Actual price and Error (%)
29-07-2011(total 146 data) for training of MSFT using ANN and PSO
purpose and then predict the stock close8/11/2011 25.19 27.479 7.99
8/12/2011 25.10 27.479 7.97
8/15/2011 26.51 27.478 0.00
8/16/2011 27.35 27.478 0.00
8/17/2011 27.25 27.478 0.00
8/18/2011 24.67 27.478 8.11
8/19/2011 24.05 27.479 12.47
8/22/2011 24.98 27.479 8.01
8/23/2011 25.72 27.478 3.89
8/24/2011 26.90 27.478 3.72
8/25/2011 27.57 27.478 0.00
8/26/2011 27.25 27.478 0.00
8/29/2011 26.84 27.478 0.00
8/30/2011 26.23 27.478 3.81
8/31/2011 26.60 27.478 0.00
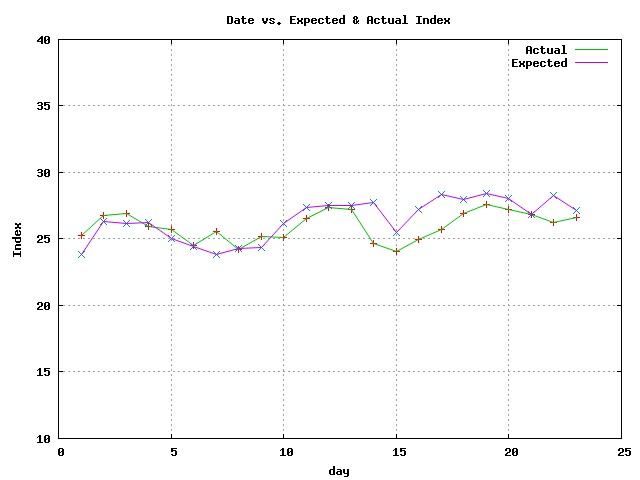
Fig 2: graphical representation of Predicting and
Table 1: Predicting price, Actual price and Error (%)
Actual price of MSFT using ANN and PSO
of MSFT using ANN with Back-propagation
Algorithm
Comparison with Existing Model:
The table 2 is showing the relative
percentage error and figure 3 is showing
the graphical representation of predicted
and actual stock price of ANN based stock
price prediction system where Back-
propagation algorithm is used in weight
updation of ANN model with the same
MSFT dataset that we have used:
Date Actual Predicted Error(%)
8/1/2011 25.27 27.479 7.91 Fig 3: graphical representation of Predicting and
8/2/2011 26.80 27.479 0.00 Actual price of MSFT using ANN with Back-
8/3/2011 26.92 27.479 0.00 propagation Algorithm
8/4/2011 25.94 27.479 3.86
8/5/2011 25.68 27.479 3.89
8/8/2011 24.48 27.479 8.17
8/9/2011 25.58 27.479 3.91
8/10/2011 24.20 27.479 12.39From this comparison we can say that: inputs of ANN. If instead of these inputs,
different economical measures like General
Relative error (%) of our proposed
Index, Net Asset Value, P/E ratio, Earning
model is far better than that of
per Share, Share Volume will be used as
back-propagation algorithm based
inputs to ANN as proposed in [3] ,then our
ANN model
approach of weight updation using PSO may
Back-propagation based ANN model give better result but for this different
cannot capture the variations of parameter values of PSO need to be tuned.
stock market, but our proposed PSO
based ANN model can capture the
variations of stock market in a
better way relative to back-
References:
propagation based ANN model [1] Kunwar Singh Vaisla, Ashutosh
Kumar Bhatt, “An Analysis of the
Performance of Artificial Neural
Observation: Network Technique for Stock
Market Forecasting” on (IJCSE)
1. The output of the model is highly International Journal on Computer
dependent on the different Science and Engineering Vol. 02, No.
parameters of PSO. 06, 2010, 2104-2109
2. If input changes highly, then [2] Olivier Coupelon, “Neural Network
prediction of our model is not near Modeling for Stock Movement
to the actual value, i.e., error during Preiction-A State of the Art”
sudden fall or sudden rise of index [3] Khan, Alin, Hussain, “Price
value is much more. Prediction of Share Market using
ANN” on International Journal of
Conclusion and Future Work:
Computer Applications (0975 –
As researchers and investors strive to out- 8887) Volume 22– No.2, May 2011
perform the market, the use of neural [4] Mohammad Mohatram,
networks to forecast stock market prices “Forecasting of Stock Exchange
will be a continuing area of research. Here Share Price using Feed Forward
we have used only 146 data for training Artificial Neural Network”
purpose. Our model may give far better
[5] Egeli, Ozturan, Badur, “Stock Market
result if more data will be used during
training. Prediction Using Artificial Neural
Here we have used Last-day opening Stock Networks”
Price, Last-day high Value of Stock Price, [6] R. Heinkel, A Kraus, “Measuring
Last-day low Value of Stock Price, Last-day Event Impacts in Thinly Traded
stock Volume, Last-day closing price asStocks”on Journal of Financial and
Quantitative Analysis, March 1988
[7] Ajith Abraham, “Artificial Neural
Networks”
http://www.softcomputing.net/ann
_chapter.pdf
[8] “Swarm Intelligence” by Kennedy,
Eberhart, and Shi, Morgan
Kaufmann division of Academic
Press, 2001
[9] “Comparison of Particle Swarm
Optimization and Back-propagation
as Training Algorithms for Neural
Networks” by Venu G. Gudise and
Ganesh K. Venayagamoorthy,
Senior- Member; /IEEE
[10] http://www.engr.iupui.edu/~
eberhart/web/PSObook.html
[11] http://www.swarmintelligen
ce.orgYou can also read