Quick guide to 7 major ranking reports - Elsevier
←
→
Page content transcription
If your browser does not render page correctly, please read the page content below
Quick guide to 7 major ranking reports

Quick guide to 7 major ranking reports

By understanding the inner workings of rankings,
universities gain insights into how their practices and
data can ultimately influence a rankings outcome. The
focus area, algorithms and methodologies vary across
the growing number of ranking tables and reports
produced by ranking organizations worldwide; as do
institutional priorities and research outputs.

     Quick guide to 7 major ranking reports               2
Quick guide to 7 major ranking reports
This quick reference table provides a look into 7 major and influential ranking reports. Use the information to quickly
compare and identify what each of the 7 reports focuses on, and what contributes to their methodologies.

Report: Shanghai Rankings                          Report: World University Rankings              Report: World University Rankings                  Report: Best University Rankings
Focus: Global                                      Focus: Global                                  Focus: Global                                      Focus: Global
Scope: 1800+ institutions are ranked               Scope: 1,500+ institutions                     Scope: 1,000 institutions                          Scope: 1,500 institutions across more
annually, top 1000 are published                   Timing: Annually (September)                   Timing: Annually (Spring)                          than 80 countries
Timing: Annually (August)                                                                                                                            Timing: Annually (October)

                      Report: Impact Rankings                             Report: WUR by Subject                              Report: CWTS Leiden Rankings
                      Focus: United Nations’ Sustainable                  Focus: Individual subject areas (48)                Focus: Research-intensive universities
                      Development Goals (SDGs)                            Scope: 1,000 institutions                           Scope: 1,000 institutions
                      Scope: 768 institutions (changes                    Timing: Annually (Spring)                           Timing: Annually (June)
                      annually)
                      Timing: April

          Quick guide to 7 major ranking reports                                                                                                                                             3
Ranking organization:
                                         Academic Ranking of World Universities (ARWU)

                                         Ranking report:
                                         Shanghai Rankings/ARWU

                                         Report focus:
                                         Global

                                         Stated goal:
                                         Provide a starting point for identifying national strengths and weaknesses as well as
                                         facilitating reform and setting new initiatives

                                         Scope:
                                         1800+ institutions are ranked annually, top 1000 are published in the report

                                         Data sources:
                                         Nobel Prize | Fields Medals (www.mathunion.org) | HiCi: Clarivate
                                         N&S: Web of Science | Bibliometrics: Web of Science
                                         Number of academic staff: National agencies such as National Ministry of Education,
                                         National Bureau of Statistics, National Association of Universities and Colleges, National
                                         Rector's Conference.

                                         Timing:
                                         Annually (August)

                                         Source: http://www.shanghairanking.com/ARWU-Methodology-2019.html
                                         Website accessed on: 19 May 2020
Quick guide to 7 major ranking reports                                                                                                4
The highest scoring institution is assigned a score 10% Per Capita Performance 10% Quality of Education
of 100, and other institutions are calculated as a
percentage of the top score. An institution's rank
reflects the number of institutions that sit above it.
• 10% Quality of Education: Alumni of an institution winning
Nobel Prizes and Fields Medals
• 20% Quality of Faculty: Staff of an institution winning
Nobel Prizes and Fields Medals
20% Research Output 20% Quality of Faculty
• 20% Quality of Faculty: Highly Cited Researchers (Citation indexes) (Nobel Prizes & Field Medals)
• 20% Research Output: Papers published in Nature and
Science*
• 20% Research Output: Papers indexed in Science Citation
Index-Expanded and Social Science Citation Index
• 10% Per Capita Performance: Per capita academic
performance of an institution
* For institutions specialized in humanities and social sciences
such as London School of Economics, N&S is not considered,
and the weight of N&S is relocated to other indicators.
20% Research Output 20% Quality of Faculty
(Nature and Science) (Highly Cited Researchers)
Quick guide to 7 major ranking reports 5Ranking organization:
Times Higher Education (THE)
Ranking report:
World University Rankings
Report focus:
Global
Stated goal:
• Evaluate research-intensive universities across all their core missions: teaching,
research, knowledge transfer and international outlook.
• Provide trusted performance data on universities for students and their families,
university academics, university leaders, governments and industry
Scope:
1,500+ institutions
Data sources:
Academic Reputation Survey | Elsevier's Scopus database (data cut-off date = May 1st )
Timing:
Annually (September)
Source: https://www.timeshighereducation.com/world-university-rankings/world-university-rankings-2021-methodology
Quick guide to 7 major ranking reports Website accessed on: 19 May 2020 6THE uses 13 performance indicators to position
more than 1,500+ institutions worldwide. These
performance indicators are grouped into five areas
(as shown to the right).
30% Teaching (the learning environment):
• 15.0% Reputation survey
• 4.50% Staff-to-student ratio
• 2.25% Doctorate-to-bachelor’s ratio
• 6.00% Doctorates-awarded-to-academic-staff ratio
• 2.25% Institutional income
30% Research (volume, income and reputation):
• 18% Reputation survey
• 6.0% Research income
• 6.0% Research productivity
30% Citations (research influence)
7.5% International outlook (staff, students and research)
• 2.5% Proportion of international students
• 2.5% Proportion of international staff
• 2.5% International collaboration
2.5% Industry income (knowledge transfer)
Quick guide to 7 major ranking reports 7Ranking organization:
QS
Ranking report:
QS World University Rankings
Report focus:
Global
Stated goal:
For students seeking to understand how their prospective university
choices are perceived by the global academic community, and by potential
employers across the world.
Scope:
1,000 institutions
Data sources:
Elsevier's Scopus database
Timing:
Annually (Spring)
Source: https://www.topuniversities.com/qs-world-university-rankings/methodology
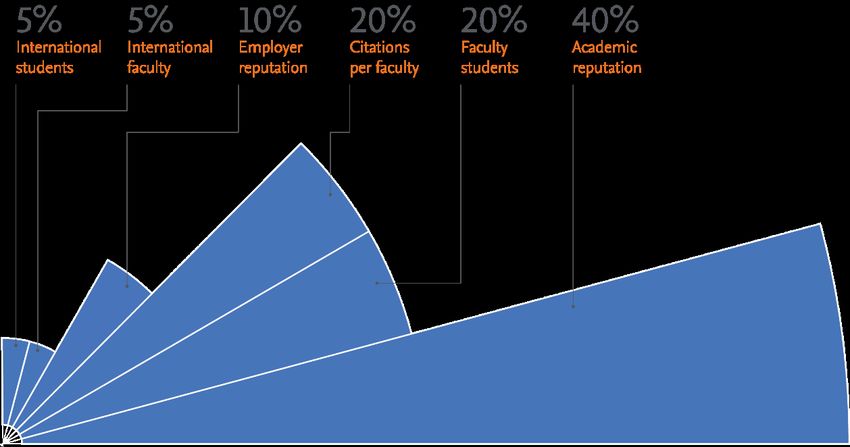
Quick guide to 7 major ranking reports Website accessed on: 19 May 2020 8QS uses a consistent methodological framework, compiled
from six simple metrics to capture university performance.
Faculty area normalization was introduced in 2015 to ensure
that institutions specializing in Life Sciences and Natural
Sciences were not unduly advantaged, QS has avoided
fundamental changes, with the aim to provide a consistent
year-on-year comparison.
QS World University Rankings evaluates universities
according to six metrics:
• 5% International student ratio
• 5% International faculty ratio
• 20% Citations per faculty, sourced from Scopus
• 20% Faculty/student ratio
• 10% Employer reputation
• 40% Academic reputation
Quick guide to 7 major ranking reports 9Ranking organization:
US News &World Report
Ranking report:
Best University Rankings
Report focus:
Global
Stated goal:
For potential students: used to explore higher education options beyond their own countries'
borders and to compare key aspects of schools' research missions.
For universities: provide a way to benchmark themselves against other schools, become
more visible globally, and find top schools in other countries to collaborate with.
Scope:
1,500 institutions across more than 80 countries
Data sources:
Bibliometric data and indicators: Web of Science and InCites
Reputation Indicators: Clarivate Analytic’ Academic Reputation Survey
Timing:
Annually (October)
Source: https://www.usnews.com/education/best-global-universities/articles/methodology
Quick guide to 7 major ranking reports Website accessed on: 19 May 2020 10% of total publications among top
1% most highly cited
# of highly cited papers among Global research reputation
The rankings focus specifically on schools' academic top 1% most cited in field
research and reputation overall and not on their
5% 12.5%
separate undergraduate or graduate programs. International collaboration 5%
To arrive at a school's rank, the overall global scores Regional research
5%
are calculated using a combination of the weights and reputation
International
z-scores for each of the 13 indicators used in the
collaboration – 5%
rankings. relative to country 12.5%
• 12.5% Global research reputation
• 12.5% Regional research reputation
• 10% Publications % of total
publications 10%
• 2.5% Books
among the 10%
• 2.5% Conferences
most cited
• 10% Normalized citation impact 10% Publications
• 7.5% Total citations 11
• 12.5% Number of publications among the 10% most cited
• 10% Percentage of total publications among the 10% most cited 12.5% 2.5%
• 5% International collaboration # of total
publications 2.5% Books
• 5% International collaboration - relative to country
among the 10%
• 5% Number of highly cited papers among the top 1% most cited 7.5% 10%
in their respective field most cited Conferences
• 5% Percentage of total publications among the top 1% most
highly cited papers
Normalized
Total citations
citation impact
Quick guide to 7 major ranking reportsRanking organization:
Times Higher Education (THE)
Ranking report:
Impact Rankings
Report focus:
United Nations’ Sustainable Development Goals (SDGs)
Stated goal:
To provide a showcase for the work being delivered by universities in our communities,
and an opportunity to shine a light on institutional activities and efforts not covered in other
rankings and demonstrate the differences a university is making to the world we live in.
Scope:
768 institutions (changes annually)
Data sources:
• Universities can submit data on as many of the 17 SDGs as they are able
• Elsevier's Scopus database
Timing:
Annually (April)
Source: https://www.timeshighereducation.com/university-impact-rankings-2020-methodology
Quick guide to 7 major ranking reports Website accessed on: 19 May 2020 12The SDGs included:
How universities are ranked
THE uses indicators to provide comparisons across three broad areas: research, outreach,
and stewardship, across all of the SDGs.
Any university that provides data on SDG 17 and at least three other SDGs is included in
the overall ranking.
The methodology was developed in conjunction with THE’s partners Vertigo Ventures and
Elsevier, and after consultation and input from individual universities, academics, and
sector groups.
Universities can submit data on as many of the SDGs as they are able. Each SDG has a
series of metrics that are used to evaluate the performance of the university in that SDG.
As well as the overall ranking, THE also publishes the results of each individual SDG. This
rewards any university that has participated with a ranking position, even if they are not
eligible to be in the overall table.
Methodology
A university’s final score in the overall table is calculated by combining its score in SDG 17
with its top three scores out of the remaining 16 SDGs. SDG 17 accounts for 22% of the
overall score, while the other SDGs each carry a weight of 26%. This means that different
universities are scored based on a different set of SDGs, depending on their focus.
The score from each SDG is scaled so that the highest score in each SDG in the overall
calculation is 100. This is to adjust for minor differences in the scoring range in each SDG
and to ensure that universities are treated equitably whichever SDGs they have provided
data for. It is these scaled scores that we use to determine which SDGs a university has
performed most strongly in; they may not be the SDGs in which the university is ranked
highest or has scored highest based on unscaled scores
Quick guide to 7 major ranking reports 13Ranking organization:
QS
Ranking report:
QS World University Rankings by Subject
Report focus:
Individual subject areas (48 subject areas)
Stated goal:
Help prospective students identify the world’s leading schools in their chosen field in
response to high demand for subject-level comparisons.
Scope:
1,000 institutions
Data sources:
International Reputation
• QS global survey of academics
• QS global survey of employers
Research impact from Elsevier's Scopus database
• Research citations per paper
• h-index in relevant subject
Timing:
Annually (Spring)
Source: https://www.topuniversities.com/qs-world-university-rankings/methodology
Quick guide to 7 major ranking reports Website accessed on: 19 May 2020 14Four components are combined to produce the results for
each of the subject rankings, with weightings adapted for
each discipline:
• Academic reputation
• Employer reputation Arts & Humanities Engineering & Technology Life Science & Medicine
• Research citations per paper
• h-index
As research cultures and publication rates vary significantly
across academic disciplines, the QS World University
Rankings by Subject applies a different weighting of the four
indicators in each subject.
For example, in medicine, where publication rates are very
high, research citations and the h-index account for 25% of Natural Sciences Social Sciences & Medicine
each university’s total score. On the other hand, in areas with
much lower publication rates such as history, these research-
related indicators only account for 15% of the total ranking
score. Meanwhile, in subjects such as art and design, where
there are too few papers published to be statistically
significant, the ranking is based solely on the employer and
academic surveys.
Quick guide to 7 major ranking reports 15Ranking organization:
CWTS
Ranking report:
CWTS Leiden Ranking
Report focus:
Research-intensive universities
Stated goal:
The Leiden Ranking stands for a multidimensional perspective on university
performance.
Scope:
1,000 institutions
Data sources:
Web of Science data from the Science Citation Index Expanded, the Social Sciences
Citation Index, and the Arts & Humanities Citation Index, which is then enriched by
CWTS. Excludes conference proceeding publications and book publications
Timing:
Annually (June)
Source: https://www.leidenranking.com/
https://www.leidenranking.com/information/indicators
https://www.leidenranking.com/information/universities
Quick guide to 7 major ranking reports 16
Website accessed on: 19 May 2020Publications Gender indicators
The Leiden Ranking provides information exclusively about the
research done at universities. They offer important insights into
the scientific performance of nearly 1000 major universities
worldwide. Research is represented in publications, and the
collected data about these publications forms the basis for the
Leiden Ranking. A set of bibliometric indicators are used to
provide statistics on scientific impact, collaboration, open access
Size-dependent vs. size- Counting method
publishing, and gender diversity. independent indicators
Identification of universities: Typically, a university is
characterized by a combination of education and research tasks
in conjunction with a doctorate-granting authority. However,
these characteristics do not mean that universities are
particularly homogeneous entities that allow for international
Trend analysis
comparison on every aspect. As a result of its focus on scientific Scientific impact indicators
research, the Leiden Ranking presents a list of institutions that
have a high degree of research intensity in common.
These indicators include:
• Publications Stability intervals
• Size-dependent vs. size-independent indicators Collaboration indicators
• Scientific impact indicators
• Collaboration indicators
• Open access indicators
• Gender indicators
• Counting method Open access indicators
• Trend analysis
• Stability intervals
Quick guide to 7 major ranking reports 17Thank you
You can also read