Inversion and Analysis of Land Surface Temperature based on Landsat - a case study of BeiBei District in Chongqing
←
→
Page content transcription
If your browser does not render page correctly, please read the page content below
E3S Web of Conferences 165, 03006 (2020)                                                      https://doi.org/10.1051/e3sconf/202016503006
CAES 2020

    Inversion and Analysis of Land Surface Temperature based on
    Landsat - a case study of BeiBei District in Chongqing
    Zhou Yang 1, Liu Na-na 1*
    1   Chongqing Real Estate College,Chongqing 401331, China

                  Abstract: Land surface temperature is the surface of the earth's energy change and the exchange process,
                  which is an important index for a lot of scientific research. In this paper, the surface temperature changes of
                  BeiBei district in Chongqing in the past 20 years were inverted in 6 time phases. The surface temperature
                  inversion method of Landsat remote sensing data was studied, and the atmospheric correction method was
                  adopted to conduct the inversion by using Landsat5TM and landsat8OLI-TIRS image data. The results
                  showed that from 2004 to 2014, the area of high temperature area increased year by year, and the area of
                  low temperature area also increased year by year.

  1Introduction                                                          BeiBei district is composed of the low mountain trough,
                                                                         the foothill naked hill, the shallow hill and the river
  Land surface temperature is the surface of the earth's                 valley. Within its scope the highest elevation is 1312m,
  energy change and the exchange process, it is the                      the lowest elevation is 175m, so in the area of BeiBei
  interaction between land and atmosphere comprehensive                  mountains and hills are more, flat dam is less, but the
  performance of energy conversion, which is a very                      water system is very rich.The whole region is a natural
  important parameter on the study of regional and global                feature of "six hills, three mountains and one dam".
  scales on the surface of a physical system, and which is               Beibei district has the jurisdiction over Tiansheng Street,
  also an important index for many scientific research [1-3].            Chaoyang Street, Beiwenquan Street, Longfengqiao
  With the continuous development of remote sensing                      Street, Dongyang Street, Xiema Town, Jindaoxia Town,
  technology, the using of thermal infrared remote sensing               Sansheng Town, Shijialiang Town, Tongjiaxi Town,
  data inversion of surface temperature becomes one of the               Caijiagang Town, Liuyin Town, Chengjiang Town,
  most commonly used methods at present.                                 Jingguan Town, Fuxing Town, Shuitu Town, and Tianfu
      Taking BeiBei district of Chongqing as the research                Town, and it has a permanent population of more than
  object, this paper used Landsat remote sensing image to                800,000.
  invert the surface temperature of six phases from 2001 to
  2017 and analyze them.
                                                                         2.2 The data source

  2 Research area overview and data                                      This research uses the image data of Landsat5TM and
                                                                         Landsat8OLI-TITS, and the ranks number of Beibei
  source                                                                 district is 137/039 and 137/040. In order to better study
                                                                         the changes of surface temperature in BeiBei district
  2.1 Research area overview                                             over the past 20 years, according to the available images
                                                                         and the purpose of obtaining accurate inversion data, we
  Beibei district of Chongqing is located in east longitude              try to select the image data with less cloud cover, good
  106°18'14" to 106°56'53", latitude 29°30'41" to                        imaging quality and in the summer after analyzing all the
  30°11'21", covering an area of 754.21km2. Beibei district              image data, and finally we chose the images of six time
  has a humid subtropical monsoon climate with abundant                  phase years of 2001-2017, respectively in 2001, 2004,
  rainfall, characterized by early spring, hot summer, short             2007, 2011, 2014 and 2017. Their imaging time is from
  autumn and late winter. The highest temperature is                     May to September, because during this time, the
  44.3℃. The minimum temperature is                                      temperature is higher.
  -3.1℃, and the annual average temperature is 18.2℃.
  Beibei district is a part of southwest col fold belt,
  Huaying mountain geji-block compound anticline arc                     3 Land surface temperature inversion
  structure area Chongqing arc. The basic topography of
    *
        Corresponding author: 545195968@qq.com
© The Authors, published by EDP Sciences. This is an open access article distributed under the terms of the Creative Commons Attribution
License 4.0 (http://creativecommons.org/licenses/by/4.0/).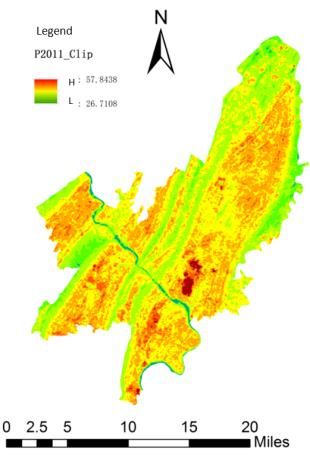
E3S Web of Conferences 165, 03006 (2020) https://doi.org/10.1051/e3sconf/202016503006
CAES 2020
There are three methods of surface temperature inversion Sobrino was used to calculate the surface specific
using remote sensing images:atmospheric correction emissivity.
method (radiation transmission), split window algorithm, The formula is as follows:
and multi-channel algorithm. Among them, atmospheric
correction method is suitable for data sources of Landsat ε=0.004Pv+0.986 (1)
and TM/ETM+/TIRS series satellites. Combined with In this formula:
the image data selected in this study, surface temperature Pv—the vegetation coverage, which is calculated by
inversion using atmospheric correction method is the following formula:
adopted [4-6].
Pv = [(NDVI- NDVISoil)/(NDVIVeg - NDVISoil)] (2)
3.1 TIRS inversion flow chart based on In this formula:
atmospheric correction method NDVI—the normalized vegetation index;
NDVISoil—the NDVI value of the completely bare
The thermal infrared radiation luminance value L λ soil or non-vegetation covered area;
received by the satellite sensor consists of three parts: NDVIVeg—The NDVI value of the pixel completely
atmospheric upward luminance L↑, the energy of the covered by vegetation, namely, the NDVI value of the
ground's true luminance reaching the satellite sensor pure vegetation pixel.
after passing through the atmosphere; the atmosphere According to the empirical value NDVIVeg = 0.70
radiates downward to reflect energy as it reaches the and NDVISoil= 0.05, that is, when the NDVI of a certain
ground. pixel is greater than 0.70, the value of Pv is 1, when
According to the calculation formula of land surface NDVI is less than 0.05, Pv is 0.
temperature, this algorithm requires two parameters: According to the formula, the vegetation coverage
atmospheric profile parameters and surface specific image was calculated. Then calculate the surface specific
emissivity. The processing flow is shown in the emissivity.
following figure1.
3.3 calculation of blackbody radiation
brightness and surface temperature
According to the official website of National
Aeronautics and Space Administration(NASA) (http://
atmcorr.gsfc.nasa.gov), inputting the shadow time,
center latitude and longitude, and the other
corresponding parameters, we can obtain the
corresponding parameters: the atmospheric thermal
infrared transmittance τ, atmospheric radiation
brightness upward L ↑ and atmospheric radiation
brightness downward L↓.
Then, according to the formula, the black body
luminance image at the same temperature can be
calculated, and then the surface temperature image with
unit of Celsius can be further calculated.
4 Land surface temperature inversion in
BeiBei district of Chongqing
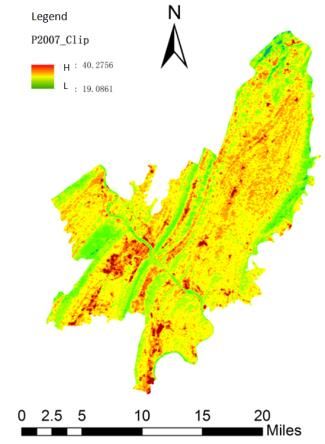
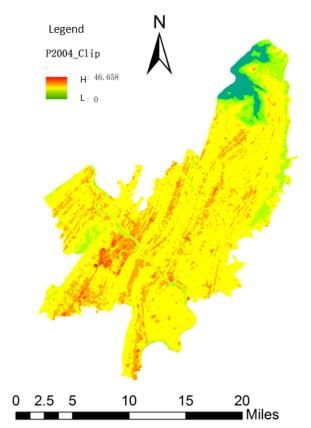
4.1 Inversion results
Fig. 1 TIRS inversion flow chart based on atmospheric
correction method The inversion results of surface temperature based on the
above surface temperature inversion method are shown
in the following figure2:
3.2 Calculation of surface specific emissivity
Specific emissivity is the specific performance of an
object's ability to emit electromagnetic waves to the
outside world. It is related to the composition, condition
and physical properties of surface features.
In this study, the calculation method of surface
specific emissivity is the same as that of TM/ETM+6
images. The NDVI threshold method proposed by
2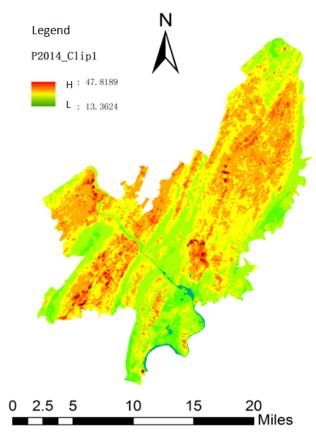
E3S Web of Conferences 165, 03006 (2020)                                                     https://doi.org/10.1051/e3sconf/202016503006
CAES 2020

                                                                          2007.09.20      40.28         19.09        25.74           1.46

                                                                          2011.08.30      57.84         26.71        38.37           3.78

                                                                          2014.08.06      47.82         13.36        32.74           3.32

                                                                          2017.05.26      63.32         13.80        38.72           3.29

                                                                         4.2 result analysis
                                                                         In order to more clearly analyze the distribution law of
                                                                         surface temperature in the research area, we used the
                                                                         Robust Statistical method[7] to classify the temperature
                                                                         image, and the formula for calculating the temperature
                                                                         segmentation threshold is as follows:
                                                                                         T = A ± x × sd                                (3)
                                                                             In this formula:
                                                                             T—the calculated temperature threshold;
                                                                             A—the average surface temperature;
                                                                             x—a multiple of the variance(Values for 0.5,1,1.5);
                                                                             sd— the variance of surface temperature
                                                                             The temperature threshold calculated according to
                                                                         the formula can be divided into 7 grades such as super
                                                                         high temperature, sub-high temperature and super low
                                                                         temperature (see table 2). According to the grades in
                                                                         table 2, the temperature grade diagram can be obtained.
                                                                                    Table 2 classification of surface temperature
                                                                         Temperature
                                                                                            t≤-1.5sd       -1.5sd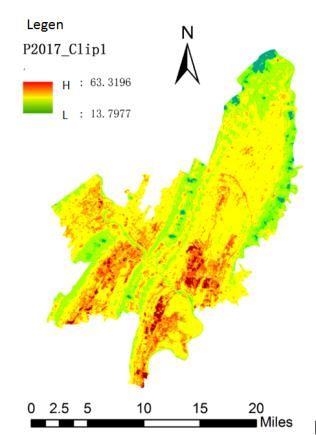
E3S Web of Conferences 165, 03006 (2020)                                            https://doi.org/10.1051/e3sconf/202016503006
CAES 2020

        2014   284327         282521           270237              5. Zeng Y, Huang W, Zhan F B, et al. Study
                                                                      on the urban heat island effects and its
        2017   183314         446831           207940
                                                                      relationship with surface biophysical
                                                                      characteristics using MODIS imageries[J].
   5 Conclusion                                                       Geo-spatial Information Science, 2010,
                                                                      13(1):1-7.
   This paper describes the inversion of land surface
   temperature and adopts the atmospheric correction               6. Becker, F. The impact of spectral
   method based on the remote sensing data of landsat.                emissivity on the measurement of land
   Used Landsat5TM and image data Landsat8OLI-TITS.                   surface temperature from a satellite[J].
   We choose six phases image data during nearly 20 years             International Journal of Remote Sensing,
   of BeiBei district in Chongqing. The results showed that
   from 2004 to 2014, the area of high temperature area
                                                                      1987, 8(10):1509-1522.
   increased year by year, and the area of low temperature         7.   Lin J., Chen S.L. ,Surface temperature inversion and
   area also increased year by year, the influencing factors            thermal environment analysis of xiamen island
   of these changes may be closely related to urbanization              based on remote sensing [J]. Journal of fujian
   construction, population growth and urban greening and               normal university (natural science edition), 2013,29
   so on.                                                               (02) : 75-80.

   Acknowledgements
   I’d like to thank Chongqing education commission for
   approving my research project "Image research of
   urbanization on surface humid and thermal environment-
   -a case study of Chongqing's nine districts", and I would
   also like to thank Chongqing Real Estate College for
   providing research fund support for this project, and the
   last thanks to the efforts of the team members, we
   believe that our project will get very good results.
   Project source: Science and technology research plan of
   Chongqing education commission in 2018 youth project
   “Image research on the land surface temperature and
   humidity environment of urbanization -- a case study of
   the ninth district of Chongqing” (Project no. :
   KJQN201805204)

   Reference:
   1.    Chen Y.Y., Duan S.B., Ren H.Z., et al. Algorithm
         development for land surface temperature
         retrieval:Application to Chinese Gaofen-5 data.
         Remote Sensing, 2017, 9: 161.
   2.    Fan X.W., Tang B.H., Wu H., et al. A three-channel
         algorithm for retrieving night-time land surface
         temperature from MODIS data under thin cirrus
         clouds.    International    Journal  of    Remote
         Sensing,2015, 36: 4836-4863.
   3.    Anderson M C, Norman J M, Kustas W P, Houborg
         R, Starks P J and Agam N. 2008. A thermal-based
         remote sensing technique for routine mapping of
         land-surface carbon, water and energy fluxes from
         field to regional scales. Remote Sensing of
         Environment,       112(12):    4227–4241     [DOI:
         10.1016/j.rse.2008.07.009].
   4.    Bredehoeft J D, Papadopulos I S. Rates of
         vertical ground-water movement estimated
         from the Earth’s thermal profile [J]. Water
         Resources Research, 1965, (2): 325-328.

                                                               4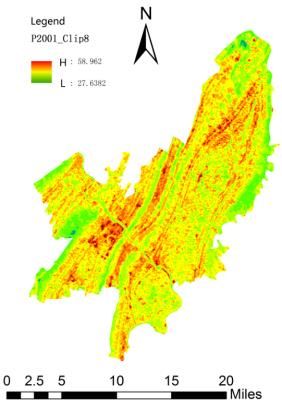
You can also read