Discussion note Are we in a -shaped or a W-shaped recession?
←
→
Page content transcription
If your browser does not render page correctly, please read the page content below
Discussion note

Are we in a √-shaped or a W-shaped recession?
We apply a new factor model for the estimation of recession probabilities in the euro area and
Slovakia. The model is based on standard monthly indicators of real activity. In the case of
Slovakia, we also use timely available data on the value of client transactions in the payment
system SIPS, which is run by the NBS. The results for the euro area and Slovakia suggest that
the probability of a technical recession with a drop of GDP in two consecutive quarters is
negligible. In other words, the quarterly growth profile of GDP during the corona crisis will look
more like a square root symbol (√) and a W shape is unlikely based on the latest data.

Warning: The results of this note do not represent the official forecast of the NBS.

The new model for estimating recession probabilities1 is based on monthly indicators,
which allows us to evaluate information that becomes available gradually. Timely
information is crucial for estimating current quarter GDP before the official figures are
published. The multivariate setup is consistent with classical definitions of the business cycle,
which state that turning points between phases of the cycle should be observed in several
macroeconomic variables simultaneously.2 The carefully selected indicators focus on real
activity, which allows the model to identify recessions of different origins without
conditioning them on specific shocks, e. g. shocks originating from the financial sector.

The time-varying depth of recession in this model allows recessions of flexible shapes
following the set of indicators included. As a further advantage, the model is compatible with
alternative definitions of recessions, which are comparable across countries, such as i) a
period of low growth below potential, ii) a drop of GDP in one quarter, or iii) a technical
recession with a decrease in GDP in two consecutive quarters. In the present discussion note,
we will use the latter definition for simplicity.

1 The topic of estimating recession probabilities relates to our Discussion note No. 46 from 2017, where we applied
the basic univariate Markov switching model of GDP without additional indicators.
2 See Burns and Mitchell (1946) and the related stream of literature.

Discussion notes are not the official viewpoints of the National Bank of Slovakia. They present the views of Analysts
of the Monetary, Statistics and Research Departments, respectively. © UMS analysts

 Are we in a √-shaped or a W-shaped recession? | Discussion note No. 98 | January 21, 2021 | © UMS analysts 1
A Markov Switching Dynamic Factor Model

We estimate a Markov switching dynamic factor model (MS-DFM). The model was developed
in a working group of the European System of Central Banks and is described in Leiva-Leon et
al. (2020)3 in more detail. The parameters and unobserved components are estimated using
Bayesian methods (Monte Carlo Markov Chain simulations), which allows depiction of the
parametric uncertainty around estimated variables and forecasts using a fan chart.

The MS-DFM is composed of a system of five main equations, including the monthly growth
rates of unobserved GDP and four real activity indicators. The movement of the variables is
explained by an unobserved common factor and indicator-specific error terms. The common
factor has a constant mean in the regime of expansion. Whereas in the recession regime the
mean of the factor is the sum of a constant and a flexible component (depth of recession), where
the latter follows a random walk process. The quarterly growth of GDP is assumed to be
observable only in the third month of each quarter, when data for all three months of the
particular quarter are available. Quarterly GDP growth can be approximated by the weighted
average of five consecutive monthly growth rates that are unobserved and are linked to the
common factor.4 For a more detailed description of the model’s equations see the Technical
appendix.

Data

Similarly to Leiva-Leon et al. (2020), we included the following monthly indicators of the euro
area: industrial production, the value of exports of goods traded within the euro area, the value
of exports of goods traded outside the euro area, and new orders in manufacturing. The selected
variables concentrate on the activity of global value chains in industry, which are the largest
players in European trade and influence the euro area business cycle to a great extent.5 At the
time of preparing this note, the indicators mentioned were available up to November 2020.

In the model for Slovakia, we included the monthly value of exports of goods, industrial
production index and the economic sentiment indicator (ESI),6 which are standard indicators

3 The authors implemented the model element of time-varying depth of recessions introduced by Eo
and Kim (2016) in the Markov switching dynamic factor model of Camacho et al. (2018). We are grateful for Leiva-
Leon et al. (2020) for sharing their program codes. For a more detailed treatment of the structure of the model see
the Technical appendix of this note.
4 It is a standard approximation introduced by Mariano a Murasawa (2003). Intuitively, in order to describe the

developments of a monthly variable between two quarters, we need data for six months or five monthly
differences. For more details on the derivation of this approximation see the Technical appendix of this note.
5 The availability of appropriate monthly indicators for the euro area as a whole is somewhat limited, as new data

are published with a longer lag and time series tend to be shorter compared to data for particular member
countries. We could have considered ESI or retail sales, for example, as alternatives to new orders in
manufacturing.
6 The index is composed of confidence indicators in industry, construction, retail trade, services and of consumers.

 2

 Are we in a √-shaped or a W-shaped recession? | Discussion note No. 98 | January 21, 2021| © UMS analysts
of real activity.7 The fourth monthly variable we used is the value of client transactions in the
retail payment system SIPS, which is run by the National Bank of Slovakia. This variable has
been neglected in similar analyses so far, but has proved useful. Our selection of indicators
reflects the openness of the Slovak economy to the rest of the world (exports and industrial
production). The selection also takes domestic demand into account via i) client payments
between individuals and firms and ii) a set of soft indicators from several sectors of the
economy (ESI). Client payments and ESI have a further advantage from the early release of new
data right at the end of each month. We used the latter two series up to December 2020 in the
present analysis, while industrial production and exports were available up to November of the
same year.

Results

According to the model, the probability of recession with a drop of GDP in two consecutive
quarters at the recent turn of the year is negligible (Figure 1). The short-term forecast is
positive for the euro area and it shows a mild slowdown in the case of Slovakia (Figure 2). In
other words, a W-shaped recession is unlikely at the moment and the quarterly growth profile
of GDP is more similar to a square root symbol (√). Sluggish dynamics of the Slovak economy
(GDP levels are shown in Figure 5 in the appendix) can also be observed in monthly indicators
at the end of last year (the right-hand panel of Figure 4 in the appendix). The model evaluated
these developments as an elevated probability of the monthly recession regime (about 40% in
December, the right-hand panel of Figure 3 in the appendix). This implies a potential risk of a
mild drop in GDP in the final quarter of 2020.

Figure 1 Probability of a decrease in GDP in two consecutive quarters
Euro area Slovakia

Note: Left axis – for grey bars, seas. adj. growth rates of GDP in % q/q, right axis – for blue lines, probability of a
decrease in GDP in two consecutive quarters.

7See for example Leiva-Leon et al. (2020), where an index of production, exports and a soft indicator are the most
common variables included in their models for twelve countries.

 2

 Are we in a √-shaped or a W-shaped recession? | Discussion note No. 98 | January 21, 2021| © UMS analysts
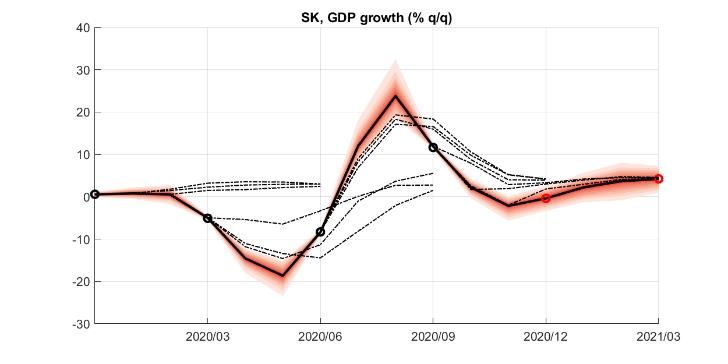
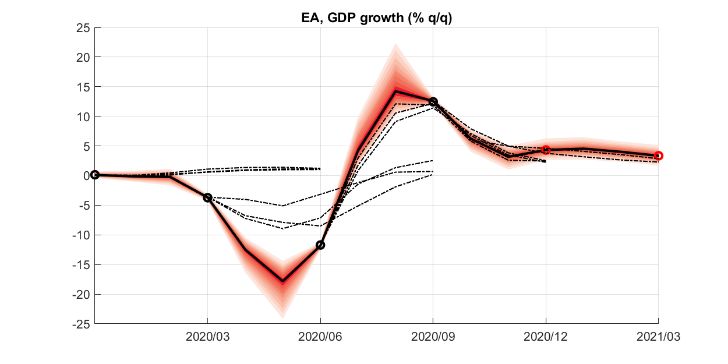
Figure 2 Monthly updates of the GDP forecast for 1.Q 2020 ⎯ 1.Q 2021.
Euro area Slovakia

Notes: black circles – observed GDP growth q/q in third months of each quarter, red circles – latest model forecast
of GDP for 4.Q 2020 and 1.Q 2021 retrieved in mid-January 2021 (not the official forecast of the NBS), black
line – monthly estimate of GDP growth, red fan chart – Bayesian parametric uncertainty around the monthly
estimate, black dashed lines – previous monthly versions of the forecast.

Apart from the latest forecast in Figure 2, we also depicted simulations of its earlier versions
based on past data in monthly sequences (dashed lines). The simulations show that the gradual
release of new data led to correct adjustments in the forecasts towards future GDP outcomes.
Our exercise confirmed the usefulness of timely data that signal turning points in the
performance of the economy, together with models adapted to the analysis of such data, for
GDP forecasting purposes especially in non-standard times, such as the ongoing corona crisis.

Peter Tóth
analytici@nbs.sk

References
Bry, G. and Ch. Broschan (1971): “Cyclical Analysis of Time Series: Selected Procedures and
 Computer Programs”, New York, NBER.
Burns, A. F., and W. C. Mitchell (1946): “Measuring Business Cycles”, New York: Columbia Univ.
 Press, 1946.
Camacho, M., Pérez-Quirós, G. and P. Poncela (2018): "Markov-switching dynamic factor
 models in real time", International Journal of Forecasting 34(4), p. 598-611.
Eo, Y. and C. J. Kim (2016): “Markov-Switching Models with Evolving Regime-Specific
 Parameters: Are Post-war Booms or Recessions All Alike?”, Review of Economics and
 Statistics, 98(5), December 2016, p.940-949.
Leiva‐Leon, D., G. Pérez-Quirós and E. Rots (2020), “Real-Time Weakness of the Global
 Economy: A First Assessment of the Coronavirus Crisis. ECB Working Paper No. 2381.
Mariano, R. S. and Y. Murasawa (2003): “A new coincident index of business cycles based on
 monthly and quarterly series”, Journal of Applied Econometrics 18 (4), p. 427-443.
 2

 Are we in a √-shaped or a W-shaped recession? | Discussion note No. 98 | January 21, 2021| © UMS analysts
Appendix – additional figures
Figure 3 The probability of the monthly recession regime
Euro area Slovakia

Notes: Left axis – for grey bars of seas. adj. GDP growth q/q in %, right axis – for blue lines of the probability of the
monthly recession regime.

Figure 4 Indicators of real activity
Euro area Slovakia

Notes: Seas. adj. monthly growth rates in %. IPP – industrial production index, ESI – economic sentiment indicator
(monthly changes in the index), SIPS – the value of client payments in the payment system SIPS.

Figure 5 Levels of real GDP
Euro area (tril. eur) Slovakia (bil. eur)
3,0 23
2,8 22
 21
2,6
 20
2,4 19
2,2 18
2,0 17
 2017Q3
 2017Q1

 2018Q1

 2018Q3

 2019Q1

 2019Q3

 2020Q1

 2020Q3

 2020Q1
 2017Q1

 2017Q3

 2018Q1

 2018Q3

 2019Q1

 2019Q3

 2020Q1

 2020Q3

 2020Q1

 history model forecast history model forecast
 NBS forecast P4Q

Notes: GDP chain-linked volumes, seas. adj.

 2

 Are we in a √-shaped or a W-shaped recession? | Discussion note No. 98 | January 21, 2021| © UMS analysts
Technical appendix
The MS-DFM is defined on monthly frequency as:

 1, 1, 1,
 2, = 2, + 2, (1)
 3, 3, 3,
( 4, ) ( 4, ) ( 4, )

where is the unobserved monthly growth rate of GDP,

 1, , … , 4, are monthly growth rates of real activity indicators,

and is the common factor of GDP and the indicators.

The error terms in (1) follow an AR(2) process:

 , = ,1 , −1 + ,2 , −2 + , (2)

The common factor has a constant mean of 0 in regime = 1 (expansion), while the mean
in regime = 0 (recession) is composed of a constant 1 and a flexible component . The
latter component sets the depth of recession.

 = 0 (1 − ) + 1 + + (3)

 ~ (0, 2 )
 2
 , ~ (0, , )

The flexible component follows a random walk process:

 = −1 + (1 − ) (4)

 ~ (0, 2 )

The expansion and recession regimes move according to a Markov process:

 ( = / −1= , Ω −1 ) = , (5)

The quarterly growth rate of GDP is defined using the approximation of Mariano and
Murasawa (2003) as the weighted average of five consecutive monthly growth rates:
 1 2 2 1
 = 3 + 3 −1 + −2 + 3 −3 + 3 −4 (6)

The approximation in (6) is derived using the formula for the geometric mean. We assume that
the value of an indicator for a quarter is the geometric mean of three months. The quarterly
growth rate is expressed as the difference in logarithms in consecutive geometric means. By
 2

 Are we in a √-shaped or a W-shaped recession? | Discussion note No. 98 | January 21, 2021| © UMS analysts
adding and subtracting the necessary terms we get equation (6), including the weights of each
monthly difference of logarithms − (k=0,..,4).

Plugging expression (6) to the first row of the system in (1), we can rewrite the row to the
quarterly frequency:
 1 2 2 1 1 2 2 1
 = 3 + 3 −1 + −2 + 3 −3 + 3 −4 + 3 + 3 −1 + −2 + + 3 −3 + 3 −4 (7)

where the quarterly growth rate of GDP, , is observed only in the third month of each quarter.

 2

 Are we in a √-shaped or a W-shaped recession? | Discussion note No. 98 | January 21, 2021| © UMS analysts
You can also read