The U.S. Offshore Opportunity - Ready for take-off Ethan Zindler October 22, 2019 - Offshore Wind Advisory

Page created by Tony Nelson
 
CONTINUE READING
The U.S. Offshore Opportunity - Ready for take-off Ethan Zindler October 22, 2019 - Offshore Wind Advisory
The U.S. Offshore
Opportunity
Ready for take-off

Ethan Zindler

October 22, 2019
Contents

Global outlook         2
The U.S.               7

1   October 22, 2019
Global outlook
A rapidly diversifying market

2   October 22, 2019
Global outlook

2019: a blockbuster for new build
Global offshore wind build
                                      Annual installations (GW)                                                                                                        China
                                                                                                                                      19.0

                                                                                                                                                                       U.K.
                                                                                                                                             17.2 17.3
                                                                                                                                                                16.8
                                                                                                                                                                       Germany
                                                                                                                               15.4
                                                                                                                                                         15.0          U.S.
                                                                                                                                                                       Netherlands
                                                                                                                                                                       Taiwan

                                                                                                                  10.1
                                                                                                                                                                       Japan
                                                                                                      9.7
                                                                                          9.2               9.2          9.4
                                                                                                                                                                       France
                                                                                                                                                                       South Korea
                                                                                                6.4
                                                                                                                                                                       Denmark

                                                                    4.3         4.6 4.4                                                                                India
                                                                                                                                                                       Belgium
                                                        2.1
                                                  1.4
                                                                                                                                                                       Poland
                                      1.3
                                                              0.9         0.9
                                            0.3                                                                                                                        Ireland

                                     2010                  2015          2018 2020               2025                                                       2030       Other
Source: BloombergNEF. Note: ‘Other’ -- Spain, Portugal, Italy, Finland, Sweden, Norway, Vietnam.

3      October 22, 2019
Global outlook

2019: a blockbuster for new build
Global offshore wind build
                                      Annual installations (GW)                                                                                                        China
                                                                                                                                      19.0

                                                                                                                                                                       U.K.
                                                                                                                                             17.2 17.3
                                                                                                                                                                16.8
                                                                                                                                                                       Germany
                                                                                                                               15.4
                                                                                                                                                         15.0          U.S.
                                                                                                                                                                       Netherlands
                                                                                                                                                                       Taiwan

                                                                                                                  10.1
                                                                                                                                                                       Japan
                                                                                                      9.7
                                                                                          9.2               9.2          9.4
                                                                                                                                                                       France
                                                                                                                                                                       South Korea
                                                                                                6.4
                                                                                                                                                                       Denmark

                                                                    4.3         4.6 4.4                                                                                India
                                                                                                                                                                       Belgium
                                                        2.1
                                                  1.4
                                                                                                                                                                       Poland
                                      1.3
                                                              0.9         0.9
                                            0.3                                                                                                                        Ireland

                                     2010                  2015          2018 2020               2025                                                       2030       Other
Source: BloombergNEF. Note: ‘Other’ -- Spain, Portugal, Italy, Finland, Sweden, Norway, Vietnam.

4      October 22, 2019
Global outlook

After a raucous 2018, a
quieter year for buy-outs
Global offshore wind acquisition                                                                    Global offshore wind transaction multiples
 Gigawatts (GW)                                                                                         Transaction multiples (2018 $m/MW)
                                                                11.7

                                                                 1.3                                     10
                                                                                                                                                    Commissioned/ 609MW
                                                                                                                                                    under construction
                                                                                                          8
                                                                 4.1
                                                                                                                                     Unclear date
                                                         7.0
                                                                               Under Construction                                    of financial
                                                                               / commissioned             6                          close
                   5.7                  5.9
                                                         2.3
                                        0.8
                   0.9                                                         Permitted
                                 3.8    2.1
                                               3.9                                                        4
            3.3
                          3.0    1.1           1.0                                                                                    Permitted
                                                                 6.2
    2.2                                                  3.7                                                  Announced
            2.2
                                                                                                                                                            1MW
                   4.2                         1.6                       1.6                              2
                          1.3                                                  Announced /
                                 2.7    3.0
    2.0                                                                 0.6    planning begun
            1.1           1.2                  1.4       1.0             0.8
    0.1
                                                                                                          0
    2010    2011   2012   2013   2014   2015   2016     2017    2018    2019
                                                                                                           2005     2007      2009        2011      2013    2015   2017        2019
                                                     Year of financial close                                                                                       Year of financial close
                                                                                                    Source: BloombergNEF. Notes: Includes only disclosed values. Exchange rate on day of
Source: BloombergNEF. Note: Closed deals only.                                                      project financial close. Deal count is 81, only two from outside of Europe.

5          October 22, 2019
Turbine supply: diverse in
China, consolidated elsewhere
Global offshore turbine manufacturer market share
                                            Annual Installations (GW)                                                      Non-contracted
                                                                                                                           Siemens Gamesa
                                                                                                                           MHI Vestas
                                                                                                                           Mingyang
                                                                                                                    15.4   Sewind
                                                                                                                           GE
                                                                                                                           Goldwind
                                                                                                                           Aerodyn
                                                                                    9.7
                                                                                                      10.1                 CSIC
                                                            9.2                                 9.2          9.4
                                                                                                                           Dongfang
                                                                                                                           Doosan
                                                                        6.4                                                Envision
                                                                                                                           Guodian
                                                4.4
                                                                                                                           Hitachi
                                                                                                                           Mitsubishi
                                                                                                                           Senvion
                                                                                                                           Sinovel
                                               2018        2019        2020        2021        2022   2023   2024   2025   XEMC
Source: BloombergNEF. Note: Includes conditional, unconditional and preferred supplier agreements.

6        October 22, 2019
Offshore wind capex forecast
                                  2018 $m/MW
                              3    2.82 2.76
                                             2.70
                                                    2.55 2.51 2.48
                                                                   2.46 2.43 2.40                    Transmission
                                                                                  2.38 2.35

                                   1.93 1.87                                                         Other
                              2              1.82 1.76
                                                       1.72 1.70 1.68 1.65
                                                                           1.63 1.61 1.59
                                                                                                     Installation

                              1                                                                      Array cable

                                                                                                     Foundation

                              0                                                                      Turbine
                                   2020 2021 2022 2023 2024 2025 2026 2027 2028 2029 2030
                                                                          Commissioning year
Source: BloombergNEF. Note: Transmission includes offshore and onshore substation and connecting export cable. ‘Other’ includes insurance,
engineering and management and contingency.

7     October 22, 2019
What will drive costs

Offshore wind turbine capacity forecast                                                       Average project water depth
  Turbine capacity (MW)
 15                                                                                            Water depth (m)                                            2019
                                                 Forecast                                     60

 10
                                                                                                                                                                        Average
                                                                                              40
                         Contracted
                                                                                                              Projects
    5
                                                                                              20

    0                                                                                         0
     1990            2000               2010          2020         2030                        1990                 2000                 2010               2020        2030
                                                   Commissioning year                                                                                      Commissioning year
                                                                                              Source: BloombergNEF. Note: Average depth across project area calculated relative to mean sea
Source: BloombergNEF. Note: Bold dots and line indicate the median. Error bars estimate the   level. Includes only European projects in BNEF’s 2030 offshore wind forecast (web | terminal).
10-90 percentiles. Data excludes China                                                        Excludes floating wind projects.

8       October 22, 2019
BNEF long-term outlook
                                             Cumulative installations (GW)                                177GW

                                                                                                                   China
                                                                                                                   U.K.
                                                                                                                   Germany
                                                                                                                   U.S.
                                                                                          19%                      Netherlands
                                                                                         CAGR                      Taiwan
                                                                                                                   Japan
                                                                                                                   France
                                                                                                                   South Korea
                                                                                                                   Denmark
                                                                                                                   India
                                            22GW
                                                                                                                   Belgium
                                                                                                                   Poland
                                                                                                                   Ireland
                                                                                                                   Other
                                            2018             2020                                  2025     2030
Source: BloombergNEF. Note: ‘Other’ -- Spain, Portugal, Italy, Finland, Sweden, Norway, Vietnam.

9        October 22, 2019
The U.S.
Aging fossil resources + high east coast
power prices drive build

10   October 22, 2019
The U.S.

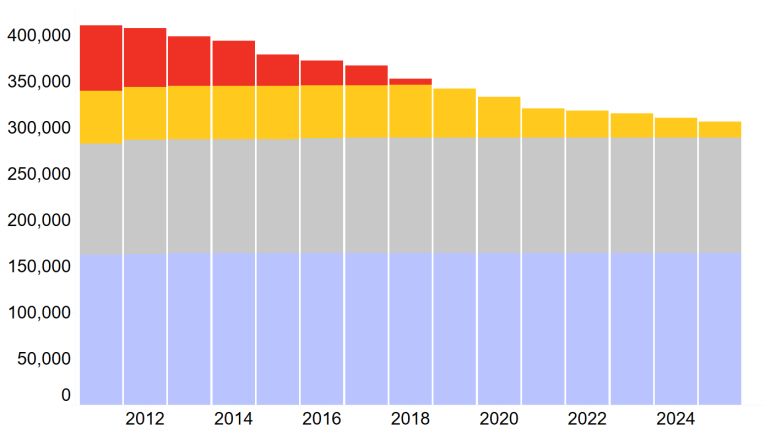
Ailing U.S. coal and nuclear
plants create a void
Coal and nuclear capacity by operating status                                            U.S. coal and nuclear plants by long-run
(MW)                                                                                     operating margin, 2011-25 ($MW-day)
                                              Retired
                                                                    Retiring

                                                                            Online, at
                                                                              risk

                                                                          Online, not
                                                                            at risk

Source: BloombergNEF U.S. Coal and Nuclear Retirement Monitor. Note: ‘at risk’ and
‘not at risk’ based on estimates of forward operating margins.                           Source: BNEF

11     October 22, 2019
The U.S.

New England has cheap gas
in summer…
Average ISONE merit order in July 2018 ($/MWh)

                                                                                                                                                                                        Oil
                                                                                                                                                                       Coal (sub-bit)
                                                                                                                               Hydro pumped storage

                                                                                                                                                                   Biomass
                                                                                                                                                                 Coal (bit)
                                                                                                                                                      Gas (OC)
                                                                                    Gas (CC)
                                              Nuclear

                                                               Hydro
                              Solar
                              Wind

Source: BloombergNEF U.S. Merit Order Maker             Note: Plants arranged in order of ascending short-run marginal cost.

12      October 22, 2019
The U.S.

…that becomes expensive in
winter

                                                                                                      Hydro pumped storage
Average ISONE merit order in January 2018 ($/MWh)

                                                                                                                                           Gas (OC)
                                                                                                                             Oil
                                                                                           Gas (CC)
                                                                                 Biomass
                                                                Coal (sub-bit)
                                                                 Coal (bit)
                                              Nuclear

                                                        Hydro
                              Solar
                              Wind

Source: BloombergNEF U.S. Merit Order Maker                                                                                    Note: Plants arranged in order of ascending short-run marginal cost.

13      October 22, 2019
The U.S.

Timing is everything
Average hourly capacity factors in Vineyard Wind’s lease area, 2007-2012

                      80%

                      70%

                      60%                                                                                                         2007
                                                                                                                                  2008
                      50%                                                                                                         2009
                                                                                                                                  2010
                      40%                                                                                                         2011
                                                                                                                                  2012
                      30%

                      20%
                                                                                                               The evening peak
                      10%

                        0%
                               1 2 3 4 5 6 7 8 9 10 11 12 13 14 15 16 17 18 19 20 21 22 23 24
Source: BloombergNEF, NREL.. Note: Historical wind generation from 2007-2012 comes from NREL’s WIND dataset.

14      October 22, 2019
The U.S.

Power is most valuable in the
evening
Hourly price profiles in New England ($/MWh), 2013-2018

                  90
                  80
                  70
                                                                                                          2013
                  60                                                                                      2014
                                                                                                          2015
                  50                                                                                      2016
                  40                                                                                      2017
                                                                                                          2018
                  30
                                                                                       The evening peak
                  20
                  10
                    0
                        1 2 3 4 5 6 7 8 9 10 11 12 13 14 15 16 17 18 19 20 21 22 23 24
              Source: BloombergNEF, NREL.   Note: Showing historical prices from ISONE Mass SE hub.
15     October 22, 2019
The U.S.

Merchant revenue estimate using
historical generation profiles
Estimated monthly merchant cash flows (nominal $m), 2021-2025

                                                                                                                Capturing winter peak power prices
                  40

                  30

                  20                                                                                                                                                                                  RECs

                                                                                                                                                                                                      Energy
                  10
                                                                                                                                                                                                      Capacity
                   -
                                                      Mar-22

                                                                                          Mar-23

                                                                                                                              Mar-24

                                                                                                                                                                  Mar-25
                                             Dec-21

                                                                                 Dec-22
                           Jun-21

                                                               Jun-22

                                                                                                   Jun-23

                                                                                                                     Dec-23

                                                                                                                                       Jun-24

                                                                                                                                                         Dec-24

                                                                                                                                                                           Jun-25

                                                                                                                                                                                             Dec-25
                                    Sep-21

                                                                        Sep-22

                                                                                                            Sep-23

                                                                                                                                                Sep-24

                                                                                                                                                                                    Sep-25
Source: BloombergNEF. Note: Energy and REC revenue based on matching 2012 generation profile with ISONE Mass SE hub day-ahead power price futures and MA Tier I REC prices. Assumed Vineyard Wind could be
paid for full capacity value in winter and summer after 2022/2023 energy year.

16      October 22, 2019
The U.S.

Vineyard Wind’s merchant value
looks close to its PPA value
Levelized revenue, 2021-2025

                                       Nominal $/MWh                                                                                               $76.4
                                                                                                                   $75.2

                                                                                             $28.8                 $28.8

                                                                                                                                                  $72.8

                                                                      $42.8                                        $42.8

                                                $3.7                                                                $3.7                           $3.7
                                            Capacity                Energy                  RECs                Merchant                           PPA

Source: BloombergNEF. Note: Value of ITC not shown. Future revenues discounted by 8% annual rate. Median merchant revenue estimate from 2007- 2012 generation profiles. See BNEF’s U.S. merchant solar and
wind revenue analysis and the interactive merchant revenue tool.

17      October 22, 2019
The U.S.

 U.S. offshore forecast: 15GW
 by 2030
 Gigawatts                                                                                                                            States
 2.5                                                                                                                                    OH
                                                                  2.15                               2.20
                                                                                                                              15.39
                                                                         2.00                 2.00                     0.02
                                                                                                                                        CT
  2.0                                               1.77                                                                      2.30
                                                                                                                       0.43
                                                                                1.60                                                    RI
  1.5                                                      1.35
                                                                                       1.20                                   4.33      VA

  1.0                                                                                                         0.02   6.39               NY
                                             0.66                                                                             3.50
                                                                                                              0.43   1.10
                                      0.43                                                                                              NJ
  0.5                                                                                                         0.39   1.73     1.59
                                                                                                                     1.10               MD
           0.03                                                                                             0.03              3.20
                                                                                                                     1.60
                                                                                                                                        ME
           2016   17   18   19   20   21     22     23     24     25     26     27   28    29     30        Cum.     Cum.     Cum.
                                                                                  Commissioning Year        2020     2025     2030      MA

Source: BloombergNEF

18      October 22, 2019
Copyright and disclaimer
Copyright
© Bloomberg Finance L.P. 2019. This publication is the copyright of Bloomberg Finance L.P. in connection with BloombergNEF. No portion of this document may be
photocopied, reproduced, scanned into an electronic system or transmitted, forwarded or distributed in any way without prior consent of BloombergNEF.
Disclaimer
The BloombergNEF ("BNEF"), service/information is derived from selected public sources. Bloomberg Finance L.P. and its affiliates, in providing the
service/information, believe that the information it uses comes from reliable sources, but do not guarantee the accuracy or completeness of this information, which is
subject to change without notice, and nothing in this document shall be construed as such a guarantee. The statements in this service/document reflect the current
judgment of the authors of the relevant articles or features, and do not necessarily reflect the opinion of Bloomberg Finance L.P., Bloomberg L.P. or any of their
affiliates (“Bloomberg”). Bloomberg disclaims any liability arising from use of this document, its contents and/or this service. Nothing herein shall constitute or be
construed as an offering of financial instruments or as investment advice or recommendations by Bloomberg of an investment or other strategy (e.g., whether or not
to “buy”, “sell”, or “hold” an investment). The information available through this service is not based on consideration of a subscriber’s individual circumstances and
should not be considered as information sufficient upon which to base an investment decision. You should determine on your own whether you agree with the
content. This service should not be construed as tax or accounting advice or as a service designed to facilitate any subscriber’s compliance with its tax, accounting or
other legal obligations. Employees involved in this service may hold positions in the companies mentioned in the services/information.

The data included in these materials are for illustrative purposes only. The BLOOMBERG TERMINAL service and Bloomberg data products (the “Services”) are
owned and distributed by Bloomberg Finance L.P. (“BFLP”) except that Bloomberg L.P. and its subsidiaries (“BLP”) distribute these products in Argentina, Australia
and certain jurisdictions in the Pacific islands, Bermuda, China, India, Japan, Korea and New Zealand. BLP provides BFLP with global marketing and operational
support. Certain features, functions, products and services are available only to sophisticated investors and only where permitted. BFLP, BLP and their affiliates do
not guarantee the accuracy of prices or other information in the Services. Nothing in the Services shall constitute or be construed as an offering of financial
instruments by BFLP, BLP or their affiliates, or as investment advice or recommendations by BFLP, BLP or their affiliates of an investment strategy or whether or not
to “buy”, “sell” or “hold” an investment. Information available via the Services should not be considered as information sufficient upon which to base an investment
decision. The following are trademarks and service marks of BFLP, a Delaware limited partnership, or its subsidiaries: BLOOMBERG, BLOOMBERG ANYWHERE,
BLOOMBERG MARKETS, BLOOMBERG NEWS, BLOOMBERG PROFESSIONAL, BLOOMBERG TERMINAL and BLOOMBERG.COM. Absence of any trademark
or service mark from this list does not waive Bloomberg's intellectual property rights in that name, mark or logo. All rights reserved. © 2019 Bloomberg.

19     October 22, 2019
BloombergNEF (BNEF) is a leading provider
of primary research on clean energy,
advanced transport, digital industry,
innovative materials, and commodities.

BNEF’s global team leverages the world’s
most sophisticated data sets to create clear
perspectives and in-depth forecasts that
frame the financial, economic and policy
implications of industry-transforming trends
and technologies.

BNEF research and analysis is accessible via
web and mobile platforms, as well as on the
Bloomberg Terminal.

Coverage.
Clean energy
Advanced transport
Commodities
Digital industry

                                               Client enquiries:
                                               Bloomberg Terminal: press  key twice
                                               Email: support.bnef@bloomberg.net

                                               Learn more:
                                               about.bnef.com | @BloombergNEF
You can also read