RISING EXPECTATIONS Market Indicators Report | Second Half 2019 - AUCKLAND RESIDENTIAL DEVELOPMENT REPORT - Scoop
←
→
Page content transcription
If your browser does not render page correctly, please read the page content below
RISING
   EXPECTATIONS
Market Indicators Report | Second Half 2019
    AUCKLAND RESIDENTIAL DEVELOPMENT REPORT

                         Kotuitui, Manukau
Kotuitui, Manukau
Developer: Avant Group with Te Akitai Waiohua
61 terrace homes designed by award-winning architect Ken Crosson

                                                                   Contents
                                                                   Economic Considerations                  1

                                                                   Residential Property Indicators          2

                                                                   Rising Expectations                      3

                                                                   Auckland Residential Market Overview     8

                                                                   New Zealand Residential Overview         8

                                                                     colliers.co.nz/Find-Research

                                                                     Follow us on LinkedIn:
                                                                     Colliers International - New Zealand

                                                                     Follow us on Twitter: @ColliersIntNZ

                                                                     Subscribe on YouTube: ColliersIntNZ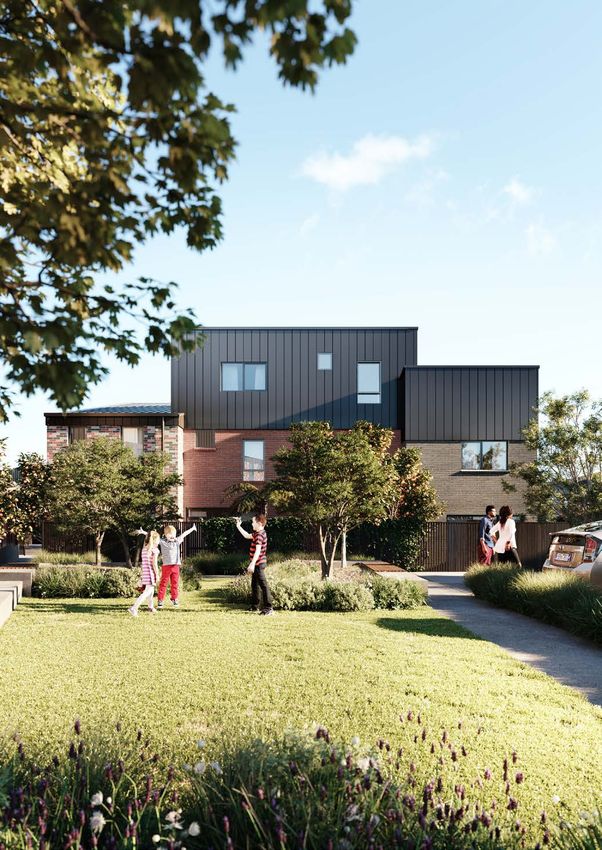
Economic Considerations Residential Property Indicators
INFLUENCING THE AUCKLAND RESIDENTIAL PROPERTY MARKET AUCKLAND | SECOND HALF 2019
POPULATION EMPLOYMENT & WAGE BUILDING CONSENTS* RESIDENTIAL BUYER TYPES (Q3 2019)
Population changes adjust the pressures Changes in unemployment and wages Changes in the number of consents
on the housing market. change a household’s willingness to take on
more debt.
influences the supply pipeline.
40% 22%
Movers
27%
Multiple property First home buyers
owners Source: CoreLogic, Q3-19
4% New to market, 5% Re-entry
& 2% Other
MEDIAN RESIDENTIAL SALE PRICE
APARTMENTS RESIDENCE SECTION
1.5% Increase in annual
population. 20 BPS Increase in
unemployment. 13% Increase in residential
building consents. $
846,000
-0.5% from a year ago
886,000
$
2.6% from a year ago
$
465,000
1.1% from a year ago
Estimated resident population
for regonal council. SEPTEMBER 2018: 4.1% SEPTEMBER 2018: 12,945 Source: REINZ, YTD Oct-19
SEPTEMBER 2019: 4.3% SEPTEMBER 2019: 14,634
2018 JUNE: AUCKLAND REGION: 1,618,400
2019 JUNE: AUCKLAND REGION: 1,642,800
Source: Stats NZ (October-2019 update)
Source: Stats NZ, Labour Force Status by
Age Group by Regional Council (Annual-Sep)
Source: Stats NZ, Building consents by region
(Annual – Sep) NEW SUPPLY: APARTMENTS
29 Completed Q1-19 TO Q3-19
2020F: EXISTING SUPPLY BREAKDOWN
CBD CITY FRINGE SUBURBAN
3,430 units
7 MORE EXPECTED
TO COMPLETE BY END 2019 (58 projects) 55% 24% 21%
MEDIAN ANNUAL DAYS TO SELL PROJECTS COMPLETED IN 2019
OFFICIAL CASH RATE AUCKLAND SENTIMENT FINANCING - NZ (ANNUAL TO OCTOBER 2019) CBD CITY FRINGE SUBURBAN
Percentage change in OCR drop
from Jun-19 to Nov-19
Residential property market
participants view of median
Changes in mortgage interest rates affect
household’s ability to repay their mortgages.
APARTMENTS RESIDENCE SECTION 34% 28% 38%
house price across New Zealand 42 Days
42 Days
81 Days
over the next 12 months. 4 days 3 days 37 days PROJECTS FORECAST TO BE
from a year ago from a year ago from a year ago COMPLETED BY 2020
Source: REINZ, YTD Oct-19
CBD CITY FRINGE SUBURBAN
PRICING (PROJECTS UNDER CONSTRUCTION) 33% 14% 53%
AVERAGE FLOOR AREA AVERAGE ASKING PRICE*
98m2 (2 bdrm) $ 12,264/m2 (2 bdrm) Depending on typology and location
154m2 (3 bdrm) $
13,822/m2 (3 bdrm) Average price across all individual developments tracked
All prices include GST and area based on GFA (internal and balcony area)
50 BP The Official Cash Rate
droped 50 basis points
from June to November 6.0 % Net optimistic
minus pessimistic
42
Basis points
Decrease in standard
fixed one-year mortgage
interest rate
NEW SUPPLY: TERRACED & DETACHED HOMES
PROJECTS - Supply Pipeline to 2022
Auckland recorded a net positive AVERAGE FLOOR AREA AVERAGE ASKING PRICE
JUNE 2019: 1.50% score for the first time since OCTOBER 2018: 4.77% Projects Commenced /
NOVEMBER 2019: 1.00% December 2018. OCTOBER 2019: 4.35% 36 Under Construction 87m2 (2 bdrm) $7,932/m2 (2 bdrm)
Source: RBNZ, OCR Source: Colliers International Residential Property
Market Outlook Survey Sep-19
Source: RBNZ, New Residential Mortgage
Lending by Borrower Type – C31
15 Marketing/Consent 121m2 (3 bdrm) $
6,829/m2 (3 bdrm)
1,435 Units Average price across all individual developments tracked
All prices include GST and area based on GFA (internal and balcony area)
1 2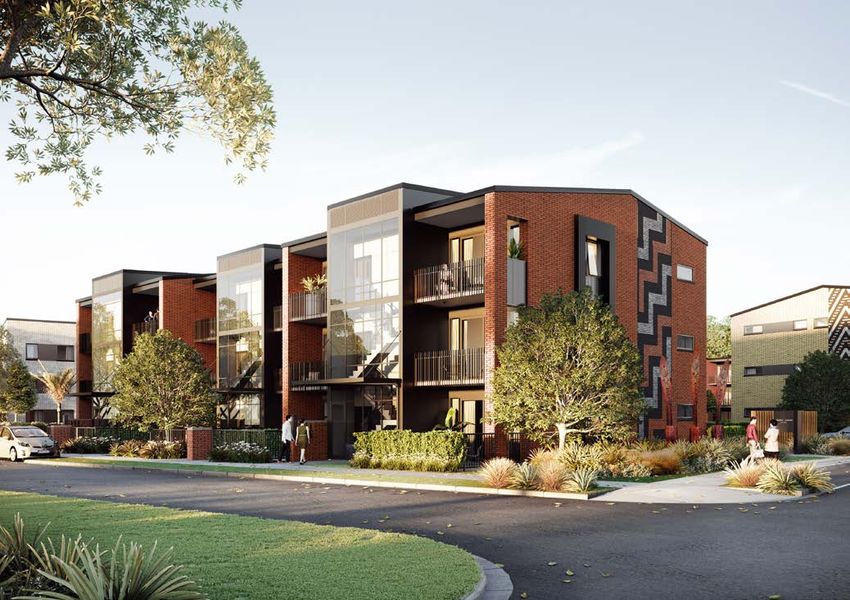
Rising
Expectations
The last quarter of 2019 is shaping up to be pivotal for
Auckland’s residential sector. It is likely to be the time that the
Auckland region showed signs of life again after flatlining for
around three years.
Under current conditions, we expect price growth outside of
Auckland will remain positive in 2020, but most likely start to
slow from significant highs. Auckland will likely start its next
growth phase in 2020. While annual price rises in Auckland are
likely to remain modest to start with, it does set the scene for
higher rates of growth in 2021.
In concert with price rises is the rise in stock to purchase - the
two go hand in hand. What we have seen already is that many
apartment projects have been completed in 2019 (the largest
number of units in 14 years). Further, a large pipeline of stock
under construction (around 5,000 units) will hit the market in
2020 and 2021 with more in the marketing and consent phase.
There is a variation in prices, sizes and location.
While low interest rates, high levels of population growth and
solid job prospects have been major drivers of the recent
upswing in development, it is undeniable that the Auckland
Unitary Plan has been a major lever enabling this growth.
Intensification in brownfield locations has been instrumental,
especially when focused around other key attributes like
infrastructure and amenity.
As the chart on page 5 notes, investors and first home
buyers provide the lion’s share of purchasing activity for new
apartments in Auckland. First home buyers have returned to
the market recently as more developers have matched their
product with customer requirements i.e price and size. While
owner-occupiers (otherwise dubbed ‘movers’) may reduce their
share in activity, they remain a key component to the health of
the sector.
In 2020, we expect developers will continue to focus on
delivering more affordable apartments, catering to the ongoing
demand from first home buyers and the prolific number of
investors. Historically low interest rates and rising rents provide
the impetus.
We will also hear more announcements of new ‘build to rent’
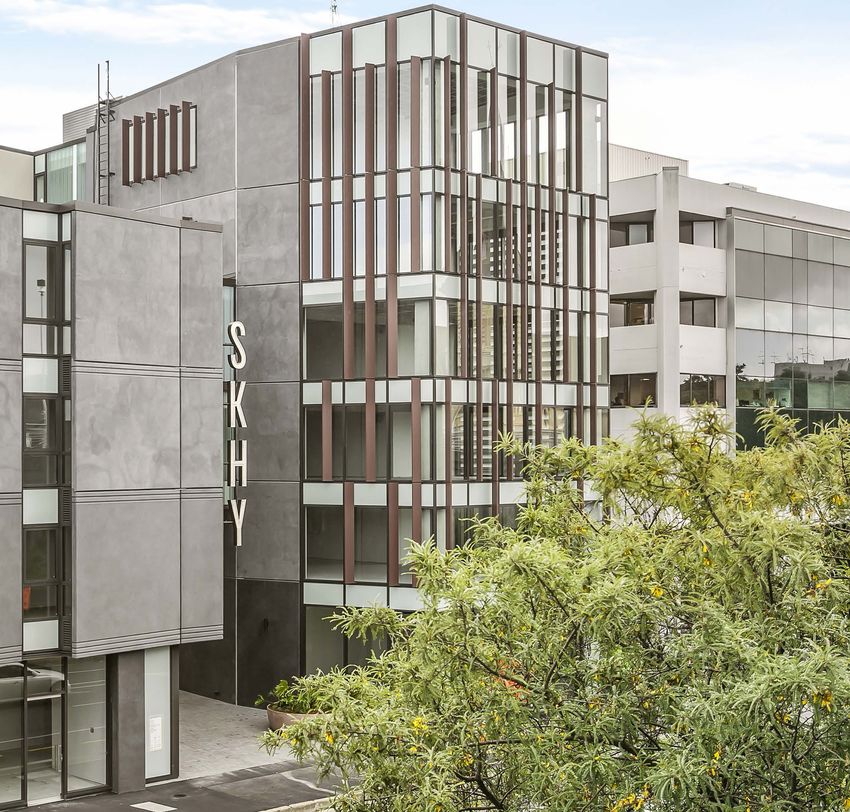
projects in 2020 in Auckland. This is due to the solutions the SKHY, Grafton
sector solves for a changing demographic, ongoing increases in Developer: Lamont & Co.
rents and the return of capital value growth. Architect: Cheshire
Chris Dibble
Director | Research & Communications
3 4
Residential Building Consents (Sep) Average $/sqm - Auckland Apartment
Houses Apartments Townhouses, flats, units, and other dwellings
CBD City Fringe Suburban Average
16
$16,000
14 $15,208
No.of Consents (Thousands)
Average Asking Price per sqm*
$14,000 $13,802
12
$12,683
$12,000
10
$10,000
8 $9,038
$8,000
6
$6,000
4
$4,000
2
$2,000
0
$0
2000
2001
2002
2003
2004
2005
2006
2007
2008
2009
2010
2011
2012
2013
2014
2015
2016
2017
2018
2019
1H 2017
1H 2019
1H 2018
1H 2016
2H 2017
2H 2018
2H 2016
September Month
Source: StatsNZ, Colliers International Research
Source: Colliers International Research, Colliers Apartment Survey Report 1H 2019
Auckland Region Apartment Purchaser Profile (Existing & New Apartments)
First Home Buyer Mover Multiple Property Owner Cash
Average Asking Price - Auckland Apartment
60.0% Multiple Property Owner Mortgage Other
CBD City Fringe Suburban Average
50.0%
$1,600
Average Asking Price* (Thousands)
40.0% $1,400 $1,314
$1,290
$1,200
$1,142
30.0%
$1,000
$800 $822
20.0%
$600
10.0% $400
$200
0.0%
$0
2005
2006
2007
2008
2009
2010
2011
2012
2013
2014
2015
2016
2017
2018
2019
2005
2006
2007
2008
2009
2010
2011
2012
2013
2014
2015
2016
2017
2018
2019
1H 2017
1H 2019
1H 2018
1H 2016
2H 2017
2H 2018
2H 2016
Existing New
Source: CoreLogic, Colliers International Research
Note: New (Where building age is within 12-months of transfer/purchase) Source: Colliers International Research, Colliers Apartment Survey Report 1H 2019
Regional Mortgage Payments to Income (%)
Median Price Outlook Survey
New Zealand Auckland New Zealand ex Auckland
Stay the same Decrease Increase by less than 5% p.a.
60.0%
Increase by more than 5% p.a.
50.0%
2019 Q3 30% 32% 28% 10%
40.0%
30.0%
2019 Q2 33% 37% 23% 8%
20.0%
10.0%
Assumes a 25 year mortgage, with 20% deposit and the 2019 Q1 33% 39% 22% 7%
minimum interest rate available
0.0%
Boathouse Bay, Snells Beach
1993
1994
1995
1996
1997
1998
1999
2000
2001
2002
2003
2004
2005
2006
2007
2008
2009
2010
2011
2012
2013
2014
2015
2016
2017
2018
2019
Developer: Special Projects Team
0% 10% 20% 30% 40% 50% 60% 70% 80% 90% 100%
Architect: Crosson
Source: ANZ Research, REINZ, RBNZ, Statistics NZ Source: Colliers International Research, Collieres Residential Property Market Outlook Survey Q3 2019
5 6
New Zealand Auckland
2H2019 Apartment Project Announcements Residential Market Residential Market
>>Multiple property owners (investors) are buying 40% of all
>>Multiple property owners (investors) are buying 37% of all types of residential properties sold, movers 22%, first home
Deferred 11
types of residential properties sold, movers 26%, First home buyers 27%, New to market 4%, Re-entry 5% and 2% for
buyers 24%, New to market 5%, Re-entry 5% and 3% for Others. (CoreLogic).
Abandoned 3 Others.
>>The annual number of new residential building consents
>>Between June 2018 and June 2019, household debt as a increased from 12,945 (Sep-18) to 14,634 (Sep-19), an increase
Launched 18
percentage of nominal disposable income increased from of 13.0% (Stats NZ).
0 5 10 15 20
163.7% to 164.4%. (RBNZ)
>>The median annual price of apartments in the year to October
>>New residential mortgage lending to investors increased to 2019 was $846,000 (0.5% annual decrease), $886,000 (2.6%
Source: Colliers International Research
$1,196 million in October 2019, a 16.0% increase from a year annual decrease) for residences and $470,000 (1.1 % annual
ago. Lending to first time buyers has increased to $1,102 increase) for sections (REINZ).
million in October 2019, 19.8% increase from a year ago
(RBNZ). >>The mean residential weekly rent in September 2019 is $566
in Auckland, $485 in Franklin, $547 in Manukau, $615 in
>>The annual number of new residential building consents North Shore, $525 in Papakura, $554 in Rodney and $533 in
increased from 32,548 (Sep-18) to 36,446 (Sep-19), an Waitakere (MBIE). North Shore experienced the largest annual
increase of 12.0% (Stats NZ). rental increase at 4.8%
Auckland Apartment Projetcs by Development Stage
>>The median price for in the year to October 2019 is $571,000 >>From Q1 2019 to Q3 2019, 29 apartment projects have been
Existing Supply Under Construction Marketing & Consent (6.7% annual increase) for apartments, $592,000 (4.4% annual completed providing 2038 units.
4,000 increase) for residences and $260,000 (2.0% annual increase)
3,500 for sections (REINZ). >>Since our last report (1H 2019), 1,050 apartment units (15
3,000
projects) have been completed and 346 apartment units (7
>>Queenstown, Tauranga/Mt Maunganui and Napier/Hastings projects) are expected to complete before the end of 2019.
2,500
were the three centres where the highest proportion of
2,000
respondents in our September 2019 Residential Market >>The total number of apartment units estimated for completion
1,500
Outlook Survey expect the median price to increase over the in 2020 is around 3,430 units (58 projects), 95% of these
1,000 next 12 months. projects are currently under construction.
500
>>Median price outlook for Auckland has recorded a net positive
0
6.0% in our latest Residential Property Market Outlook Survey
2000
2001
2002
2003
2004
2005
2006
2007
2008
2009
2010
2011
2012
2013
2014
2015
2016
2017
2018
2019
2020F
2021F
Q3 2019 and is the first positive record for the region this year.
Source: Colliers International Research Auckland also experienced the greatest improvement across
New Zealand compared to our Q2 2019 survey when it scored
a net negative 6.4%.
Auckland Apartment Projects by Precinct
CBD City Fringe Suburban
4,000
3,500
3,000
2,500
2,000
1,500
1,000
500
0
2000
2001
2002
2003
2004
2005
2006
2007
2008
2009
2010
2011
2012
2013
2014
2015
2016
2017
2018
2019
2020F
2021F
FABRIC of Onehunga Source: Colliers International Research SKHY
Developer: Lamont & Co. Developer: Lamont & Co.
7 8
Fraser Avenue, Northcote
Developer/Builder: NZ Living

For more information contact:                                                                                        Colliers International Research
                                                                                                                     and Consulting offers a range of
                                                                                                                     commercial and residential
Chris Dibble                                            Pete Evans                                                   property solutions:
Director |                                              National Director |
Research & Communications                               Residential Project Marketing                                • Property Investment Strategies

Alan McMahon                                            Jeff Davidson                                                • Demand & Supply Studies
National Director |                                     Director |                                                   • Market Analysis & Forecasts
Strategic Advisory                                      Residential Project Marketing                                • Feasibility Analysis
Adrian Goh                                                                                                           • GIS Spatial Analysis
Research Analyst                                        Colliers International
                                                                                                                     • Catchment Analysis
                                                        Level 27, SAP Tower
Anna Sizova                                             151 Queen St,                                                • Lease Audit & Benchmarking
Research Analyst                                        Auckland                                                     • Site Options Analysis
                                                        +64 9 358 1888                                               • Corporate Real Estate Strategy
                                                                                                                     • Financial Analysis
                                                                                                                     • Business Cases

Whilst all care has been taken to provide reasonably accurate information within this report, Colliers International cannot guarantee
the validity of all data and information utilised in preparing this research. Accordingly Colliers International New Zealand limited, do
not make any representation of warranty, expressed or implied, as to the accuracy or completeness of the content contained herein
and no legal liability is to be assumed or implied with respect thereto.
© All content is Copyright Colliers International New Zealand Limited 2019 (Licensed REAA 2008) and may not be reproduced without
expressed permission.                                                                                                                            Licensed REAA 2008
You can also read