Tropical Storm Michael | Report #4 - Department of Energy
←
→
Page content transcription
If your browser does not render page correctly, please read the page content below
Tropical Storm Michael | Report #4
  REPORT TIME & DATE:         5:00 PM EDT | Thursday, October 11, 2018
  INCIDENT START DATE:        Wednesday, October 10, 2018
  PRIMARY LOCATION(S):        Alabama, Florida, Georgia, North Carolina, South Carolina
  REPORT DISTRIBUTION:        Public

                                       EXECUTIVE SUMMARY
As of 5:00 PM EDT, Tropical Storm Michael was 20 miles north-northwest of Raleigh, North Carolina,
moving northeast at 24 MPH, with maximum sustained winds of 50 MPH. Tropical storm-force winds
extend outward from the center up to 230 miles. On the forecast track, the center of Michael will move
across eastern North Carolina and southeastern Virginia this evening, and move into the western Atlantic
Ocean tonight.

Electricity Sector Summary
    • Customer Outages as of 4:00 PM EDT:
            o Alabama: 87,706 customer outages (3%)
            o Florida: 389,639 customer outages (3.7%)
            o Georgia: 268,461 customer outages (6.4%)
            o North Carolina: 361,879 customer outages (9%)
            o South Carolina: 117,221 customer outages (2.6%)
            o Note: Customer outages number will continue to increase and may fluctuate as the
                Hurricane Michael impacts the southeast.
    • Crews in the impacted area have begun to perform damage assessments and restorations as the
        weather and flooding permit.
    • Fluctuation in the outage numbers is expected and normal during large-scale restoration efforts.
    • Utilities across the impacted area pre-staged crews, equipment, and materials and mutual
        assistance networks have been activated, with over 30,000 personnel positioned to support
        restoration efforts.

Oil & Natural Gas Sector Summary
    • For the week ending on October 5, the Lower Atlantic Region (WV, VA, NC, SC, GA, and FL) had
       28.1 million barrels of total gasoline stocks, according to the Energy Information Administration.
       This is 9% higher than the 5-year average for this time of year.
    • As of 12:00 PM October 11, 6.0% of Florida gas stations (including 38% of Florida Panhandle
       stations), 2.6% of Georgia gas stations, and 1.3% of Alabama gas stations were reported out-of-
       service due to lack of fuel and/or power.

                                                                                               PAGE 1 OF 8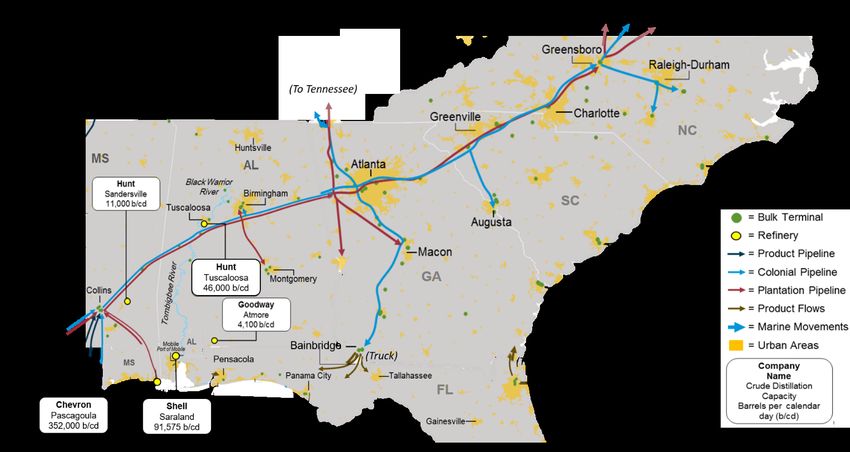
SITUATION REPORT                                                                                October 11, 2018

                                        TROPICAL STORM MICHAEL
As of 5:00 PM EDT, Tropical Storm Michael was 20 miles north-northwest of Raleigh, North Carolina, moving
northeast at 24 MPH, with maximum sustained winds of 50 MPH. Tropical storm-force winds extend outward from
the center up to 230 miles. On the forecast track, the center of Michael will move across eastern North Carolina
and southeastern Virginia this evening, and move into the western Atlantic Ocean tonight.

Michael is forecast to produce total rain accumulations of 4 to 7 inches from north-central North Carolina, into
south-central Virginia, including the Delmarva Peninsula.

A tropical storm warning remains in effect from South Santee River, South Carolina to Duck, North Carolina, as
well as the Pamlico and Albemarle Sounds.

                                                                                                         Page 2 of 8
SITUATION REPORT October 11, 2018
ELECTRICITY SECTOR
POWER OUTAGES
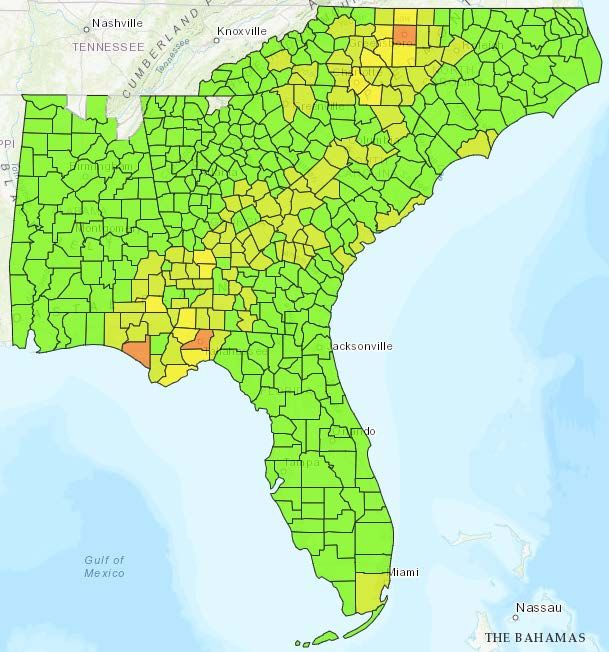
Outage Map (as of 4:00 PM EDT)
ELECTRICITY OUTAGES AS OF 4:00 PM EDT 10/11/2018
Current Confirmed Percent of Total Customers 24-Hour Peak
Impacted State
Customer Outages in State without Power Customer Outages
Alabama 87,706 3.09% ***
Florida 389,639 3.68% 400,666
Georgia** 268,461 6.44% 424,744
North Carolina 361,879 8.98% 361,879
South Carolina 117,221 2.60% 128,493
Total 1,224,906 - *
*There is no sum of the Peak Customer Outage column because peaks for individual utilities occur at different times; a total
would not reflect peak outages.
***Additional customer outages reported by Alabama State EOC are included in the latest outage numbers for Alabama,
which were not available for the prior report. As such, a 24-hour peak is not available.
Page 3 of 8SITUATION REPORT October 11, 2018
ELECTRICITY IMPACTS & RESTORATION EFFORTS
• Crews in the impacted area, where the storm has passed, have begun to perform damage assessments
and restorations as the weather conditions permit. Estimate restoration timelines will begin to be
developed once damage assessments are complete.
• Duke Energy reports nearly 6,000 workers including power line technicians, damage assessors and tree
specialists are ready to respond to the storm’s impact in the Carolinas.
• Fluctuation in the outage numbers is expected and normal during large-scale restoration efforts.
• Impacted and potentially impacted utilities have mobilized over 30,000 personnel, including utility
crews, contractors, and mutual assistance workers from at least 24 states to restore power.
• Restoration efforts and damage assessments will be limited until the storm has passed and weather
conditions permit. Crews are unable to operate in heavily flooded areas and when wind speeds are
greater than 30 MPH.
• Potentially affected utilities have prepositioned crews, materials, and equipment to begin restorations
as conditions permit.
• Mutual aid networks have been activated and crews from utilities across the country are preparing to
support restoration efforts.
Alabama
87,706 Customer Outages - -
• Significantly Impacted Utilities
o Alabama Power: 34,288 Customer Outages
• Note: Additional customer outages reported by Alabama State EOC are included in the latest outage
numbers for Alabama, which were not available for the prior report. As such, a 24-hour peak is not
available and percent change are not available.
Florida
389,369 Customer Outages ↓ 3% since Oct 11, 8:00 AM EDT 400,666 24-hr Peak Outages
• Significantly Impacted Utilities
o Gulf Power (Southern Company): 112,089 Customer Outages
o Tallahassee Electric: 104,628 Customer Outages
o Talquin Electric Coop: 48,281 Customer Outages
o Duke Energy Florida: 30,703 Customer Outages
Georgia
268,639 Customer Outages ↓ 37% since Oct 11, 8:00 AM EDT 424,744 24-hr Peak Outages
• Significantly Impacted Utilities
o Georgia Power: 116,815 Customer Outages
o Municipal Utilities: ~80,000 Customer Outages
o Mitchell EMC: 24,162 Customer Outages
o Grady EMC: 18,621 Customer Outages
o Sumter EMC: 15,792 Customer Outages
Page 4 of 8SITUATION REPORT October 11, 2018
North Carolina
361,879 Customer Outages ↑ >100% since Oct 11, 8:00 AM EDT 361,879 24-hr Peak Outages
• Significantly Impacted Utilities
o Duke Energy: 307,503 Customer Outages
o Energy United: 39,854 Customer Outages
• Outages in North Carolina continue to increase as the storm continues to impact the State.
South Carolina
117,221 Customer Outages ↓ 9% since Oct 11, 8:00 AM EDT 128,493 24-hr Peak Outages
• Significantly Impacted Utilities
o Duke Energy: 25,853 Customer Outages
o South Carolina Electric & Gas: 24,595 Customer Outages
o South Carolina Cooperatives: 14,970 Customer Outages
BACKGROUND AND PREPARATIONS
• The affected area is served by several utilities, including investor owned utilities, municipal utilities, and
cooperative utilities. The three associations that represent these unities and manage the mutual
assistance networks, Edition Electric Institute (EEI), American Public Power Association (APPA), and the
National Rural Electric Cooperative Association (NRECA), have been in regular contact with DOE, the
potentially affected entities, and their mutual assistance networks.
Page 5 of 8SITUATION REPORT October 11, 2018
OIL & NATURAL GAS SECTOR
OIL AND NATURAL GAS SECTOR OVERVIEW
The map below highlights the petroleum fuels supply chain in the area threatened by Hurricane Michael.
OFFSHORE PRODUCTION AND OIL & GAS PLATFORMS
• As of 12:30 PM EDT, October 11, 680,107 b/d (40.0%) of the oil production and 744 MMcf/d (29.1%) of
the natural gas production in the federally administered areas of the U.S. Gulf of Mexico are shut-in,
according to estimates by the Bureau of Safety and Environmental Enforcement (BSEE).
U.S. Gulf of Mexico Oil & Gas Production Status
as of 12:30 PM EDT 10/11/2018
Shut-In
Production Pre-Event
(10/11)
Crude Oil (b/d) 1,700,000 680,107
Natural Gas (MMcf/d) 2,560 744
Pre-Event Evacuated
Infrastructure
Count (10/11)
Manned Platforms 687 59
Rigs 37 2
Source: BSEE
Page 6 of 8SITUATION REPORT October 11, 2018
PORTS
• The U.S. Coast Guard has set the following conditions for Gulf Coast and Southeast ports as a result of
Hurricane Michael.
Status of Southeast Ports as of 2:30 PM EDT 10/11/2018
2016 Volumes (b/d)
Date
Port Sector Port Status Products* Crude Oil
Stamp
In Out In Out
Mobile, AL Open. 10/10 4,000 136,000 210,000 12,000
Pascagoula, MS Open. 10/10 13,000 114,000 156,000 2,000
Mobile
Panama City, FL Closed. Port Status Zulu. 10/09 7,697 - - -
Pensacola, FL Closed. Port Status Zulu. 10/09 10,273 - - -
Jacksonville Jacksonville, FL Open. 10/11 86,000 1,000 - -
Savannah Savannah, GA Open. 10/11 15,000 1,000 - -
Open with restrictions. Port Status modified
Charleston Charleston, SC 10/11 22,000 - - -
Yankee.
North
Wilmington, NC Closed. Port Status Zulu. 10/10 6,000 - - -
Carolina
Norfolk, VA Open with restrictions. Port Status X-ray. 10/10 7,000 9,000 - -
Hampton
Newport News,
Roads Open with restrictions. Port Status X-ray. 10/10 3,000 - - -
VA
*Transportation fuels (gasoline, distillate, jet fuel) volumes only.
Source: U.S. Coast Guard Homeport, U.S. Army Corp of Engineers, EIA Company Level Imports
FUEL STOCKS
• For the week ending on October 5, the Lower Atlantic Region (WV, VA, NC, SC, GA, and FL) had 28.1
million barrels of total gasoline stocks, according to the Energy Information Administration (EIA). This is
9% higher than the 5-year average for this time of year.
• For the week ending on October 5, the Lower Atlantic Region had 12.6 million barrels of total distillate
stocks, according to EIA. This is equivalent to the 5-year average for this time of year.
• Florida Department of Emergency Management (FDEM) is monitoring statewide fuel stocks and retail
fuel supplies; no reported supply shortages, distribution issues, or retail fuel shortage reported as of
October 9.
RETAIL FUEL STATIONS
• As of 12:00 PM October 11, 6.0% of Florida gas stations (including 38% of Florida Panhandle stations),
2.6% of Georgia gas stations, and 1.3% of Alabama gas stations were reported out-of-service due to lack
of fuel, lack of power, or both, according to GasBuddy.com.
Page 7 of 8SITUATION REPORT October 11, 2018
EMERGENCY DECLARATIONS & WAIVERS
EMERGENCY DECLARATIONS
To provide vital supplies and transportation services to a disaster area in the United States, emergency
declarations may be issued by the President, Governors of States, or Federal Motor Carrier Safety Administration
(FMCSA). These declarations trigger the temporary suspension of certain Federal safety regulations, including
Hours of Service, for motor carriers and drivers engaged in specific aspects of the emergency relief effort. See 49
CFR 390.23 for the actual emergency regulation.
State Emergency Declarations and HOS Waivers as of 2:30 PM EDT 10/11/2018
Effective Dates
State* Details Status
Start End
AL, FL, GA, LA, MS,
FMCSA Regional Emergency Declaration 10/09 11/09 Active
NC, SC, TN
Florida* State of Emergency Declaration 10/07 12/06 Active
South Carolina** State of Emergency Declaration 10/08 11/07 Active
Alabama State of Emergency Declaration 10/08 11/07 Active
Georgia* State of Emergency Declaration 10/09 10/16 Active
North Carolina* State of Emergency Declaration 10/10 Until Rescinded Active
Kentucky State of Emergency Declaration 10/10 11/10 Active
Virginia State of Emergency Declaration 10/11 11/11 Active
Sources: U.S. Department of Transportation; Governor Office Websites
*Includes 35 counties in northern Florida, 92 counties in southern Georgia, and 66 counties in North Carolina. See Declarations for
the full listing.
**South Carolina issued a thirty day extension of its Hurricane Florence emergency declaration
FUEL WAIVERS
The Environmental Protection Agency (EPA), working with the Department of Energy (DOE), responds quickly to
address fuel supply disruptions caused by hurricanes or other natural disasters by issuing emergency waivers of
certain fuel standards in affected areas. There are no fuel waivers at this time.
OTHER FEDERAL WAIVERS
• On October 10, PHMSA issued an Emergency Stay of Enforcement for pipeline and LNG facility
operators affected by Hurricane Michael. Under the stay, PHSMA does not intend to take enforcement
action relating to operators’ temporary noncompliance with operator qualification requirements found
in 49 C.F.R. §§ 192.801–192.809 and 195.501–195.509, or pre-employment and random drug testing
requirements found in 49 C.F.R. § 199.105(a), (c) arising from the use of personnel for pipeline activities
related to response and recovery. The stay which went into effect on October 10 will remain in effect for
45 days until November 24, unless PHMSA determines an extension is required. In addition, on October
10, PHMSA issued an Emergency Assistance Personnel waiver for Alabama, Florida, Georgia, North
Carolina, and South Carolina affected by Hurricane Michael. For 30 days following October 10, PHMSA
waived the notice required under 49 U.S.C. § 60118(d),which necessitates a 60-day review period for
States to notify PHMSA that it intends to waive a pipeline safety regulation adopted by the State
pursuant to State certification under 49 U.S.C. § 60105 for the above listed requirements.
Page 8 of 8You can also read