Creating large-scale maps for agriculture using remote sensing
←
→
Page content transcription
If your browser does not render page correctly, please read the page content below
E3S Web of Conferences 227, 03002 (2021)                                 https://doi.org/10.1051/e3sconf/202122703002
GI 2021

       Creating large-scale maps for agriculture using
       remote sensing
       Gayrat Yakubov1*, Khamid Mubarakov1, Ilkhomjon Abdullaev1, and Azizjon Ruziyev1
       1
       National University of Uzbekistan, Faculty of Geography and Natural Resources, Department of
       Geodesy and Geoinformatics, 100174, Tashkent, Uzbekistan

                     Abstract. Reliable information on the real state of agricultural lands will
                     be required to the development of appropriate measures for the rational use
                     of agricultural lands. To obtain such information, it is necessary to keep
                     permanent and systematic records and inventories of land resources. Large-
                     scale special plans and maps will be required for accounting, inventory and
                     classification of agricultural land. Currently in Uzbekistan such
                     cartographic materials are being created on the scale 1: 10 000 and 1: 25
                     000 by administrative and territorial units, farms or individual land plots.
                     The article considers the issues of creation of special maps of agricultural
                     land in scale 1:10000 on the example of Sharof Rashidov district of
                     Jizzakh region using remote sensing data with very high spatial resolution
                     KOMPSAT-3.

       1 Introduction
           Agriculture is one of the most important sectors in the economy of the Republic of
       Uzbekistan. According to the latest data provided by The State Committee on Land
       Resources, Geodesy, Cartography and State Cadastre, 46.25% of the total territory of the
       country is used for agricultural purposes [1]. For rational, effective and targeted use, as well
       as for the protection of land resources, it is necessary to carry out accounting, analysis and
       evaluation by regularly and systematically obtaining information about their state. Large-
       scale agricultural maps are important sources that provide the ability to quickly obtain
       information about the state of the land areas of specific administrative, territorial units. In
       order, cartographic, statistical data or results of terrestrial measurements and remote sensing
       materials are used to create agricultural maps [2]. However, remote sensing materials can
       be considered essential data in terms of their spatial, spectral and temporal resolution
       capabilities.
           Nowadays, the data obtained from Earth Observing Systems such as Sentine-2, Landsat-
       7, Landsat-8, EOS AM-1 can be used for agricultural purposes [3], they provide
       multispectral images with spatial resolutions from 10 meters to 250 meters. However, the
       images obtained from these spacecraft do not allow the creation of large-scale maps (1:
       25000 and 1: 10000) of relatively small land plots (for example, farms) [4, 5]. Studies have
       shown the feasibility of using satellite images of very high spatial resolution (≥0.5 m) for

       *
           Corresponding author: yakubov1203@gmail.com

© The Authors, published by EDP Sciences. This is an open access article distributed under the terms of the Creative Commons
Attribution License 4.0 (http://creativecommons.org/licenses/by/4.0/).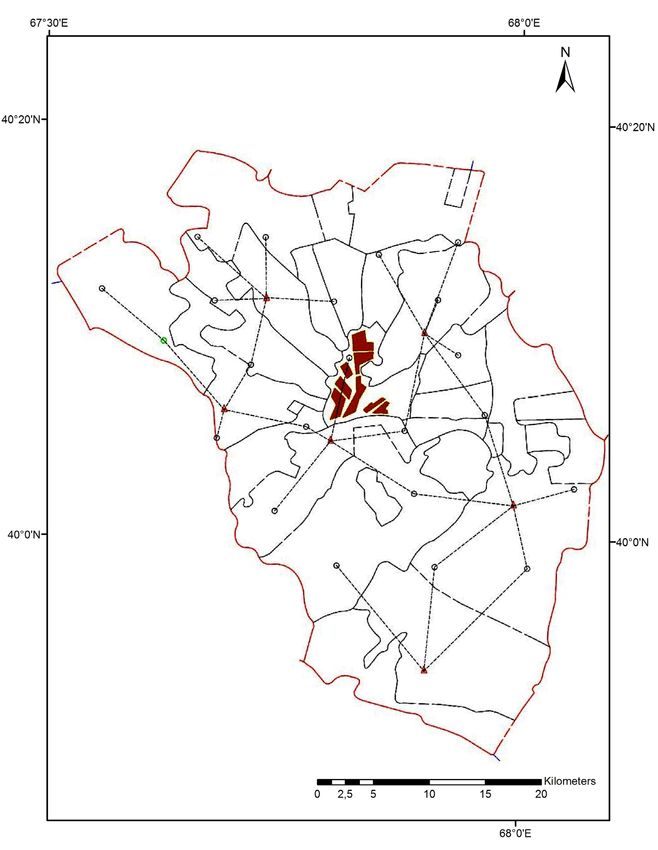
E3S Web of Conferences 227, 03002 (2021)                            https://doi.org/10.1051/e3sconf/202122703002
GI 2021

      the creating and updating of large-scale maps, in terms of accuracy, reliability and
      efficiency [6, 7].
           In recent years Uzbekistan has paid special attention to the introduction of modern
      technologies in agriculture. In particular, the Decree of the President of the Republic of
      Uzbekistan from May 31, 2017 (PU-5065) directed to the use of remote sensing materials
      for monitoring and mapping of land resources was adopted [8]. In addition, Presidential
      Decree No. PP-4709 was adopted on 11 May 2020 [9]. The Decree defines measures to
      specialise certain regions of the Republic of Uzbekistan, in particular the districts of Jizzak
      region, in the cultivation of agricultural products. Based on the above, the article deals with
      the issues of creation of large-scale (1: 10000) maps of agricultural land based on
      geographic information systems using global navigation satellite technology (GNSS) and
      remote sensing (RS) materials on the example of Sharof Rashidov district of Jizzakh
      region. (Figure 1).

      Fig. 1. Area of study – Jizzakh region, Sharof Rashidov district.

      2 Materials and methods
          The State Committee for Land Resources, Geodesy, Cartography and State Cadastre of
      the Republic of Uzbekistan is the main competent authority for the creation of cartographic
      products of various scales in the country. Currently, the Committee uses images with very
      high spatial resolution of the KOMPSAT (Korean Multi-Purpose Satellite) spacecraft for
      the rational, targeted use and protection of land resources. Currently, the KOMPSAT-3
      spacecraft provides images over five spectral channels (panchromatic, blue, green, red and
      near infrared) with very high spatial resolution (2.8 m in multispectral mode and 0.7 m in
      panchromatic mode).
          Using satellite images of very high spatial resolution KOMPSAT-3, were created
      agricultural maps of 1: 10000 scale of Tashkent, Bukhara, Andijan, Ferghana and other
      regions by the State Unitary Enterprise Geoinformkadastr under the the Committee.

                                                        2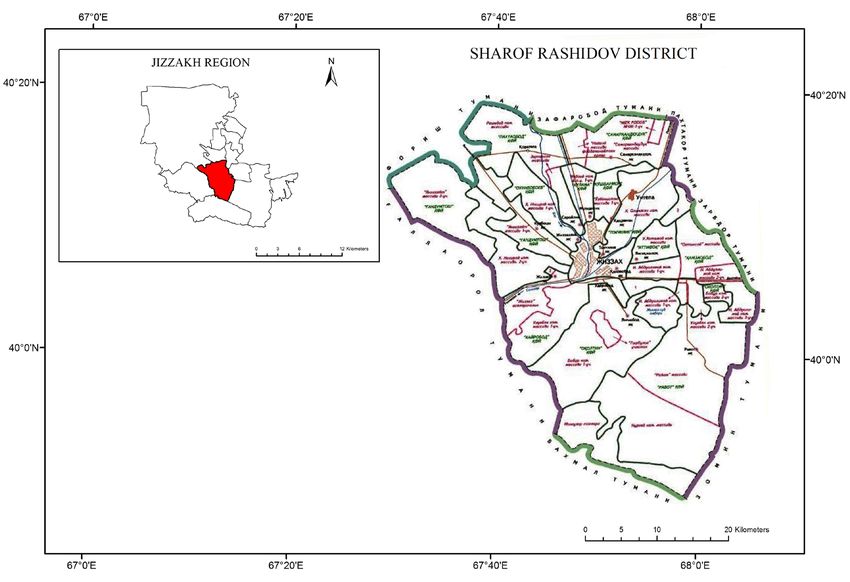
E3S Web of Conferences 227, 03002 (2021) https://doi.org/10.1051/e3sconf/202122703002
GI 2021
To creation map of agricultural land users for the area of study, satellite images of
KOMPSAT-3 with very high spatial resolution with an ortho-ready level were used.
Orthophotoplan generation from the satellite images was performed in the following order:
• reconnaissance of the area of study and determination of the location of ground
control points (GCP);
• determine the coordinates of the GCP;
• photogrammetric processing of satellite images in a special software product.
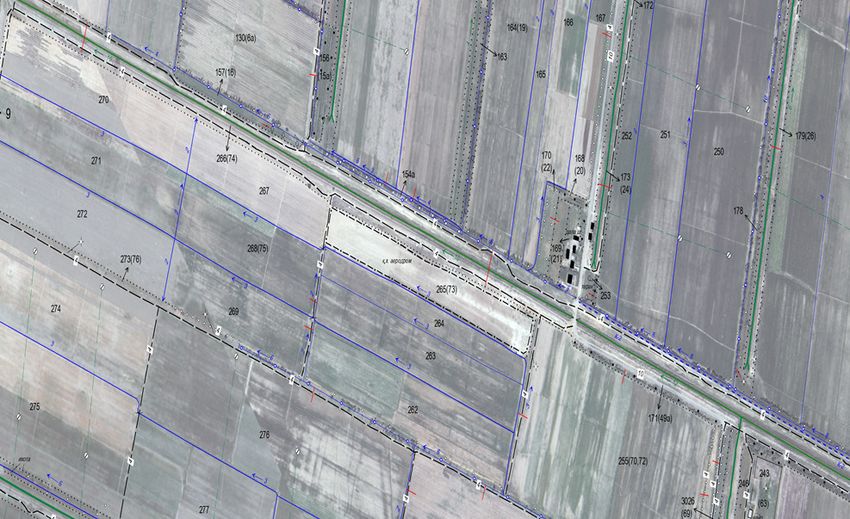
To georeferencing satellite images, 6 triangulation points and 21 additionally defined
control points were used (Figure 2). Geodetic measurements were performed with a Stonex
S9 III PLUS GNSS receiver in RTK mode.
Fig. 2. Scheme of location of the GCP.
3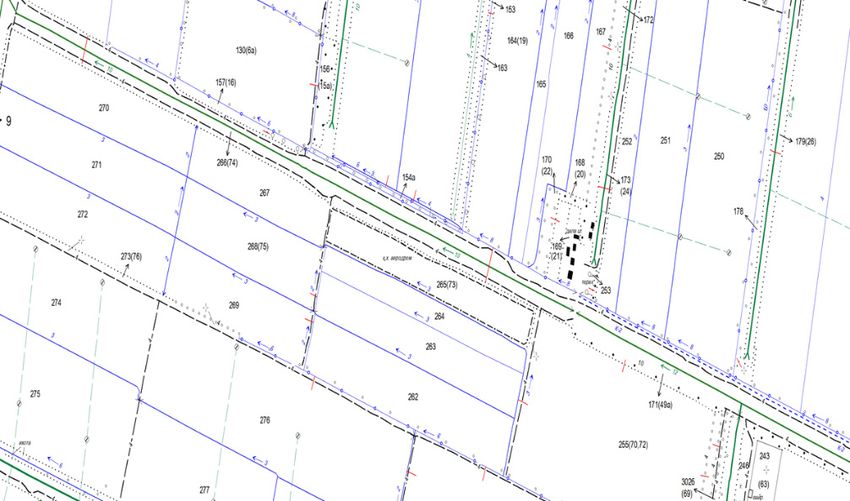
E3S Web of Conferences 227, 03002 (2021)                        https://doi.org/10.1051/e3sconf/202122703002
GI 2021

          The generation orthophotoplan using the coordinates of ground control points and the
      satellite images with the ortho-ready level was performed by the PHOTOMOD digital
      photogrammetric station in PhotoMOD Lite 6. 2 software package in the following order:
          • determination of the location of control points in satellite images;
          • photo triangulation;
          • satellite image orientation;
          • orthomosaic generation;
          • orthophotoplan generation.
          The last and complex step in creating the large scale map of the study area is the
      interpretation of satellite images. Interpretation of satellite images was carried out strictly in
      accordance with special instructions [10]. In the process of interpreting remote sensing
      materials, terrain objects were identified and marked with appropriate symbols.
      Interpretation or analysis of remote sensing data was carried out by visual method. At the
      same time, terrain objects, the reliability and correspondence of which are beyond doubt,
      were interpreted from space images using the Panorama 11 program of the Racurs
      company, and terrain objects that could not be identified by space objects were identified
      directly in the field. It should be noted that one of the most important objects of
      interpretation is the boundaries of land use and land ownership, settlements and lands of the
      state reserve. Boundaries, in terms of interpretation, refer to special objects.

      3 Results and discussions
          As a result of interpretations of satellite imagery, the location of agricultural lands,
      boundaries of land users, their areas and other natural and artificial objects was determined
      (Figure 3) and a map of land users in agriculture was created (Figure 4).

      Fig 3. Fragment of the 1:10000 scale agricultural map.

                                                       4
E3S Web of Conferences 227, 03002 (2021) https://doi.org/10.1051/e3sconf/202122703002
GI 2021
Fig 4. Fragment of the interprated orthophoto.
Such large-scale maps, which graphically represent information about the boundaries of
land users and land uses (land tenure) and other real estate on land, as well as data on the
actual use of land, are usually included in the group of cadastral maps and serve as the
spatial basis for the formation of the cadastral database. They can serve to solve the
following tasks:
• demonstration of natural features and the current state of land;
• displaying the structure of land holdings and their reclamation status;
• display of factors of negative anthropogenic, including technogenic, impact on the
state of land;
• improving the accuracy of determining the boundaries and calculating the area of
land;
• transition to new technologies and methods for studying and mapping lands;
• provision of detailed information in order to ensure the rational use and protection of
land, the efficiency of land management [11].
Such maps serve as a topographic basis for creating maps of special content (soil,
geobotanical, hydrogeological, underground communications, etc.).
4 Conclusions
The technology for creating land user maps in agriculture using very high-resolution
satellite imagery was considered on the example of the study area - Sharof Rashidov
district, Jizzakh region. Thanks to the use of ortho-ready satellite imagery of the
KOMPSAT-3 spacecraft with a very high spatial resolution, it significantly reduced the
time for photogrammetric processing, and the main attention was paid to the work on image
interpretation. A large scale map of land users provides real information on the state of land
used in agriculture, which subsequently serves as the basis for creation soil salinization
maps, identifying factors affecting soil fertility, and developing important measures to
address them.
5E3S Web of Conferences 227, 03002 (2021) https://doi.org/10.1051/e3sconf/202122703002
GI 2021
References
1. “National report on the state of land resources of the Republic of Uzbekistan”,
“Davyergeodezkadastr”, Tashkent, Uzbekistan, (2019)
2. N. Stupen, M.Stupen, O.Stupen, “Electronic agricultural maps formation on the basis
of GIS and earth remote sensing”, Sci. Pap. Ser. Man. Eco.Eng.Agr. Rur. Dev, vol. 18,
no.4, pp. 347-352, (2018)
3. I.Rodin, “Analysis and preparation of RS data from open sources for precision farming
systems”, Sci. Tech. J. Geod. Cartog. Nav "Geoprofi", Vol. 6, pp. 16-19, (2018)
4. V. Lebourgeois, S. Dupuy, É. Vintrou, M. Ameline, S. Butler and A. Bégué, “A
Combined Random Forest and OBIA Classification Scheme for Mapping Smallholder
Agriculture at Different Nomenclature Levels Using Multisource Data (Simulated
Sentinel-2 Time Series, VHRS and DEM)”, Rem. Sen. Op. Acc. J, Vol. 9, no.3, pp. 1-
20, (2017)
5. E. Bello, N. Chigbu, I. Agbaje, “Large scale mapping: an empirical comparison of
pixel-based and object-based classifications of remotely sensed data”, South Afr. J.
Geo, Vol. 6, no.3, pp. 277-294, (2017)
6. M. Gianinetto, “Updating Large Scale Topographic Databases in Italian Urban Areas
with Submeter QuickBird Images”, Int. J. Nav. Obs. Vol. 2008, pp. 1-9, (2008)
7. W. Teijun, “The capability of IKONOS images for 1:10000 mapping informatsion
China”, Master Thesis, (2005)
8. Presidential Decree No. UP-5065 “On measures for strengthening control over
protection and rational management of land, improvement of geodetic and
cartographic activity, regulating keeping state cadastre and state registers”, (Date of
text: 31 May 2017)
9. Presidential Decree No. PP-4709 “On additional measures for specialization of the
regions in the production of agricultural commodities”, (Date of text: 11 May 2020)
10. (8) Instructions for interpretation aerial images and photoplans at scales of 1: 10,000
and 1: 25,000 for the purposes of land management, state land registration and land
cadastre, (1978)
11. E. Pokhorova, “Socio-economic maps”, (2018)
6You can also read