WILDFIRES AND HURRICANES INDEMNITY PROGRAM - UF/IFAS John VanSickle, Professor Food & Resource Economics Department
←
→
Page content transcription
If your browser does not render page correctly, please read the page content below
Food and Resource
                   Economics

WILDFIRES AND HURRICANES
   INDEMNITY PROGRAM
      John VanSickle, Professor
     Food & Resource Economics
            Department
              UF/IFAS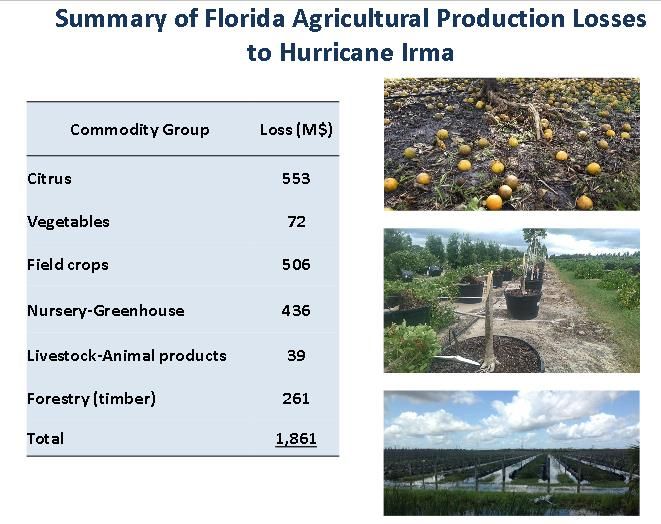
WHIP Assistance:
Available to eligible producers for crops, trees, bushes,
and vines, which suffered a qualifying loss because of
the consequences of Hurricanes Harvey, Irma, Maria,
and other hurricanes and wildfires occurring in
calendar year 2017, as implemented by decision of the
Secretary of Agriculture.
Congress appropriated more than $3 billion for this
program.
Loss includes:
     • Production losses from eligible crops
     • Inventory losses for value loss crops
     • Tree/Bush/Vine Loss

 2
                           Food and Resource
                             Economics
2017 Disaster Overview
• 2017 was the costliest disaster year on record in the U.S. with damage
from disaster events culminating in losses exceeding $300 billion (National
Oceanic and Atmospheric Administration).
• Losses in 2017 alone account for 20% of cumulative losses estimated
since NOAA records on billion-dollar disaster events began in 1980.
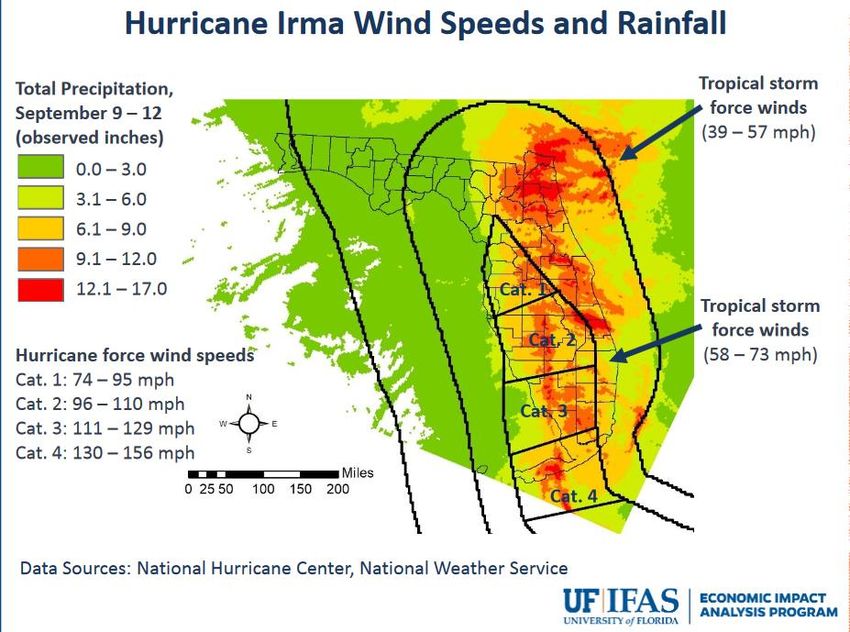
• Most of the 2017 losses (over 85%) were the result of three hurricanes
that struck the U.S. and U.S. territories: Harvey (Houston), Irma (Puerta
Rico), Maria (Florida).
• Thirteen other disaster events, including wildfires, severe storms,
drought, inland flooding, and freeze events each accounted for losses in
excess of $1 billion as well.
• Losses and damages from disaster events effect every facet of the
U.S.: communities, homes/businesses, natural resources, and agricultural
(crops, livestock, and timber).
Food and Resource
Economics
Food and Resource
  Economics
Source: Court and Hodges

                           Food and Resource
                             Economics
Source: Court and Hodges
Food and Resource
EconomicsAgricultural Economic Impacts
from IRMA
County Field Crops Citrus Vegetables & Nursery & Total
crops Other Fruits Floriculture
Palm 194,781 0 31,765 21,158 247,704
Beach
Hendry 64,198 161,271 5,629 5,243 236,342
Dade 2,048 1,135 35,687 116,256 155,130
Polk 126 89,820 1,461 4,332 95,739
Highlands 1,855 57,620 0 6,160 65,635
JACKSON 8,148 0 325 14 8,487
Florida 348,827 490,244 151,150 322,532 1,312,753
(Values in $1,000)
(Jackson County also had $16,524,000 in timber losses, second only to Taylor County
with losses of $26,311,000)
Food and Resource
EconomicsWHIP Program Coverage
Wildfire Recovery – any crop, tree, bush or vine damaged by a
2017 wildfire
Hurricane Recovery – Any crop, tree, bush or vine located in a
county or parish identified by Presidential Declaration is eligible for
2017 WHIP if caused by 2017 hurricane.
Citrus Growers in Florida – Eligible for 2017 WHIP for losses in
2018. FSA will also reimburse citrus growers for cost of buying and
planting replacement trees, including resetting and grove rehab,
and for repair to irrigation systems. It also provides assistance for
citrus production losses expected in 2019 and 2020 crop years.
8 Food and Resource
EconomicsInsurance Coverage Determines
WHIP Coverage Factor
Insurance Coverage level WHIP Factor
Uninsured 65%
CAT or NAP Basic 50/55 70%
WHIP % 50% -Calculation for Production Loss
Acres ( times )
Expected Value
Price = WHIP Value
minus
Yield
WHIP %
times Share times Payment Factor
minus
Actual Value
Production
Price minus
and/or
Indemnity
Secondary /
equals
Salvage
WHIP
Payment
10Forms producer must complete: FSA-890 – WHIP Application Form- County Office Generated FSA-891 – Crop Insurance and/or NAP Coverage Agreement FSA-892- Exemption for Payment Limitation CCC-902 – Farm Operating Plan of Operation- County Office Generated FSA-578 – Report of Acreage- County Office Generated AD-1026 – Highly Erodible Land Conservation and Wetland Conservation Certification SF-3881- Schedule of Direct Deposit FSA-893 - 2018 Citrus Actual Production History and Approved Yield Record- if applicable. Note: Other forms may be applicable 11
Linkage Requirements
As a condition of maintaining eligibility for
WHIP benefits, producers are required to
purchase crop insurance, or NAP as applicable,
on the crop, tree, bush, or vine for the next
two consecutive available crop years after the
2017 WHIP enrollment period ends and ending
with the 2021 crop year.

 12
Linkage Requirements
Insurable Crops, Trees, Bushes, and Vines
 obtain crop insurance at a level of 60/100 or
  equivalent, if available
NAP Crops
 obtain NAP coverage at a level of at least 60/100,
  if available, including filing annual acreage
  report
 Purchase Whole Farm Revenue Protection
  (WFRP)

 13
Eligibility and Payment Limitation
Adjusted Gross Income (AGI) Provisions
      • Not Applicable to WHIP

Payment Limitation:

      • $125,000

      Or

      • $900,000 – If 75% of adjusted gross income is
        derived from farming, ranching, or forestry.

 14
Optional $900,000 Payment
Limitation Provisions
Requirements:
• Prove 75% of their adjusted gross income
(AGI) is derived from:
• Farming
• Ranching
• Forestry
• Based on an average of taxable years:
• 2013, 2014 and 2015
15Optional $900,000 Payment
Limitation Provisions
Requirements cont’d:
• Complete FSA-892 Request for an Exception
to the WHIP Payment Limitation of
$125,000.
• CPA or Attorney Certification of
compliance:
• Completing Part C of the FSA-892
• Providing similar statement acceptable to FSA
16Optional $900,000 Payment
Limitation Provisions
FSA-892 Request for an Exception to the WHIP
Payment Limitation of $125,000:
• Optional to all Applicants:
• Persons
• Legal entities
• Interest holders in a legal entity, including
embedded entities to the 4th level of ownership.
• Members of a general partnership or joint
venture.
• Native Americans or Tribes represented by BIA
17Optional $900,000 Payment
Limitation Provisions
Defines Income from farming, ranching or
forestry:
18Optional Payment Limitation
Example :
Ewing General Partnership has a calculated WHIP payment of
$2,500,000
Ewing General Partnership - No Payment Limitation Value
• J.R. Ewing 75% interest - $900,000 optional payment limitation
• Bobby Ewing 25% interest - $900,000 optional payment
limitation
Ewing General Partnership Net Payment = $1,525,000
• J.R. Ewing = (75% x $2,500,000 = $1,875,000) $900,000
• Bobby Ewing = (25% x $2,500,000 = $625,000)$625,000
19Optional Payment Limitation
Example 2:
I Grow Crops Inc. WHIP payment = $900,000
I Grow Crops Inc - $900,000 Optional Payment Limitation
• Member A – 1/3 interest - $900,000 Optional Payment Limitation
• Member B – 1/3 interest - $900,000 Optional Payment Limitation
• Member C - 1/3 interest - $125,000 Basic Payment Limitation
I Grow Crops Inc Net Payment = $725,000
• Member A thru I Grow Crops Inc = $300,000
• Member B thru I Grow Crops Inc = $300,000
• Member C thru I Grow Crops Inc = $125,000
20Acreage Reporting
Producers will need to provide the following
information when applying for WHIP on trees
bushes or vines:
Tree Count by Crop, Crop Type
Spacing
Date planted
21Tree Spacing Example
A producer reports 6,894 trees planted in
1995 with 25 ft. row spacing x 12.5 ft. tree
spacing.
The producer also reports 9,467 trees
planted in 2014 spaced 25 ft. x 9 ft.
All trees are interplanted in a 100 acre grove.
22Tree Spacing Example (cont.)
Calculations:
• Subfield 1A:
‒ 43,560 sq. ft. per ac. ÷ (25 ft. between rows ×
12.5 ft. between trees) = 139.39 trees/ac.
‒ 6,894 trees ÷ 139.39 trees/ac. = 49.46 acres
• Subfield 1B:
‒ 43,560 sq. ft. per ac. ÷ (25 ft. between rows × 9
ft. between trees) = 193.6 trees/ac.
‒ 9,467 trees ÷ 193.6 trees/ac. = 48.90 acres
23Determining Eligible Acreage
Eligible Acreage Data Sources for the year of
loss
Type of Crop Data Source
Insured Crops Acreage data will be provided by
insurance and compared to FSA-578
Uninsured Crops Acreage data will be obtained from
FSA-578
– For insured crops if there is a difference between data, use
the lesser of insurance or FSA acres
24Units
Units
– Insured crops will use insurance units
– Uninsured crops will have units established
according to share relationship
25Yields
APH/Approved Yield Data for Production
Based Crops
IF the yield is THEN the yield is……
for…..
Insured • provided by RMA, if available
• the County Established Yield established if
yield is unavailable from RMA
NAP Covered a NAP approved yield
crops
Uninsured crops County Expected Yield
Florida citrus Up to five years of historical production records
crop provided
26Florida Citrus Yield Provisions WHIP payments for most crops will be determined either by the insurance data or the county average yield for uninsured applicants. Due to the type of insurance policies administered in the State of Florida for citrus, participants will be permitted to prove their yield using the last five crop years. 27
Florida Citrus Yield Provisions
Participants will certify yields on an FSA- 893
by providing up to five years of production
harvested and acres grown.
• Records obtained are not required to be
   maintained in the CO because this is a
   certification.
• COC has the authority to monitor and
   question any yields that appear to be
   inconsistent with other participants.
            28
Florida Citrus Yield Provisions
When participants provide yields and
acreage they must be for continuous
years.
29Florida Citrus Yield Provisions
If a participant did not own the grove for the
entire five year history, COC has authority to
allow participants to provide production
records for previous year’s owner(s) up to the
five years allowed.
COC will review documents provided for proof
of production and acres grown of previous
owner(s).
30Florida Citrus Yield Provisions
Calculating Yields
Participants will certify production harvested
and acres grown for the previous 5 crop years.
A simple average will be calculated to
determine the yield that will be used in the
WHIP calculation.
31Florida Citrus Yield Provisions
If the participant purchased the grove in 2017,
prior to the qualifying disaster event and
previous year’s production are not available
from prior owners of the grove, then the
participant would be eligible; however, the
county average yield would be used as the
yield for the WHIP calculation.
32Price WHIP price will be based on: • RMA price, if available – Contract price • NAP average market price • Direct market prices do not apply 33
Preliminary Jackson Co. Prices

WHIP price will be :

• Cotton $0.73/#
• Peanuts
      – Runners $0.1977/#
      – VIR     $0.2194/#
• Peas $0.9567/#
• Soybeans $10.26/bu
• Tomatoes $6.20/ctn

 34
Harvested Production
Harvested production is:
The total amount of harvested production for
the unit supported by an acceptable record
and/or certification by the producer.
Note: Production from all harvests of an
eligible crop harvested more than once
in a crop year will include TOTAL
harvested production from the entire
crop year.
35Producer Responsibilities Producers must provide accurate and complete acreage and production reports for all WHIP eligible crops on a unit. Producer’s signature on FSA-890 is the producer’s certification that the records provided are correct and includes TOTAL crop production for the unit 36
Acceptable Production Records
Acceptable production records include:
 • Verifiable records
 • Reliable records

 37
Acceptable Production Records
Verifiable Records:
 • May be verified by FSA through an
   independent source
 • Are used to substantiate the amount of
   production reported
      – Dated
      – Show quantity, price, and final disposition
      – Seasonal or crop specific for commodities
        produced more than once in a calendar year

 38
Acceptable Production Records Examples of Verifiable records: • Sales receipts from buyers • Settlement sheets • Invoices from custom harvesting • Truck or warehouse scale tickets 39
Acceptable Production Records
Reliable records are:
Records provided by the producer that County
Office Committee determines are adequate to
substantiate the amount of production
reported when verifiable records are not
available.

 40
Acceptable Production Records
Examples of Reliable records:
 • Ledgers of commodity sales volume/income
 • Income statements of deposits
 • Records to verify production input costs
 • Producer diaries, ledgers, receipts
 • Pick records
 • Other USDA program data

 41
COC Responsibilities
If County Office Committee cannot determine
the records are verifiable or reliable, the
higher of the following will be used:
• Producer’s certified production
• Assigned production using the Florida State
  Committee approved County Disaster Yield

 42
County Disaster Yield
County Disaster Yields (CDY) defined as:

The average yield per acre for a county or
area of a county for the current year based on
disaster events, and is intended to reflect the
amount of production that a participant
would have been expected to produce based
on the eligible disaster conditions in the
county or area.

 43
County Disaster Yield

The only time the CDY will be used if there are
no other production records, verifiable or
reliable, available.

 44
Example 1 - SCENARIO
     • Adam Orange from Hendry County, Florida
       had a loss on his 2018 Naval Oranges due
       to Hurricane Irma that occurred
       9/10/2017 through 9/13/2017.
     • His 50 acres of naval oranges were
       insured.
     • The production to count was 3,028 boxes
       and his approved yield that came from the
       FSA-893 was 242.4.

45
Example 1 – DATA ELEMENTS
• Other data elements needed are:
‒ Coverage Level = 75%
‒ Price Election = 100%
‒ WHIP Factor = 90%
‒ Unharvested Payment Factor = 100%
‒ Indemnity = $32,412
‒ Price = $12.74
‒ Guarantee Adj. Factor = 100%
46Calculation for Production Loss
Acres ( times )
Expected Value
Price = WHIP Value
minus
Yield
WHIP %
times Share times Payment Factor
minus
Actual Value
Production
Price minus
and/or
Indemnity
Secondary /
equals
Salvage
WHIP
Payment
47WHIP Value
Acres
Expected Value
Price
Yield 50 x $12.74 x 242.4=
WHIP % (Acres) (Price) (Yield)
154,408.80 x 90% = $138,967.92
(Expected Value) (WHIP Factor) (WHIP Value)
48Actual Value
3028 x $12.74= $38,576.72
Actual Value
Production
(Production) (Price) (Actual Value)
Price
49WHIP Calculation
WHIP Value $138,967.92
Expected Value
minus
WHIP % times Share 100% times Payment Factor 100%
minus
Actual Value
minus
Indemnity and/or
Secondary /
Salvage
equals
50$12 billion Tariff Aid Program
1. FSA - Market Facilitation Direct Payments
- Soybeans, sorghum, corn, wheat, cotton,
dairy and hogs
2. AMS - Food Purchase and Distribution
Program – fruits, nuts, rice, legumes, beef,
pork, and milk
3. FAS - Trade Promotion Program
51Food and Resource
Economics
WILDFIRES AND HURRICANES
INDEMNITY PROGRAM
John VanSickle, Professor
Food & Resource Economics
Department
UF/IFASYou can also read