COVID-19 Current State Analysis and Forecasting for the DFW Region - Department of Internal Medicine Lyda Hill Department of Bioinformatics ...
←
→
Page content transcription
If your browser does not render page correctly, please read the page content below
COVID-19 Current State Analysis and
Forecasting for the DFW Region
Department of Internal Medicine
Lyda Hill Department of Bioinformatics
Department of Emergency Medicine
UTSW Health System Information Resources
Updated October 8 with data as of October 6
About the Model

    The following slides illustrate a model of how COVID-19 is spreading
    across the DFW region based on real patient data we have received from
    Collin, Dallas, Denton and Tarrant counties. The slides capture a snapshot
    based on data available as of October 6. Every time we receive new data,
    we re-run the model and refine the graphs.

    In the following slides we examine how well preventive measures including
    masking, staying at home, social distancing, hand hygiene and others
    have limited the spread of infection, and what might happen looking
    forward.

    Model-building is an iterative process with inherent uncertainty in its
    predictions. It is intended to provide help in formulating plans but should
    not be the sole basis for policies or management decisions addressing the
    COVID-19 challenge. Please do check back every few days to see how
    well the DFW region is doing to keep COVID-19 at bay.

    We would like to thank the local health departments, hospitals, and health
    systems that have contributed data to help us build this model.
2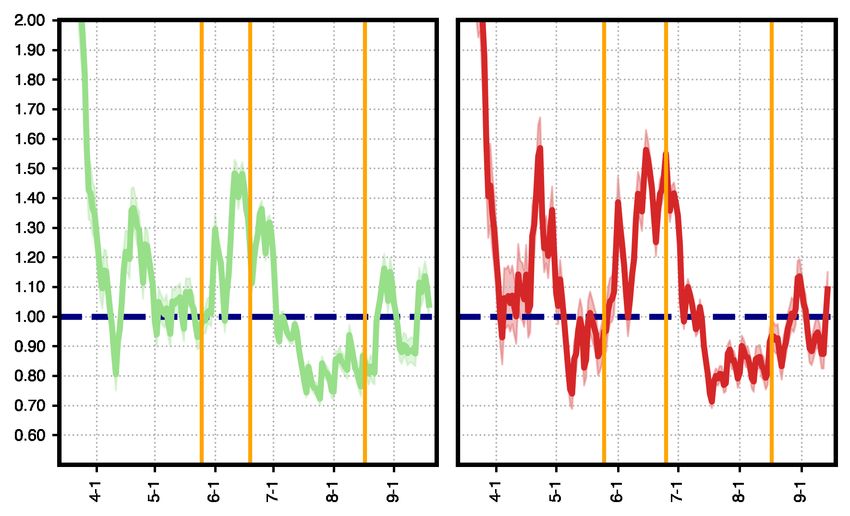
Updated 10/8/20

        Commentary

Hospitalizations in North Texas are on the rise again. The average volume for the past week was
33% higher than the most recent weekly-average low 16 days ago and 39% higher than the average
volume in May. The hospitalization reporting error mentioned in our last update has been corrected,
and this update reflects the revised hospitalization data for Dallas and North Texas, as well as a
revised forecast based on these data. In Dallas and Tarrant Counties, both hospitalizations and the
number of patients in the ICU are projected to increase over the next two weeks. Both counties are
expected to return to mid-August levels of hospitalizations over the next two weeks.

Of concern, the Rt value both in Dallas and Tarrant Counties climbed above 1 in mid-September.
Also, the test positivity rate, which had been falling since its peak in early July, has stopped
declining.

The spread of disease is now more even among different age groups compared to the end of
August, when it was spreading largely in younger age groups. The potential impact of school
openings is built into the model, and this impact will continue to be revised as we learn more about
its effect on local case counts and hospitalizations. As we head deeper into the fall and winter
seasons, the community’s continued compliance with physical distancing, masking, hand hygiene,
and crowd management policies are especially needed to ensure healthcare capacity remains
available.

It is important to remember that people arriving at the hospital today were likely infected ~2 weeks
ago. Our collective actions now are critical to changing the course of the outbreak in North Texas.

    3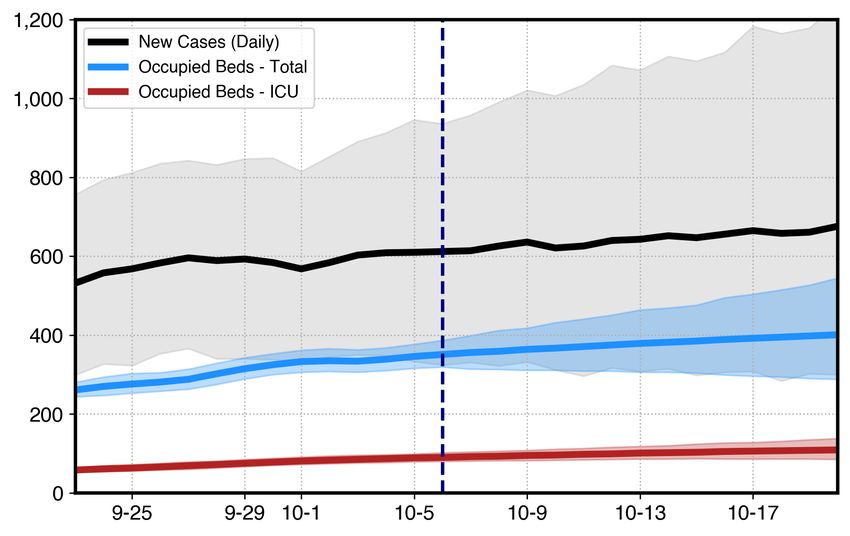
Updated 10/8/20 with
                                                                                                         data available 10/6/20
      Cases of COVID-19 and those that require
      hospitalization are increasing in North Texas
          Percent positive COVID-19 tests in                        Confirmed COVID-19 Patients in North Texas Hospitals
               Dallas County Hospitals                              2,500
35%

30%                                                                 2,000

25%
                                                                    1,500
20%

15%                                                                 1,000

10%
                                                                      500
5%

0%                                                                        -
        ay

        ay

        ay

         ul

         ul
        un

        un
          r

         g

         p
        pr

        ug

        ep
      Ap

      Au

      Se

                                                                                              ct
                                                                                             ug

                                                                                             ug

                                                                                             ep
                                                                         ay

                                                                                             un

                                                                                             un

                                                                                              p
                                                                                              ul

                                                                                              ul
                                                                                              n
                                                                                 ay
      -J

      -J
     -A

     M

    -M

    -M

    -A

    -S
     -J

     -J

                                                                                           Se
                                                                                           Ju
   4-

                                                                                           O
  11

  25

                                                                                           -J

                                                                                           -J
   8-

   5-

                                                                        M
  2-
  18

                                                                                -M
 13

 27

                                                                                          -J

                                                                                          -J

                                                                                         -A

                                                                                         -A

                                                                                         -S
 22

 19
 16

 30

                                                                                        6-
                                                                                       2-

                                                                                       14

                                                                                       28

                                                                                       8-
                                                                      5-

                                                                                      16

                                                                                      30

                                                                                      11

                                                                                      25

                                                                                      22
                                                                              19
                                                                   Hospitalizations have increased 15% compared to one
       11% of COVID-19 tests performed in                            week ago and 33% compared to two weeks ago.
      Dallas County hospitals were positive in
        the week ending in September 26.                            The previous error in hospital volumes for August and
                                                                     September has been corrected in the graph above.

          Source (left): Dallas County HHS 10/6 report, data as of 9/26
      4   Source (right): NCTTRAC EMResource Data, Accessed 10/6/2020
          “North Texas” is defined as Trauma Service Area E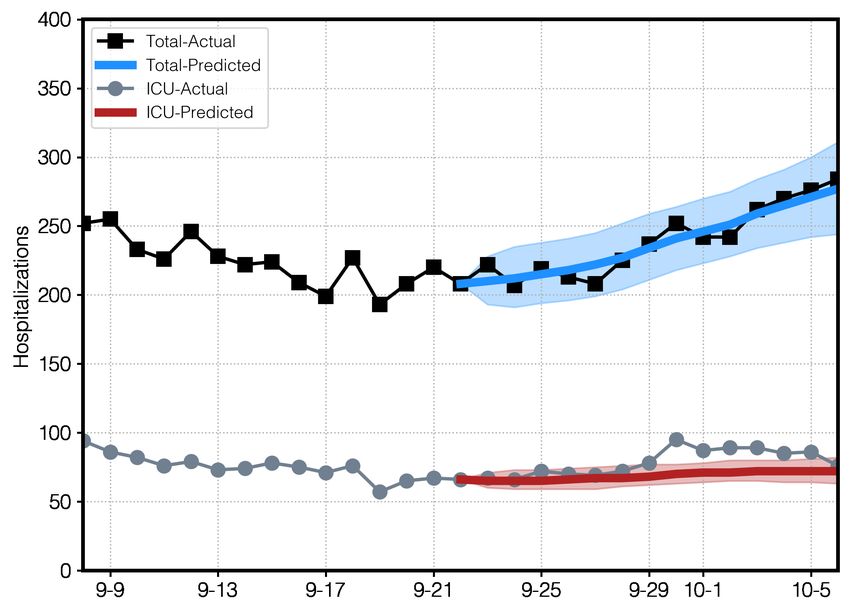
Updated 10/8/20 with
                                                                                                                                data from 10/6/20
How many people with COVID-19 have been hospitalized
in Dallas and Tarrant Counties in the past three months?
Total Hospitalized COVID-19+ Patients in Dallas County                                 Total Hospitalized COVID-19+ Patients in Tarrant County

                                                                          ICU            Non-ICU

We closely track daily COVID-19 hospitalizations, as this indicator reliably monitors the severity of the
outbreak in DFW. Hospitalizations trail new infections by 1-2 weeks but are not influenced by testing
capacity or test reporting delays, thus giving us a clear picture of severe cases in the community.

      Source: NCTTRAC Summary EMResource Data, Accessed 7/21/2020 for data through 7/21
  5           NCTTRAC Executive Summary – Hospital Occupancy Data daily snapshots for data through 7/25-10/6
      Missing values for 7/22-7/24.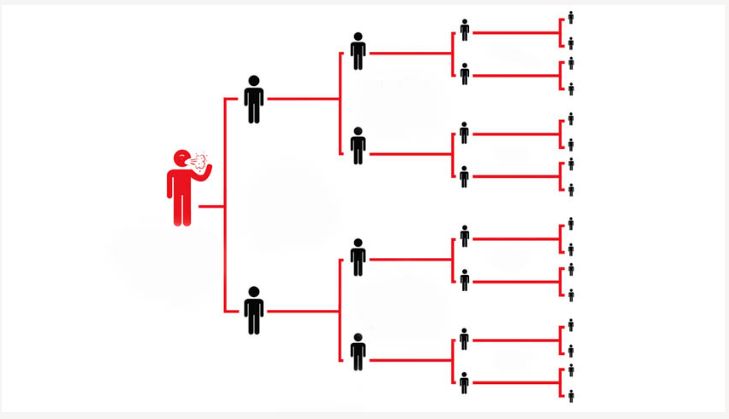
Rt Represents Contagiousness

  § Rt helps us measure how effective
  social distancing measures are after
  they are put into place.

  § If social distancing and measures like
  masking are effective, then the number
  of secondary infections is dramatically
  reduced.

  § In this scenario where social
  distancing measures were 50%
  effective, then only five people end up
  infected, rather than the original 31.
Updated 10/8/20 with
                                                                                                                                                                                                    data available 10/6/20*

   How Contagious is COVID-19 in DFW Now?
                                         Dallas                                                                                  Tarrant*
                         Memorial                      Mask                                                      Memorial                         Mask
                            Day                        order put                                                    Day                           order put
                                                       into place                                                                                 into place

                                                               Colleges                                                                                Colleges
                                                                reopen                                                                                  reopen

Rt                                                                                                                                                                                            Epidemic grows/
                                                                                                                                                                                              persists above this line

                                                                                                                                                                                              Epidemic declines
                                                                                                                                                                                              below this line

This line represents how contagious COVID-19 has been in Dallas and Tarrant County over the last few weeks. Contagiousness
depends on how well we social distance, wear masks, limit travel, clean high touch surfaces, etc.

The Rt value has been hovering around 1 in Dallas and Tarrant Counties since late August. We now calculate this value using the
date positive tests were collected rather than the date they were reported, since the tests reported on a given day were collected
over many different days. Historical data points are subject to revision and only include PCR confirmed COVID-19 infections.
*Data from Tarrant County is made available less frequently, so its Rt estimate was made with data available as of 9/21.
          Source: Dallas County HHS, Accessed October 6, up to specimen collection date of 9/24; Tarrant County PH, Accessed September 21; data for positive tests with a specimen
          collection date of 9/14 or earlier
      7   1) Cori, A. et al. A new framework and software to estimate time-varying reproduction numbers during epidemics (AJE 2013).
          2) Assumes serial interval follows gamma distribution as calculated in Nishiura, et al . "Serial interval of novel coronavirus (COVID-19) infections." Int J Infect Dis. 2020 Mar
          4;93:284-286. doi: 10.1016/j.ijid.2020.02.060.
Updated 10/8/20 with
data available 10/6/20
Are North Texans on the move?
Non-Essential Retail Visits Encounter Rate Difference* Difference in Distance Traveled
More
movement
Less
movement
To measure if residents are compliant with physical distancing, we use proxy measures for mobility.
Three measures we follow are shown above, all three of which recorded a brief uptick in activity over
Labor Day weekend and again at the beginning of October. Visits to non-essential stores rose throughout
July and has somewhat leveled off. The rate at which people’s phones are uniquely encountering each
other reached a high in early August and has since fallen and leveled off.
*The encounter rate difference is the rate of unique human encounters per km2 relative to the national pre-COVID-19 baseline.
8 Source: UnaCast Mobility Data, showing trailing 7-day averages, accessed October 6, data through October 2.Updated 10/8/20 with
data available 10/6/20
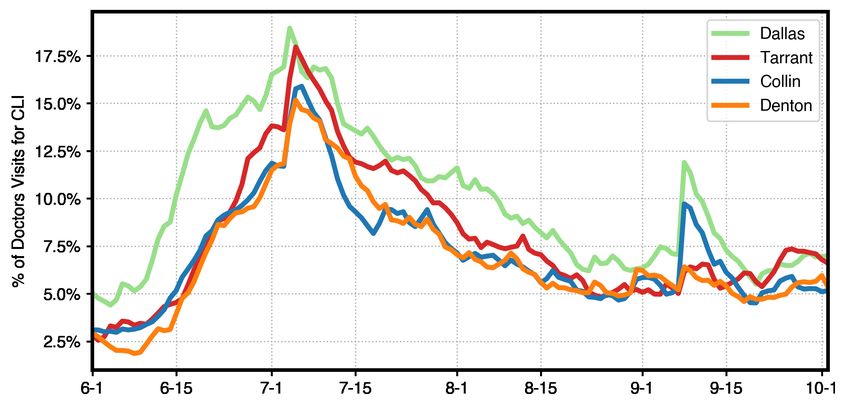
How often are people visiting the doctor for COVID-like symptoms?
Percentage of daily doctor visits for COVID-like symptoms
We are tracking data related to outpatient encounters, as visit to the doctor for COVID-like symptoms
will likely rise ahead of hospitalizations. These visits have decreased since their peak in early July,
and there was a brief spike in early September.
Source: David C. Farrow, Logan C. Brooks, Aaron Rumack, Ryan J. Tibshirani, Roni Rosenfeld (2015).
9
Delphi Epidata API. https://github.com/cmu-delphi/delphi-epidata. Accessed 10/6, data through 10/2.Updated 10/8/20 with
data from 10/6/20
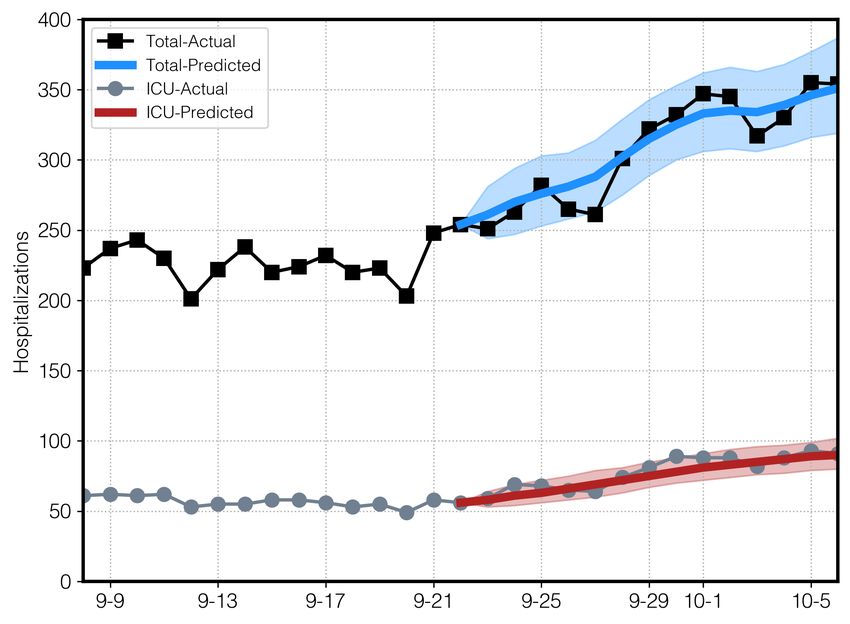
Dallas County – Past Model Accuracy and Future Forecasting
Dallas County 14-day forecast starting Dallas County 14-day forecast starting from 10/6
from 9/22 compared to actual data
Expected Daily New Cases and COVID-19-Occupied Hospital Beds
§ Our current model predicted the past two § Dallas County total COVID-19 hospitalizations (blue
weeks of COVID-19 hospitalizations very well. line) are predicted to increase to 270-530
concurrent hospitalized cases by October 20.
§ Where the reported hospitalizations (black line)
are inside the modeled range (shaded blue § A slightly increasing number of COVID-19 patients
region), and the reported ICU cases (gray line) are predicted to be in the ICU (red line).
are inside the modeled range (shaded red
region) the model accurately predicted § Roughly 1000 new COVID-19 infections (black line)
hospitalizations and ICU cases, respectively. per day are expected by October 20.
This model assumes the combined impact of nonpharmaceutical interventions (NPIs) is 60%.
10
Shaded regions re present 90% credible interval.Updated 10/8/20 with
data from 10/6/20
Tarrant County – Past Model Accuracy and Future Forecasting
Tarrant County 14-day forecast starting Tarrant County 14-day forecast starting from 10/6
from 9/22 compared to actual data
Expected Daily New Cases and COVID-19-Occupied Hospital Beds
§ Our current model predicted the past two § Tarrant County total COVID-19 hospitalizations (blue
weeks of COVID-19 hospitalizations very well. line) are predicted to increase to 300-550 concurrent
hospitalized cases by October 20.
§ Where the reported hospitalizations (black line)
are inside the modeled range (shaded blue § An increasing number of COVID-19 patients are
region), and the reported ICU cases (gray line) predicted to be in the ICU (red line).
are inside the modeled range (shaded red
region) the model accurately predicted § Roughly 700 new COVID-19 infections (black line)
hospitalizations and ICU cases, respectively. per day are expected by October 20.
This model assumes the combined impact of nonpharmaceutical interventions (NPIs) is 69%.
11 Shaded regions represent 90% credible interval.Updated 10/8/20 with
What is the impact of preventative measures on the future data from 10/6/20
spread in Dallas County?
Actual and Predicted Daily New Infections in Dallas County Social distancing & other prevention measures
are currently 60% effective at curbing the spread
58% effective of COVID-19. The resulting Rt decreased slightly
Rt=1.2 from last week, and these small changes can still
lead to significant pressure on cases and
potentially healthcare resources.
§ If measures remain 60% effective, the orange
line will happen.
60% effective
(current § The other lines illustrate what would happen if
impact)
Rt=1.14
measures were 58% effective, 65% effective, or
68% effective.
Our model is optimized to predict hospitalizations.
It is difficult to know the true number of new cases
each day until weeks later due to significant
65% effective delays in the reporting of test results to the county,
Rt=1.0 so this is our best estimate for the current Rt.
Actual
cases 68% effective There are limits to our ability to precisely
Rt=0.9 determine compliance levels with prevention
measures.
Note: model assumes perfect isolation of hospitalized cases, which has a dampening effect on effective Rt
12You can also read


