Hampshire COVID-19 weekly datapack - 16th April 2021 - Produced by the Public Health Team and the Insight and Engagement Unit - Hampshire County ...
←
→
Page content transcription
If your browser does not render page correctly, please read the page content below
Hampshire COVID-19 weekly datapack
   16th April 2021

   Data correct as of 15th April 2021 but subject to revision

Produced by the Public Health Team and the Insight and Engagement Unit
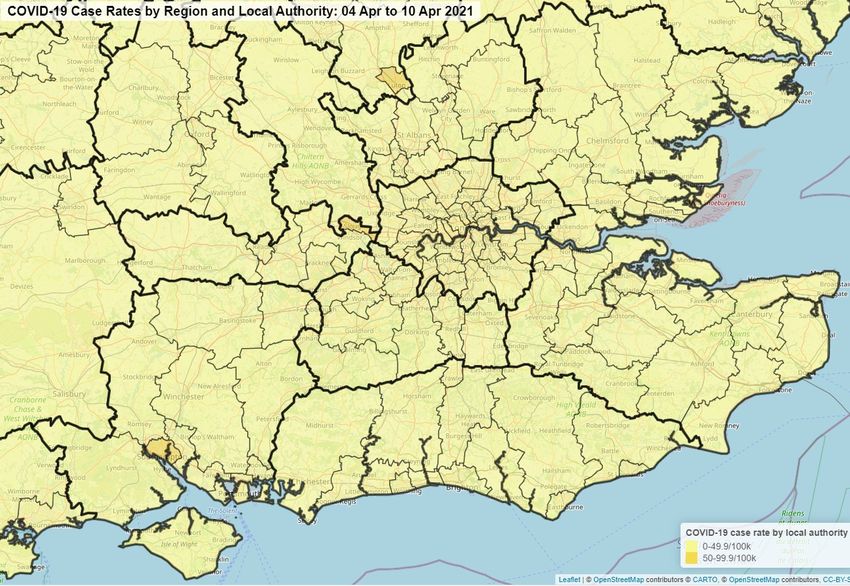
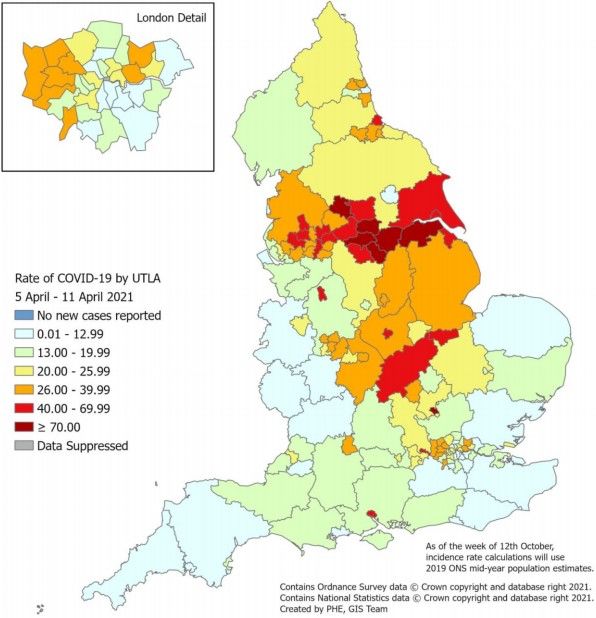
What do weekly case rates per 100,000 population tell us about COVID-19 activity in England?
                 Weekly rate: Week 13, 4th April 2021                                                               Weekly rate: Week 14, 11th April 2021

                                                                                                 Source: Weekly Coronavirus Disease 2019 & Influenza (COVID-19) Surveillance Report
Overall case rates continued to decrease in week 14, with decreases in case rates seen in all age groups, regions and ethnic groups. Overall Pillar 1 and Pillar 2 positivity decreased
slightly compared to the previous week. (Note: the legend definitions have changed between the map for week 13 to week 14.)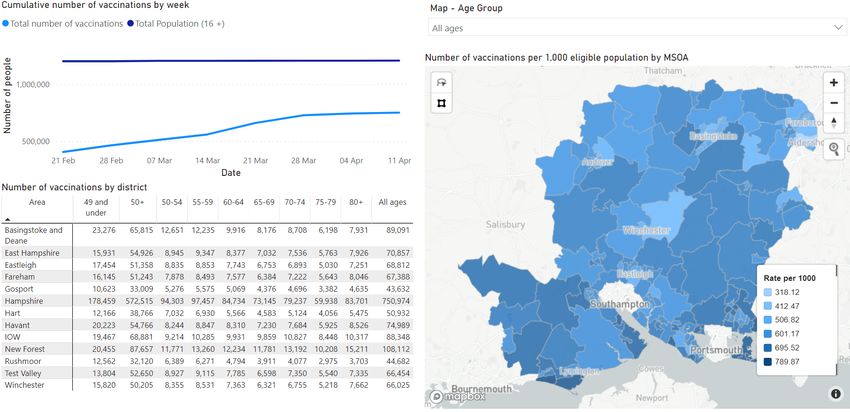
What do weekly case rates tell us about COVID-19 activity across South East regional local authorities?

                                                                                                     Reproduction number (R) and growth
                                                                                                     rate of COVID-19, 10th April 2021

                                                                                                             Source: The R number in the UK

 Case rates across the South East continue to decrease and all now have case rates below 100 per 100,000 population.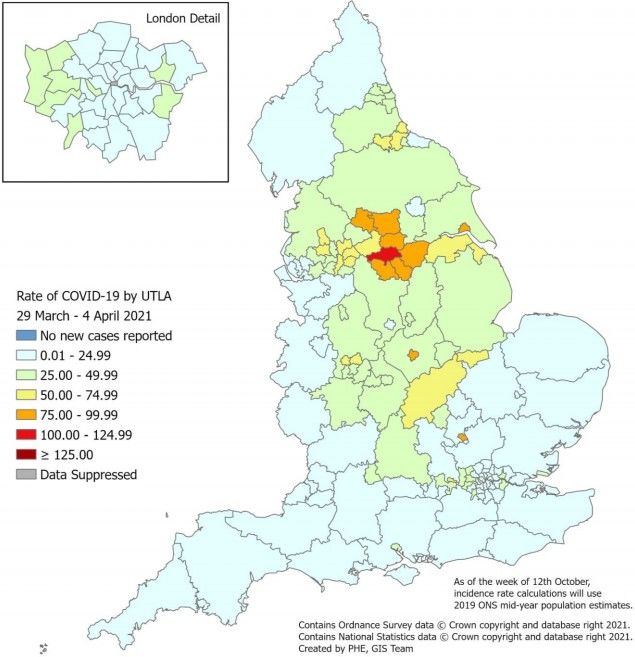
What do weekly cumulative case rates tell us about COVID-19 activity across ceremonial Hampshire?

Trends suggest a slowing in the rise of infection rates across ceremonial Hampshire. Portsmouth City Council authority area has the
highest cumulative case rate as of the 9th April 2021, although it is lower than the England rate.
What do daily cases tell us about how the epidemic is progressing over time in Hampshire?
 During wave 1 only Pillar 1 (NHS/PHE laboratories) testing was available, this included people admitted to hospital and
 later people living or working in a health or care environment. Widespread Pillar 2 community testing (Government's
 commercial testing partners) began on 14th July 2020 and since then the data includes both testing Pillars. Due to these
 different testing strategies, it is not possible to directly compare case numbers between wave 1 and wave 2.                      Caution: There is a data lag with more test results expected for
                                                                                                                                   the most recent week.
                        Data only includes those cases which have tested positive
                                                                                                                        1661 cases

                                                                                                                       386 cases

                                      144 cases                                                                                                                                              Subject to
                                                                                                                                                                                             revision

                                                                                                                            Source: PHE dashboard (Last updated on 14th April 2021)
There is a decrease in daily cases suggesting that the spread of the virus is reducing. Over the epidemic, there have been 63,253 case
detections in Hampshire (as at 14th April).
                                                                                                                                                                  Please note the five-day lag
                                                                                                                                                                  for data quality purposes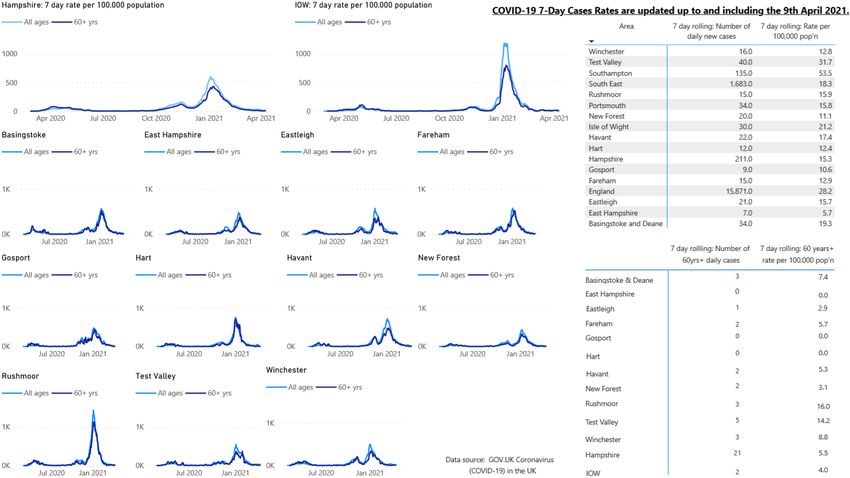
What do weekly COVID-19 case rates tell us about COVID-19 activity across Hampshire Districts?
     7 day case rate per 100,000 for Districts and Unitary Authorities: 4th April to 10th April 2021

                 Further detailed county and district case numbers and rates can be accessed from the Public Health Hampshire Districts COVID-19 Cases and Mortality Report

Case rates continue to decrease across all Hampshire Districts. All other areas in the South East also show decreasing case rates, all
now have a rate below 100 per 100,000.
                                                                                    Please note that these are crude rates and do not take
                                                                                    account of the age/sex/socio-economic/casemix profile of
                                                                                    the district populations. Also, district figures are subject to
                                                                                    large statistical fluctuation due to the smaller populations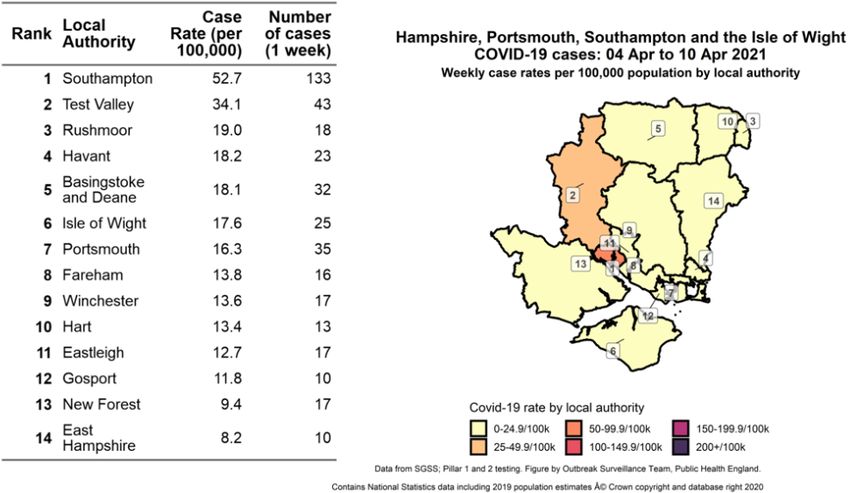
What do the trends in weekly all age case rates tell us about overall COVID-19 activity across Hampshire Districts?
Daily rates of COVID-19 cases per 100,000 population in districts up to 9 th April 2021

                                                                               Data source: PHE Line List data analysis and PHE dashboard (Last updated on 14th April)
Trends suggest a decrease in all age COVID-19 case rate activity across all Hampshire Districts. At 31.7 per 100,000 population, Test Valley had the highest
7-day case rate of all ages and Rushmoor at 16.0 per 100,000 population had the highest rate of over 60 year olds cases on the 9th April 2021.

                                                                                        Please note that the charts on this page show
                                                                                        rates of cases per 100,000. Also, district figures
                                                                                        are subject to large statistical fluctuation due to
                                                                                        the smaller populations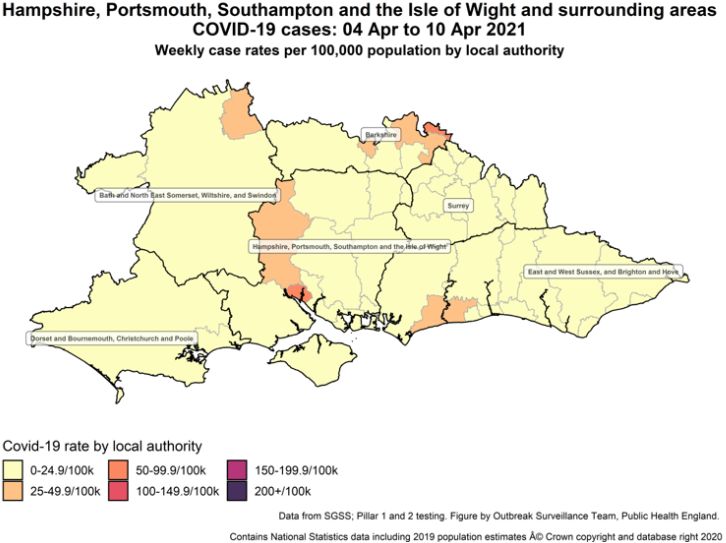
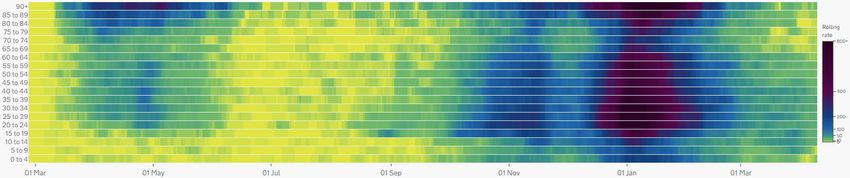
Which age group is most affected in Hampshire?

                  Cases rates continue to decrease across all age groups.
                                                                                                   Source: PHE dashboard (Last updated on 14th April 2021)

                                             Please note that these data are experimental and therefore
                                                                                                                                            8
                                             subject to change
How is the vaccination programme progressing in Hampshire?
Cumulative vaccinations by week up to 11th April 2021

                                                                                                  Source: PHE dashboard (Last updated on 15th April 2021)

                                                        Population for rates: NIMS (National Immunisation Management Service).
                                                        Data Source: Statistics » COVID-19 Vaccinations (england.nhs.uk).                  9
                                                        District data available on the COVID-19 weekly report: Microsoft Power BI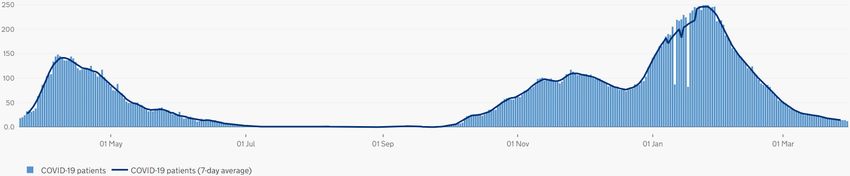
How have weekly COVID-19 cases changed across Hampshire Districts?

                                                 Weekly percentage change, comparing to the previous non-overlapping 7-day period
                          09 April 2021     08 April 2021      07 April 2021      06 April 2021         05 April 2021         04 April 2021                              03 April 2021
England                            -25.1             -30.8              -33.6              -36.5                 -38.4                   -39                                      -32.7

Isle of Wight                       76.5               47.4                     47.4                    41.2                       56.2                    -8.3                   -23.1

Hampshire                          -34.7              -32.6                    -39.2                   -40.3                       -44.6                    -44                   -29.9

Basingstoke and Deane              -24.4              -29.2                    -27.1                   -23.6                       -29.1                  -36.2                   -27.9
East Hampshire                     -53.3              -43.8                    -68.2                   -80.8                         -68                  -54.2                   -37.5
Eastleigh                          -64.4              -59.3                    -54.7                   -52.9                       -48.5                  -41.2                       0
Fareham                            -21.1                  0                    -27.3                   -42.3                       -58.1                  -61.1                   -64.1
Gosport                              -50                -60                    -57.1                     -35                         -30                  -57.7                   -23.8
Hart                               -68.4              -69.2                    -77.8                   -76.5                       -68.6                  -41.9                    -7.9
Havant                              -8.3              -32.3                    -42.4                   -51.4                         -63                  -60.4                   -55.1
New Forest                         -41.2              -34.3                    -39.5                   -28.9                       -30.8                  -41.9                   -29.5
Rushmoor                               0               12.5                    -22.2                   -40.9                       -39.1                  -33.3                   -34.8
Test Valley                          5.3               10.8                     14.7                    12.1                       -13.5                  -11.1                    -2.8
Winchester                         -11.1                5.6                     11.8                    35.7                       -29.2                  -53.6                   -57.6

                                                                                                                                           Data source: https://coronavirus.data.gov.uk

 Overall the cases continue to decrease across Hampshire. At a district level a low number of cases can result in large weekly percentage changes. The Isle
 of Wight has seen increases in weekly infections by 76.5% and Test Valley by 5.3%, although cases numbers remain low. East Hampshire, Eastleigh, Gosport
 and Hart have seen a 50%+ decrease in weekly rates.

                                            Please note that the table on this page shows the percentage change, as a
                                            percentage of the previous non-overlapping seven day count, and factors the
                                            five-day lag for data quality purposes. The change in the seven day count by
                                            district is subject to large statistical fluctuation due to the smaller populations.
What do trends in COVID-19 patients admitted to hospital tell us about healthcare activity across Hampshire?
Hampshire Hospitals NHS Foundation Trust – 13 patients in hospital Portsmouth Hospitals University NHS Trust – 42 patients in hospital
Frimley Health Foundation Trust – 16 patients in hospital University Hospital Southampton NHS Foundation Trust – 24 patients in hospital
Isle of Wight NHS Trust – 3 patients in hospital
Data source: https://coronavirus.data.gov.uk/details/healthcare reported on 8th April March 2021
Overall, trends in new COVID-19 admissions are beginning to decrease, hospital occupancy is now below the wave 1 peak across HIOW trusts.
Please note that the charts on
this page show actual
numbers of hospitalised casesWhat do trends in COVID-19 patients in mechanical ventilation beds tell us about healthcare activity across Hampshire?
Hampshire Hospitals NHS Foundation Trust – 2 patients on ventilation Portsmouth Hospitals University NHS Trust – 4 patients on ventilation
Frimley Health Foundation Trust – 0 patients on ventilation University Hospital Southampton NHS Foundation Trust – 8 patients on ventilation
Isle of Wight NHS Trust – 0 patients on ventilation
Data source: https://coronavirus.data.gov.uk/details/healthcare reported on 8th April 2021
The number of COVID-19 patients in mechanical ventilation beds in critical care units (CCU) across Hampshire has now declined. The need to avoid CCUs
being overwhelmed is a key factor in significant policy decisions, including regional and national ‘lockdowns and service recovery.
Please note that the charts on
this page show actual
numbers of hospitalised casesWhat do trends in excess deaths tell us about the COVID-19 mortality experience across Hampshire?
Hampshire deaths per week over 2020 to 2nd April 2021 compared with 2015-2019 five-year average
Source: PHE ONS- Deaths registered weekly in England and Wales, provisional
Further detailed county and district mortality data can be accessed from the Public Health Hampshire Districts COVID-19 Cases and Mortality Report
In Hampshire excess (extra) deaths had risen above the five-year weekly average for the eight week period between the end of December to mid February,
however for the last five weeks the number of deaths have either been comparable to or below what we would expect for this time of year. Sadly 2,805
people have so far died of COVID-19, with 3 deaths reported over the latest week ending the 2 nd April.
Please note that whilst District data tends to mirror the
Hampshire trend, data at this level is subject to large
statistical fluctuation due to the smaller populations.The COVID-19 alert level and Tiering indicators – Hampshire summary 4th April to 10th April 2021
On the 22nd February the government announced the roadmap which outlines four steps for easing restrictions. Before proceeding to
the next step, the Government will examine the data to assess the impact of previous steps. This assessment will be based on four When interpreting these data
tests: at a district level it is
important to note that small
•The vaccine deployment programme continues successfully. numbers can cause daily
•Evidence shows vaccines are sufficiently effective in reducing hospitalisations and deaths in those vaccinated. fluctuations. Therefore this
•Infection rates do not risk a surge in hospitalisations which would put unsustainable pressure on the NHS. narrative must be considered
•Our assessment of the risks is not fundamentally changed by new Variants of Concern. with the long term trends
shown on slides 7 and 8
The Joint Biosecurity Centre Tier allocation indicators - The JBC’s Tiering allocation is separate and independent of its alert level which show an overall
system. These indicators for Hampshire are provided below for reference as they provide a picture of what is happening with the virus decrease in trends across all
in local areas: districts since mid January
1. Case detection rates in all age groups - The overall Hampshire and all lower tier local authority COVID-19 all age weekly case detection rates are now low and there are small
fluctuations in the number of cases. Test Valley has the highest rate of 34.1 per 100,000, followed by Rushmoor, 19.0 per 100,000.
2. Case detection rates in the over 60s – The 7-day change in weekly over 60s case rates is also low with small fluctuations in the numbers of cases. Rushmoor has the highest
over 60s rate of 26.7 per 100,000.
3. The rate at which cases are rising or falling – As the number of cases has been relatively low for over a week the small fluctuations in cases result in larger percentages changes.
Due to this there is variation in the percentage change in case rate across the districts, however the overall pattern is stable.
4. Positivity rate (the number of positive cases detected as a percentage of tests taken) – Weekly positivity rates are now low in all districts Test Valley has the highest positivity
(1.2%). Note that a positive rate of less than 5% indicates that the epidemic is under control.
5. Pressure on the NHS, including current and projected occupancy - The number of new hospital cases continues to decrease, and this trend is evident across all the trusts. The
total number of mechanical and non-invasive ventilated beds occupied with a COVID-19 patient also continues to decrease.
*Please note data for 7-day period 4th to 10th April 2021Key messages and factors to consider………………..
• The rate of new confirmed COVID-19 infections continues to fall across Hampshire. Number of positive cases are low therefore slight increases day to day can cause fluctuates up and
down in the rates. The latest case rate data, reporting the 7-day period for 28th March to 3rd April, also shows a continued decrease in the over 60s case rate in most districts. Weekly
positivity rates are low across all districts. All districts have a positivity of less than 2%. Note that a positive rate of less than 5% indicates that the epidemic is under control.
• The R for the South East region is estimated to be between 0.7 and 1.0 and the growth rate between -5 and 0. These estimates suggest that across the region the epidemic is continuing to
shrink, but his maybe slowing down. We need to ensure that growth continues to be suppressed, and R is kept below 1 so that the prevalence and spread of disease falls to improve levels
which enable fewer restrictions, and we are able to get beyond the devastating health and economic impacts of COVID-19.
• The daily number of new COVID-19 hospital cases is decreasing. Decreasing COVID-19 bed occupancy pressures are now evident.
• Although falling, the percentage of cases that are compatible with the UK variant is still high and this variant remains dominant across Hampshire districts.
• On the 22nd February 2021 the Prime Minister outlined the “roadmap” out of lockdown through a series of steps over the coming months, starting with schools returning on the 8th March
and an aim to remove all social contact restrictions on the 21st June. We need to recognise that infection rates have not reached a peak naturally, rather polices have successfully
suppressed the infection rates temporarily. A significant proportion of the population are still estimated to be susceptible given this and the highly transmissible nature of the new variant, it
is important that we normalise and sustain COVID-19 control behaviours to break the chains of virus transmission and keep case rates low even in the context of the vaccination
programme.
15Notes on the methodology
• Data is drawn from a range of sources, including:
• The official UK Government website for data and insights on Coronavirus (COVID-19) (https://coronavirus.data.gov.uk)
• The Office for National Statistics (https://www.ons.gov.uk)
• Hampshire County Council’s public health data resources (https://www.hants.gov.uk/socialcareandhealth/publichealth/jsna/covid19-data-and-intelligence)
• Due to time lags relating to testing times, data is generally shown excluding the previous five days, for the purposes of data quality
• Where rates are used, these are shown per 100,000 population
• Locally calculated rates are slightly ahead of the national data but do align
• Importantly, at lower tier local authority levels data tends to be unstable and need to be interpreted with caution!You can also read