A Comparative Analysis of A Global To A Regional Lightning Detection Network
←
→
Page content transcription
If your browser does not render page correctly, please read the page content below
SSRG International Journal of Applied Physics (SSRG-IJAP) – Volume 7 Issue 1 – Jan to April 2020
A Comparative Analysis of A Global To A
Regional Lightning Detection Network
Ogunjobi O1,2, Sivla W.T3 and Odesanya I2
1
School of Chemistry and Physics, University of KwaZulu-Natal, South Africa
2
Department of Physics, Federal University Lokoja
3
Department of Physics and Astronomy, University of Nigeria Nsukka
Abstract less than 25 nodes in 2005 to more than 40
The World Wide Lightning Location distributed across the Earth in 2010. This has led to a
Network (WWLLN) provides global coverage of significantly increased detection efficiency (DE) over
lightning activity in near real time using a network of the last few years4,5,6.
Very Low Frequency (VLF) radio receivers. Although
WWLLN provides superior spatial coverage to In contrast to WWLLN, the SALDN is a regional
regional lightning detection networks, this comes at network which only detects lightning within the
the price of relatively low efficiency. We document a borders of South Africa. The limited spatial range of
technique which can be used to obtain realistic the network is due to the fact that it uses the Very
lightning flash rate densities from WWLLN data by High Frequency (VHF) signature of lightning, which
using satellite lightning observations as a reference. is rapidly attenuated within a few hundred kilometres.
The new flash rate densities are then validated using
data from the South African Lightning Detection LIS and OTD are satellite instruments which use
Network (SALDN). optical techniques to identify lightning discharges.
The spatial resolution and efficiency of these
Keywords — Lightning, WWLLN, LIS/OTD, SALDN instruments are very good. However, the nature of
satellite observations is such that they only gather
I. INTRODUCTION data within their field of view. In order to achieve
Lightning is an electrical discharge driven by charge global coverage, the data from many orbits must be
separation in the Earth’s atmosphere. A lightning combined. The LIS and OTD data sets have been
discharge can extend over several kilometers and inter-calibrated and merged to give lightning flash
typically only lasts a few milliseconds. Lightning can rate densities over a period of 10 years.
be classified as either cloud-to-ground (CG) or cloud-
to-cloud (CC), where the latter category is by far the
most common. A lightning flash consists of one or III. LIGTHNING MODEL
more strokes, each of which is an independent current The WWLLN data were first converted into stroke
pulse. The multiplicity (number of strokes in a flash) rate densities (strokes/km2/year) by dividing the
is known to vary with location and season 1. number of strokes into 0.5° by 0.5° blocks which
were then divided by the area of each block and lastly
Although lightning radiates electromagnetic energy converted to yearly values. These stroke rate
over the entire electromagnetic spectrum, the peak densities were then projected onto a 0.5° by 0.5° grid.
intensity lies in the Very Low Frequency (VLF) In order to make the WWLLN data comparable to
range2,3. Due to the small attenuation of VLF signals other lightning data sets, the stroke rate densities had
in the Earth-Ionosphere Waveguide (EIWG), the to be converted to flash rate densities
pulse of electromagnetic energy, or sferic, can (flashes/km2/year) by assuming an average
propagate over enormous distances. This makes the multiplicity of 3.5 strokes per flash. Despite the
detection of lightning using a small number of VLF excellent time resolution of WWLLN the DE of the
receivers possible. system is very low with the maximum stroke rate
density found to be around 3 flashes/km2/year.
II. LIGTHNING DETECTION SYSTEMS
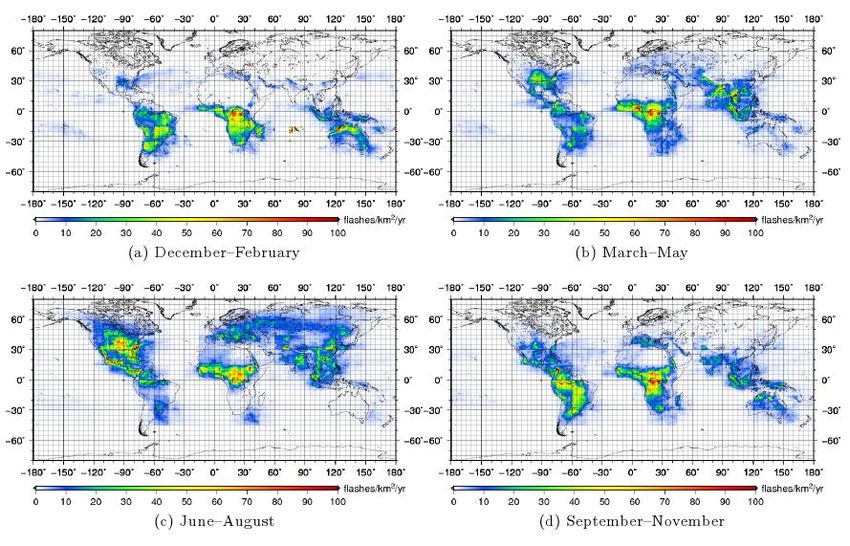
WWLLN is a ground-based lightning detection High resolution flash rate density maps derived from
network that uses VLF sferics to detect lightning the WWLLN data averaged over 5 years (2005 -
activity. Each node in WWLLN consists of an 2009) are given for each season in Figure 1. The
antenna, a Global Positioning System (GPS) receiver corresponding LIS/OTD data is presented in Figure 2.
and a processing computer with internet access. Since It is clear that WWLLN generates flash rate densities
VLF waves propagate with low attenuation in the which are significantly smaller than those obtained
EIWG, these nodes can be placed thousands of from LIS/OTD. This is due to the lower detection
kilometers apart. The system has gone from having efficiency of WWLLN. The spatial distribution of the
ISSN: 2350 - 0301 www.internationaljournalssrg.org Page 49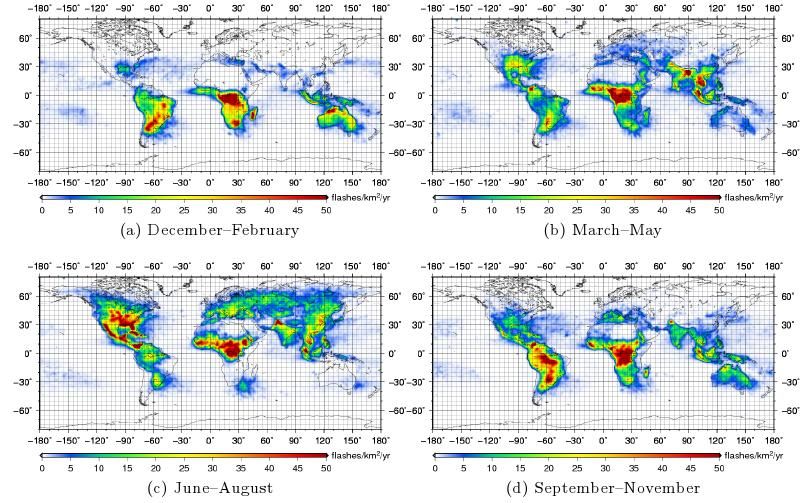
SSRG International Journal of Applied Physics (SSRG-IJAP) – Volume 7 Issue 1 – Jan to April 2020

two data sets are however comparable and they both        These are the ratio of the average LIS/OTD to the
follow the expected seasonal variation with the           average WWLLN flash rate density for every 15° by
highest lightning activity levels during the summer in    15° grid block. A different set of factors was created
the Southern Hemisphere. Also, WWLLN detects the          for each season. Figure 3 illustrates how the
most lightning over equatorial Africa, North America      normalisation factors were found to vary with the
and the Maritime continent, which is to be excepted       WWLLN node distribution.
from previous lightning activity studies.
                                                          Larger normalisation factors were mostly found to
Since the LIS/OTD data were acquired from                 correlate with a lower node density. For example
instruments with high efficiency, the data in Figure 2    over South America and Southern Africa. However
can be regarded as being a true reflection of the         this was not always the case: over the oceans the
average global distribution of lightning. However,        normalisation factors were small although the node
these data were only achieved by averaging the            density in those regions is low. This is probably due
LIS/OTD data over a long period of time. In contrast,     to the flash rate densities of both WWLLN and
minimal averaging is required to achieve a global         LIS/OTD being at a minimum over the oceans.
lightning distribution from WWLLN data. However,          Figure 4 represents the seasonal variation of the
the WWLLN data underestimate the absolute level of        normalised WWLLN flash rate densities. These data
lightning activity. We propose to use the LIS/OTD         are now more comparable to those from Figure 2 as
data to bootstrap the WWLLN measurements.                 well as the global lightning map published by
                                                          Christian et al8.
The WWLLN was first scaled and shifted so that the
mean and standard deviation agreed with that of the
LIS/OTD data. Thereafter normalisation factors were
created which varied across the surface of the globe.

   Fig 1: The average seasonal patterns of global flash rate densities derived directly from the original
                                                WWLLN data

ISSN: 2350 - 0301                         www.internationaljournalssrg.org                            Page 50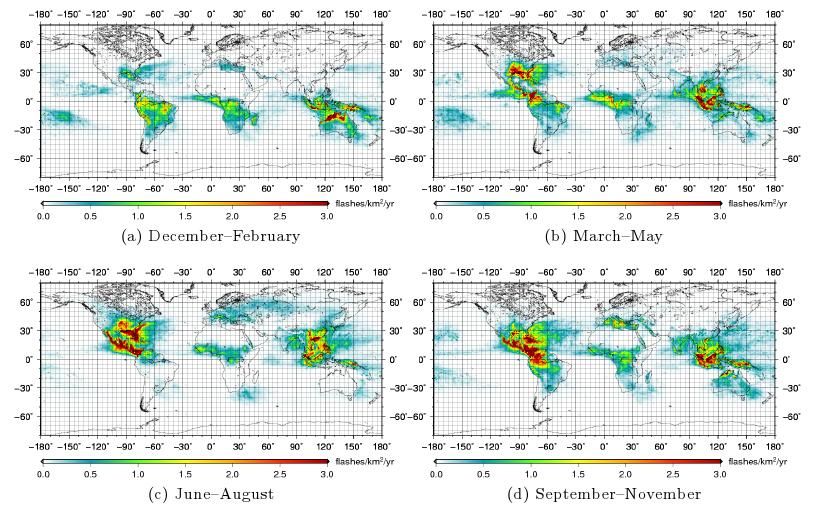
SSRG International Journal of Applied Physics (SSRG-IJAP) – Volume 7 Issue 1 – Jan to April 2020

       Fig 2: The average seasonal patterns of global flash rate density from the LIS/OTD data.

                      Fig 3: An example of the normalisation factors for WWLLN.

ISSN: 2350 - 0301                       www.internationaljournalssrg.org                            Page 51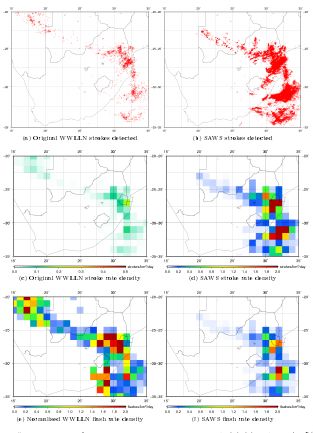
SSRG International Journal of Applied Physics (SSRG-IJAP) – Volume 7 Issue 1 – Jan to April 2020

 Fig 4: The average seasonal patterns of global flash rate densities derived directly from the normalised
                                             WWLLN data.

                                                          (a) and (b), indicate the individual lightning locations
 IV. COMPARISON TO REGIONAL DATASETS                      detected by each of the systems. The second two
In order to validate the normalised WWLLN flash           panels, (c) and (d), compare the SALDN flash rate
rate densities they were compared to regional data        density to the flash rate density derived from the
from SALDN. These data have a very good DE                WWLLN data prior to normalisation. It is apparent
within a specific region and are therefore useful in      that there is a significant difference in the results
the validation process. The comparison was                from SALDN and WWLLN. Finally the last two
conducted using a χ2 test. Both normalised WWLLN          panels, (e) and (f), compare SALDN and the
and the SALDN data were projected onto a 1° by 1°         normalised WWLLN data. It is clear that the
grid. The comparison was confined to the area             normalisation process has made the WWLLN flash
covered by the SALDN, which is effectively within         rate densities quite comparable to those from SALDN.
the borders of South Africa. The null hypothesis for      Furthermore, although the SALDN data are confined
the χ2 test was that the distribution of the two data     to the boundaries of South Africa, the normalised
sets was the same.                                        WWLLN data extends beyond these boundaries. The
                                                          distribution of lightning flashes in Figure 5 on the 4
A few days during February were chosen for                February 2007 agrees well with the average annual
comparison as this is the time during which South         lightning ground flash density distribution shown in
Africa has its highest lightning activity levels. Most    Figure 2 of Gijben 9
of the lightning activity occurs over KwaZulu-Natal       where both figures show that most of the lightning
and the Highveld region. Since SALDN measures             occurs over the northern parts of KwaZulu-Natal, the
strokes, a multiplicity of 2.5 as found by Gill 9 was     Mpumalanga Lowveld and Gauteng.
assumed for the SALDN data. Figures 5 and 6
represent the results from two of the days chosen for     These findings were also confirmed by the results
the comparison. The first two panels in each Figure,      from the χ2-test shown in Table 1. Where the first

ISSN: 2350 - 0301                         www.internationaljournalssrg.org                             Page 52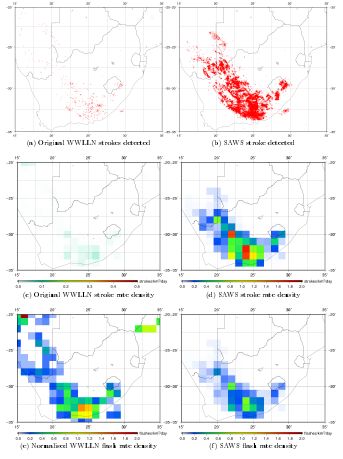
SSRG International Journal of Applied Physics (SSRG-IJAP) – Volume 7 Issue 1 – Jan to April 2020

column gives the date of comparison, the second the         it is still increasing.
χ2-test value, the third the degrees of freedom and the     Unfortunately the detection efficiency of WWLLN is
fourth the p-value. A statistical test's main purpose is    relatively low. This has been thought to be due to a
to determine how well the observed data agrees with         low node density over specific regions but is also
the expected data. A null hypothesis (H0) is set up to      related to the detection mechanism. This prompted
be refuted in order to support an alternative               the use of LIS/OTD data to normalise the WWLLN
hypothesis (H1), where the null hypothesis implies          data. The normalisation factors were found to vary
that there is no difference between the observed and        with node distribution. Where the highest factors
expected data. If the p-value of the χ2-test is less than   were often found to be over the ocean and in close
a chosen significance level, where the p-value is the       proximity to a node. In order to test the accuracy of
probability that a given result could have been             the statistical model, the normalised WWLLN flash
obtained by chance, the null hypothesis is rejected.        rate densities were validated against those of a
Table 1 shows that, according to the χ2-test that the       regional lightning detection system. Both a visual and
normalised WWLLN and SAWS data are comparable               χ2-test was done. WWLLN seemed to have much
on the chosen days.                                         better agreement to the regional systems after the
                                                            normalisation process than before it. The ideal would
                                                            be to obtain more WWLLN and especially more
                                                            SAWS data in order to do the comparison over a
                                                            longer time period. One could then look at the
                                                            seasonal and annual variations of the two data sets
                                                            and examine the similarities and differences.

Fig 5: A comparison of WWLLN against Figure 7:
  A comparison of WWLLN against SAWS for 4
                 February 2007.

   Table 1: Results of the χ2-test for the WWLLN-
                SAWS comparison.

                                                               Figure 6: A comparison of WWLLN against
                                                                      SAWS for 27 February 2007

                 V. CONCLUSIONS                                           ACKNOWLEDGMENT
A statistical lightning model was created using data        I would like to thank the hosts of the various
from the World Wide Lightning Detection Network             WWLLN nodes, NASA for making the LIS/OTD
(WWLLN). When WWLLN started operating in                    data available and lastly the South African Weather
2005 it had only 25 nodes. Five years later in 2010,        Service for the SA LDN data.
the number of nodes had gone up to more than 40 and

ISSN: 2350 - 0301                            www.internationaljournalssrg.org                           Page 53
SSRG International Journal of Applied Physics (SSRG-IJAP) – Volume 7 Issue 1 – Jan to April 2020
REFERENCES
[1] Orville, R.E and Huffiness, G.R. Cloud-to-Ground
Lightning in the United States: NLDN Results in the First
Decade, 1989-98. Monthly Weather Review, 2001;
129:1179-1193.
[2] Hill, E.L. Very Low-Frequency Radiation from Lightning
Strokes. Proceedings of the Institute of Radio Engineers,
1957; 45(6):775-777.
[3] Prasad, R. and Singh, R.N. Various features of VLF waves
generated by lightning discharge. Il Nuovo Cimento C,
1982; 5(4):462-476.
[4] Rodger, C.J., Brundell J.B., Dowden, R.L. and Thomson,
N.R. Location accuracy of long distance VLF lightning
location network. Annales Geophysicae, 2004; 22:747-758.
[5] Rodger, C.J., Clilverd, M.A., Thomson, N.R., Nunn, D. and
Lichtenberger, J. Lightning driven inner radiation belt
energy deposition into the atmosphere: regional and global
estimates. Annales Geophysicae, 2005; 23:3419-3430.
[6] Rodger, C.J., Werner, S., Brundell, J.B., Lay, E.H.,
Thomson, R.H., Holzworth R.H. and Dowden, R.L.
Detection efficiency of the VLF World-Wide Lightning
Location Network (WWLLN): initial case study. Annales
Geophysicae, 2006; 24:3197-3214.
[7] Christian, H.J., Blakeslee, R.J., Boccippio, D.J., Boeck,
W.L., Bucchler, D.E., Driscoll, K.T., Goodman, S.J., Hall,
J.M., Koshak, W.J., Mach, D.M., Stewart, M.F. Global
frequency and distribution of lightning as observed from
space by the Optical Transient Detector. Journal of
Geophysical Research, 2003; 108(D1).
[8] Gill, T. A lightning climatology of South Africa for the first
two years of operation of the South African Weather
Service Lightning Detection Network: 2006-2007.
[9] In 20th International Lightning Detection Conference and
2nd International Lightning Meteorology Conference, 2008.
[10] Gijben, M. The lightning climatology of South Africa.
South African Journal of Science, 2012; 108(3/4)
ISSN: 2350 - 0301 www.internationaljournalssrg.org Page 54You can also read