Point of Sale (POS) Data from a Supermarket: Transactions and Cashier Operations - MDPI
←
→
Page content transcription
If your browser does not render page correctly, please read the page content below
data
Data Descriptor
Point of Sale (POS) Data from a Supermarket:
Transactions and Cashier Operations
Tomasz Antczak and Rafał Weron *
 Department of Operations Research, Faculty of Computer Science and Management, Wrocław University
 of Science and Technology, 50-370 Wrocław, Poland; Tomasz.Antczak@pwr.edu.pl
 * Correspondence: Rafal.Weron@pwr.edu.pl; Tel.: +48-71-320-4525

 Received: 11 March 2019; Accepted: 9 May 2019; Published: 11 May 2019

 Abstract: As queues in supermarkets seem to be inevitable, researchers try to find solutions that
 can improve and speed up the checkout process. This, however, requires access to real-world data
 for developing and validating models. With this objective in mind, we have prepared and made
 publicly available high-frequency datasets containing nearly six weeks of actual transactions and
 cashier operations from a grocery supermarket belonging to one of the major European retail chains.
 This dataset can provide insights on how the intensity and duration of checkout operations changes
 throughout the day and week.

 Dataset: Supplementary data to this article.

 Dataset License: CC-BY-NC

 Keywords: Point of Sale (POS) data; retail operations; customer analytics; checkout process

1. Summary
      Retail store operations are an active and a relatively wide area of research. In a recent study,
Mou et al. [1] reviewed 255 publications from 32 operations research, retailing and management
journals over the period 2008–2016 and categorized works by distinguishing seven operational
decisions pertinent to store management. These included: (1) demand forecasting; (2) in store logistics;
(3) inventory management; (4) assortment and display; (5) product promotion; (6) checkout operations
and (7) employee management. Interestingly, the authors argue that in particular checkout operations
will attract more attention in the near future.
      As of today, however, only a few studies related to checkout operations have been published [2–5].
The likely reason is the (un)availability of recent and representative point of sale (POS) data. Even if
such data is analyzed, it is often “proprietary and therefore not available to researchers at large”,
as in the case of the Mas and Moretti dataset [6]. With this in mind, we have prepared and made
publicly available high-frequency datasets containing nearly six weeks of actual transactions and
cashier operations from a grocery supermarket belonging to one of the major European retail chains.
This dataset can provide insights on how the intensity of checkout operations changes throughout the
day and throughout the week. Hence, it can be used as a starting point for building realistic agent-based
or forecasting models of customer behavior. In practice, such data—if available in real-time—can
augment detectors or video content analysis technologies (VCA) used to count customers inside a
store [7] and yield better predictions of the demand for opened checkouts. On the other hand, it can be
used to provide feedback, e.g., in the form of voice or visual messages, about the current or near-future
state of the checkout zone, with the ultimate objective of speeding up the checkout process and
increasing consumer satisfaction [8].

Data 2019, 4, 67; doi:10.3390/data4020067                                       www.mdpi.com/journal/data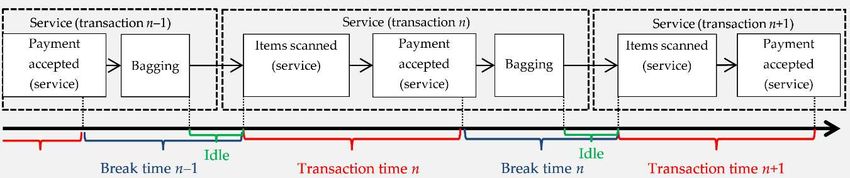
Data 2019, 4, 67                                                                                                                 2 of 4

2. Data Description
     The data was retrieved from checkout/POS system logs stored in XML files, which contained
various low-level transactional data. Once extracted, it was aggregated into six CSV files with the most
important information about (i) transactions; and (ii) cashier operations, see Tables 1 and 2, respectively.
The data concerns retail operations in a grocery supermarket located in a large city in Southern Poland,
equipped with manned (service) and self-service checkouts. The checkout zone is composed of a single
waiting line for each service checkout and one waiting line for all self-service checkouts. The data
covers three nearly two-week periods: (i) 7 to 19 December 2017; (ii) 13 to 26 February 2019; and (iii) 28
March to 10 April 2019. Please note that the new regulations introduced in Poland in 2018 banned
shopping on some Sundays, generally two Sundays per month in 2018 and three Sundays per month
in 2019, disrupting the rather regular 7-day pattern observed until the end of 2017. Supermarkets have
reacted by extending the working hours on Fridays and Saturdays, while customers had to adapt to
the changes in opening hours. The two pairs of datasets from 2019 include one working (24 February,
31 March) and one non-working Sunday (17 February, 7 April) each.

           Table 1. Transactions data (POS_transactions_*.csv files): fields, data types and descriptions.

             Field                        Type                                          Description
     WorkstationGroupID                 Integer                      Type of checkout: 1—service, 8—self-service
           TranID                       Numeric                Transaction ID (date, store ID, checkout ID, sequence no.)
       BeginDateTime                   Date/Time                           Date and time of transaction start
        EndDateTime                    Date/Time                           Date and time of transaction end
         OperatorID                     Integer                                    Unique cashier ID
          TranTime                      Integer                              Transaction time in seconds 1
         BreakTime                      Integer                         Break (including idle) time in seconds 2
          ArtNum                        Integer                            Number of items, i.e., basket size
           TNcash                      True/False               Cash payment flag (true when transaction paid in cash)
           TNcard                      True/False              Card payment flag (true when transaction paid by a card)
           Amount                       Numeric                                    Transaction value
      1 Computed for the n-th transaction as: TranTime(n) = EndDateTime(n) − BeginDateTime(n). 2 Computed for the n-th
      transaction as: BreakTime(n) = BeginDateTime(n) − EndDateTime(n − 1), i.e., the latter is from the previous transaction.

      Table 2. Cashier operations data (POS_operator_logs_*.csv files): fields, data types and descriptions.

              Field                      Type                                        Description
      WorkstationGroupID               Integer                  Type of checkout: 1—service, 8—self-service
        WorkstationID                  Integer                              Unique checkout ID
            TranID                    Numeric             Transaction ID (date, store ID, checkout ID, sequence no.)
        BeginDateTime                 Date/Time                       Date and time of transaction start
         OperatorID                    Integer                               Unique cashier ID
             Items                       Text                               Operation identifier 1
      1 Admissible values: OperatorSignOn—cashier log-in, OperatorSignOff —cashier log-off, OperatorLock—start of
      cashier’s break, OperatorUnLock—end of cashier’s break.

3. Methods
     The two datasets were extracted from checkout/POS system log files of a supermarket. The logs
are archived in XML files and contain various low-level transactional data, most of which is not
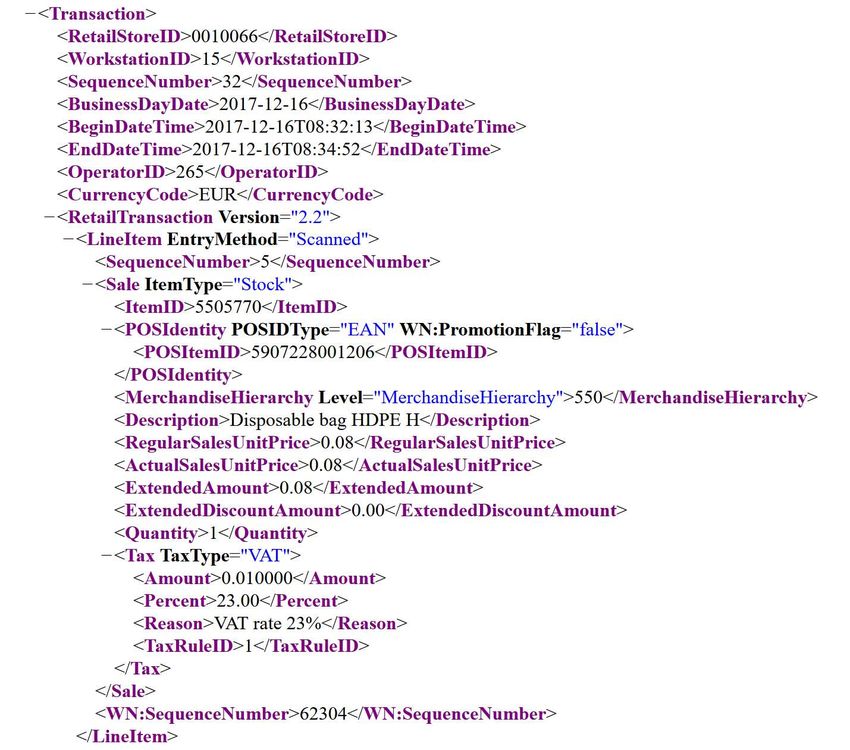
relevant for the analysis of transactions or cashier operations. A small fragment of a sample log file
is depicted in Figure 1. Note that the checkout service generally consists of three separate activities:
scanning (registration) of articles, payment and bagging (including idle time). POS logs include the
exact times of starting (registration of the first article in the basket; BeginDateTime) and end times of the
transactions (EndDateTime).
     However, the data has its limitations. For instance, the registered end time is not exactly the
time when the payment is made and the operation is terminated. In particular, for cash payments
Data 2019, 4, x FOR PEER REVIEW 3 of 4
Data 2019, 4, x FOR PEER REVIEW 3 of 4
Data 2019, 4, 67 3 of 4
However, the data has its limitations. For instance, the registered end time is not exactly the time
whenHowever,
the payment the data has its and
is made limitations. For instance,
the operation the registered
is terminated. end time is for
In particular, not cashexactly the time
payments
when the
EndDateTime payment
EndDateTime does does not is made
not cover
cover the and the
the activity operation
activity of of giving is
giving back terminated.
back thethe change
change toIn particular,
to the
the customer, for
customer, while cash
while thepayments
the time
time
between transactions (BreakTime) retrieved from POS data includes the idle time between time
EndDateTime
between does
transactions not cover
(BreakTime) the activity
retrieved of
from giving
POS back
data the change
includes the to
idle the
time customer,
between while
two the
operations,two
between
operations,
which transactions
actually whichis not (BreakTime)
actually
part ofisthe retrieved
notservice
part ofactivity. from
the service POS data
activity.
However, includes
However,
given that idle the
given idle
timesthat
are time
idlevery between
times
rareare two
very
during
operations,
rare
peak during
hours, by which
peak actually
hours,
analyzing by
only is periods
not partof
analyzing ofhigh
onlythe serviceofactivity.
periods
activity However,
high activity
(particularly given
(particularly
Thursdays 10that idle
to 1times
Thursdays
a.m. p.m., 10are very
a.m.
Fridays to
rare
and during
Saturdays peak 11 hours,
a.m. by
to 2 analyzing
p.m.) we only
can periods
essentially of high activity
eliminate the (particularly
1 p.m., Fridays and Saturdays 11 a.m. to 2 p.m.) we can essentially eliminate the impact of idle times
impact of Thursdays
idle times and10 a.m.
obtain to
1 p.m., Fridays
and obtain information
information and Saturdays
about the service abouttime 11 a.m.
the itself. to
serviceThe2 p.m.)
time we can
itself. The
timeline essentially
of thetimeline
checkout eliminate
of service
the checkout the impact
(scanning,service of idle times
(scanning,
payment and
and obtain information about the service time itself. The timeline
payment and bagging) and the times retrieved from POS logs are illustrated in Figure 2.
bagging) and the times retrieved from POS logs are illustrated in of
Figure the 2.checkout service (scanning,
payment and bagging)
Regarding
Regarding queue
queue and the times retrievedthe
management/modeling,
management/modeling, from thePOS
data logs
data
does are
notdoes illustrated
contain notcustomer in Figure
contain customer
arrival 2.information.
arrival
Regarding
information.
However, queue
it is However,
possible to extractmanagement/modeling,
it is possible to extractarrival
an approximate the data
an approximate does not
arrivalone
rate. For instance, contain
rate.
canFor customer
instance,
combine arrival
one
a theoretical can
information. However, it is possible to extract an approximate
combine a theoretical model (e.g., a Non-Homogeneous Poisson Process, NHPP [9]) with
model (e.g., a Non-Homogeneous Poisson Process, NHPP [9]) with arrival
transactionalrate. For
data, instance,
i.e., one
approximate can
combine
transactional
the a theoretical
arrival ratedata, model
i.e., approximate
of a NHPP (e.g.,
at a certain the a Non-Homogeneous
hourarrival
by therate
averageof a number Poisson
NHPP at Process,
of atransactions
certain hour NHPP
in abytime [9])
the window with
average
number of transactions in a time window (e.g., +/− 30 min) around this hour. Such an approachaverage
transactional
(e.g., +/− 30 data,
min) i.e.,
around approximate
this hour. Suchthean arrival
approach rate of
would a NHPP
yield an at a
edge certain
over hour
completely by the would
theoretical
number
yield
arrival an ofedge
transactions
process in a time used
over completely
models typically window
theoretical (e.g., +/− 30process
arrival
in publications min) around
concerningmodels thistypically
modeling hour. queues
Such anin
used approach would
insupermarkets.
publications
yield
Finally,an
concerning edge
despite over
modeling completely
the factqueues theoretical
in supermarkets.
that balking arrival
and renegingFinally, process
unarguably models
despitetaketheplace,typically
fact that used
balking
our own in publications
and reneging
observations and
concerning
interviews modeling
with line queues
workers in
suggest supermarkets.
that they are Finally,
so despite
incidental, that the
unarguably take place, our own observations and interviews with line workers suggest that they the theyfactdo that
not balking
affect and reneging
significantly are
unarguably
so incidental,
queuing take
process. thatplace,
they do ournotown observations
affect significantly andtheinterviews
queuing with line workers suggest that they are
process.
so incidental, that they do not affect significantly the queuing process.
Figure 1.
Figure 1. A
A small
small fragment
fragment of
of aa sample
sample XML
XML log
log file
file for
for aasingle
singletransaction.
transaction. Only
Only data
data for
for the
the first
first
Figure 1. A small fragment
item (‘LineItem’) is shown.
item (‘LineItem’) is shown. of a sample XML log file for a single transaction. Only data for the first
item (‘LineItem’) is shown.
Figure 2. Timeline of the checkout service (scanning, payment and bagging) and the times retrieved
Figure
Figure
from 2.2.Timeline
point Timeline ofthe
of
of sale (POS)thelogs
checkout
checkout servicetime—TranTime,
service
(transaction (scanning,payment
(scanning, payment and
and
break bagging)and
bagging) andthe
time—BreakTime; the times
thetimes retrieved
latterretrieved
includes
from
from point
point of
of
the idle time). sale
sale (POS)
(POS) logs
logs (transaction
(transaction time—TranTime,
time—TranTime, break
break time—BreakTime;
time—BreakTime; the
the latter
latter includes
includes
theidle
the idletime).
time).
Supplementary Materials: The datasets (POS_operator_logs_20171207-20171219.csv, POS_operator_logs_
Supplementary Materials:
20190213-20190226.csv, The datasets (POS_operator_logs_20171207-20171219.csv,
POS_operator_logs_20190328-20190410.csv, POS_operator_logs_
POS_transactions_20171207-20171219.csv,
20190213-20190226.csv, POS_operator_logs_20190328-20190410.csv, POS_transactions_20171207-20171219.csv,Data 2019, 4, 67 4 of 4
Supplementary Materials: The datasets (POS_operator_logs_20171207-20171219.csv, POS_operator_logs_ 2019
0213-20190226.csv, POS_operator_logs_20190328-20190410.csv, POS_transactions_20171207-20171219.csv,
POS_ transactions_20190213-20190226.csv, POS_transactions_20190328-20190410.csv) are available online at
http://www.mdpi.com/2306-5729/4/2/67/s1
Author Contributions: T.A. collected and extracted relevant data from the checkout/POS system log files; T.A.
aggregated relevant data into CSV files; T.A. and R.W. drafted the paper; R.W. reviewed and edited the final version.
Funding: This research was funded by the Ministry of Science and Higher Education (MNiSW), Poland,
Core Funding for Statutory Research and Development Activities.
Conflicts of Interest: The authors declare no conflict of interest.
References
1. Mou, S.; Robb, D.J.; De Horatious, N. Retail store operations: Literature review and research directions.
Eur. J. Oper. Res. 2018, 265, 399–422. [CrossRef]
2. Bermana, O.; Larson, R.C. A queueing control model for retail services having back room operations and
cross-trained workers. Comput. Oper. Res. 2004, 31, 201–222. [CrossRef]
3. Rossetti, M.D.; Pham, A.T. Simulation modeling of customer checkout configurations. In Proceedings of
the 2015 Winter Simulation Conference, Huntington Beach, CA, USA, 6–9 December 2015; pp. 1151–1162.
[CrossRef]
4. Kwak, J.K. Analysis on the effect of express checkouts in retail stores. J. Appl. Bus. Res. 2017, 33, 767–774.
[CrossRef]
5. Sturley, C.; Newing, A.; Heppenstall, A. Evaluating the potential of agent-based modelling to capture
consumer grocery retail store choice behaviours. Int. Rev. Retail Distrib. Consumer Res. 2017, 28, 1–20.
[CrossRef]
6. Mas, A.; Moretti, E. Peers at work. Am. Econom. Rev. 2009, 99, 112–145. [CrossRef]
7. Musalem, A.; Olivares, M.; Schilkrut, A. Retail in high definition: Monitoring customer assistance through
video analytics. Columbia Bus. Sch. Res. Pap. 2016. [CrossRef]
8. Larson, R.C. There’s more to a line than its wait. Tech. Rev. 1988, 91, 60–67.
9. Statistical Tools for Finance and Insurance, 2nd ed.; Cizek, P.; Härdle, W.; Weron, R. (Eds.) Springer: Berlin,
Germany, 2011. [CrossRef]
© 2019 by the authors. Licensee MDPI, Basel, Switzerland. This article is an open access
article distributed under the terms and conditions of the Creative Commons Attribution
(CC BY) license (http://creativecommons.org/licenses/by/4.0/).You can also read


