A Comprehensive Hydrological Model for
←
→
Page content transcription
If your browser does not render page correctly, please read the page content below
A Comprehensive Hydrological Model for the
        Canterbury Region
                                                          Stefanie Rixecker
                                     Head of Science, Environment Canterbury

                                                            David Maidment
                                  Waterways Centre for Freshwater Research
                                University of Canterbury and Lincoln University
                                on leave from the University of Texas at Austin

This is a Keynote Presentation for the Workshop “Towards a Water Data Infrastructure
for New Zealand” held at the University of Canterbury, April 10-11, 2018

Dr Maidment’s visit to the Waterways Centre is supported by an Erskine Fellowship
from the University of Canterbury. The help of Jenny Webster-Brown, Julie Clark,
and Suellen Knopick of the Waterways Centre for Freshwater Research
is gratefully acknowledged. Data support and guidance from Environment Canterbury
and the Horizons Regional Council is also gratefully acknowledged.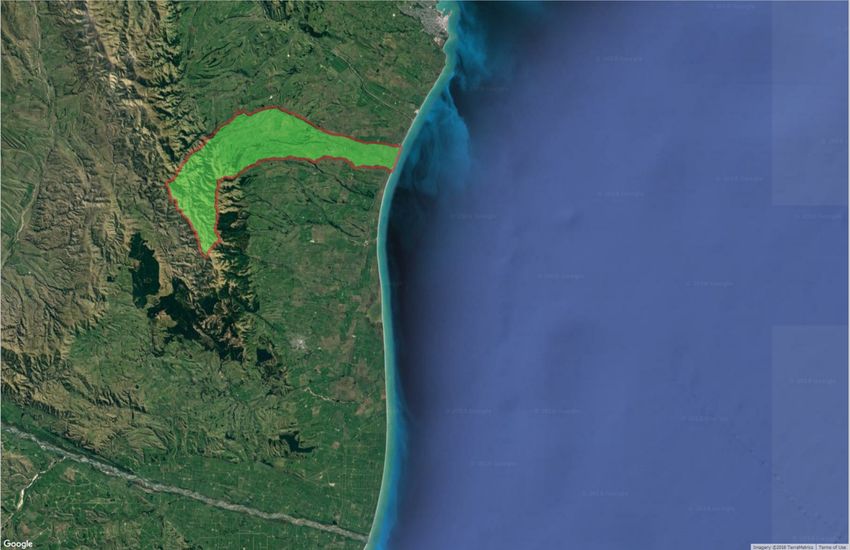
Plans require good science & data

•   Water quantity
•   Water quality
•   Land use
•   Presented according to:
    – Current state
    – Future scenarios
• The environment needs to
  be monitored, trends
  established & outcomes
  defined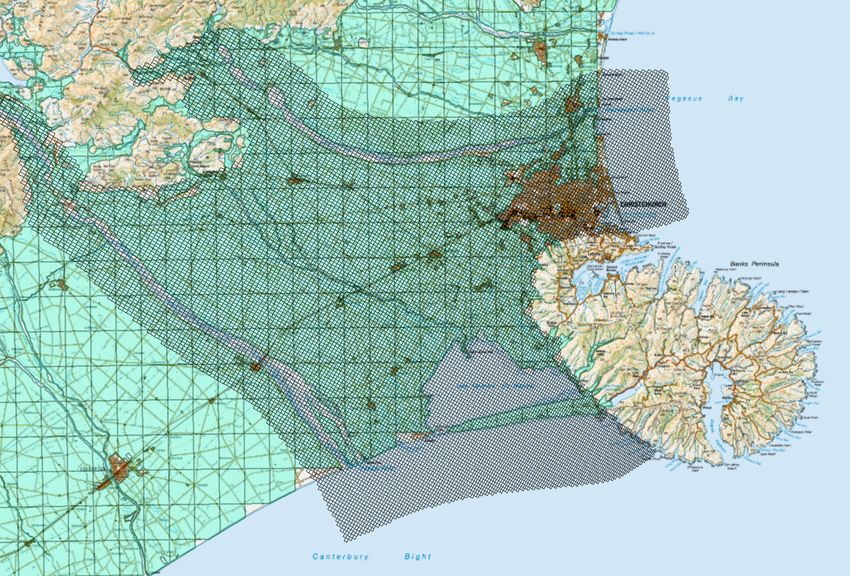
Plans are not infinite – 5 & 10 year intervals

• Plans must be assessed on
  a 5 & 10 yearly cycle
• There is an expectation that
  data and science models
  can explain improvements
  and indicate further actions
  required
• How do we secure
  systematic, credible
  answers for the next
  generation?
Re-conceptualising Canterbury’s water

                   • Goal: Combining
                     technology, data science
                     and modelling for improved
                     decision-making
                   • Key targets: reduced
                     planning costs, increased
                     certainty and enhanced
                     credibility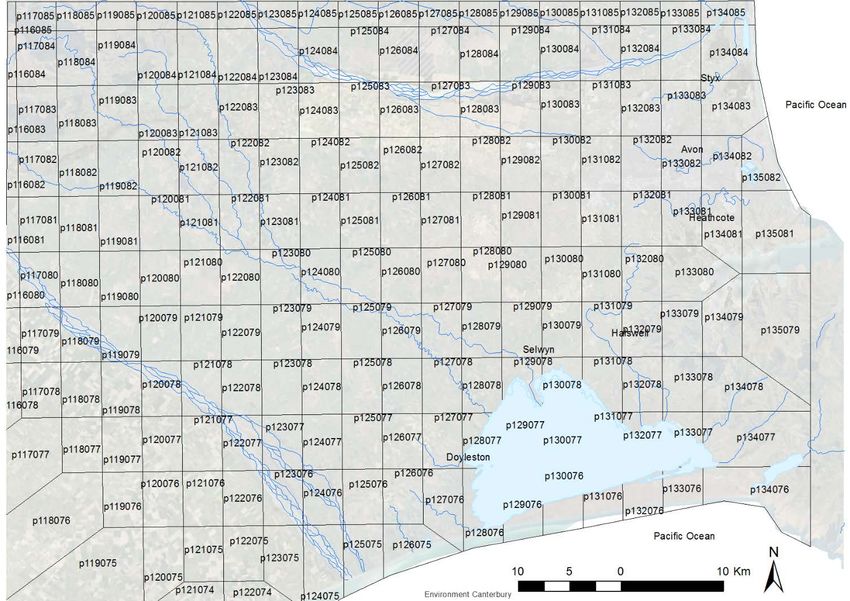
A real-time, hydrologically connected (3D) model for Canterbury

 Model surface water – quantity and quality

 Model groundwater – flow paths, connectivity and change over
 time; also include GW quality

 Have the ability to backcast – based on prior data to show
 quarterly, seasonal and annual changes over time

 Have the ability to show real-time data– what is the state
 today? – based on current hydrological and meteorological
 information

 Have the ability to forecast – scenarios & options, warnings

 Have the ability to connect w/ non-science data (e.g., consents,
 water metering) and inform adaptive management conditions

 Incorporate Matauranga Maori indicators
A Comprehensive Hydrological Model for
the Canterbury Region

• What   do we have now?
• What   is needed?
• How   do we get there?
A Comprehensive Hydrological Model for
the Canterbury Region

• What   do we have now?
• What   is needed?
• How   do we get there?
Environment Canterbury Regional Council (ECan)
     Available Data

University of Canterbury
28 Feb 2018
Fouad Alkhaier
Senior hydrogeologist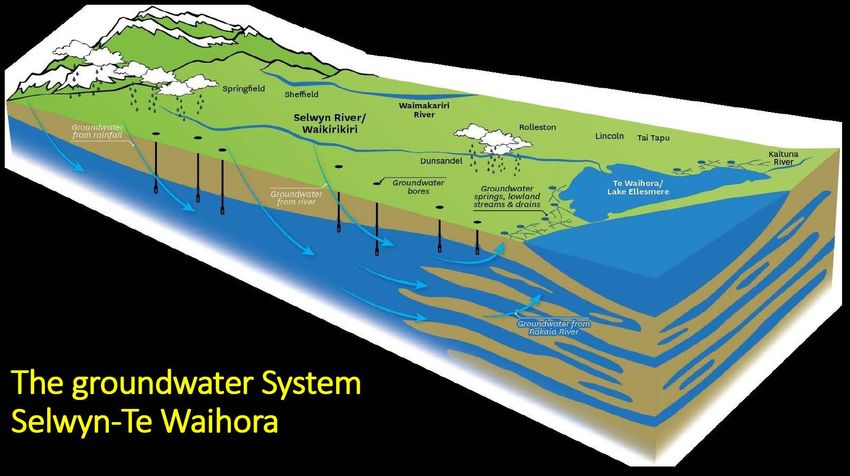
Types of available data (ECan)
• Precipitation
• Groundwater level
• Stream and river flows
Other sources of data (NIWA)
• Real weather stations data
• Virtual climate stations (VCS)
Precipitation
                https://www.ecan.govt.nz
                /
                Rainfall data
Groundwater level
https://www.ecan.govt.nz
/
Well SearchObservation wells
Borehole Descriptions
https://www.ecan.govt.nz/data/well-search/
Stream and river flows
                         https://www.ecan.govt.nz
                         /
                         River Flow Data
Canterbury Maps https://www.ecan.govt.nz
/Other sources for data (NIWA)
https://cliflo.niwa.co.nz/
The National Climate Database
Virtual Climate Stations (VCS) Network
NZ’s Digital
                      River Network

Dr Amy Whitehead
  NIWA Christchurch
NZ’s Digital River Network
What is it?
• Dendritic stream network
• > 576,000 individual reaches
• 425,000 km of riverNZ’s Digital River Network
How was it made?
78 72 69 71 58
74 67 56 49 46
69 53 44 38 37
69 58 55 22 31
68 61 47 21 16
Digital elevation model
Stream network
Flow direction Watersheds & catchmentsNZ’s Digital River Network
How was it made?
• 30m digital elevation model
• Calculated local and upstream variables for
each reach
• Elevation
• Slope
• Rainfall
• Geology
• Landcover
https://www.niwa.co.nz/freshwater-and-
estuaries/management-tools/river-
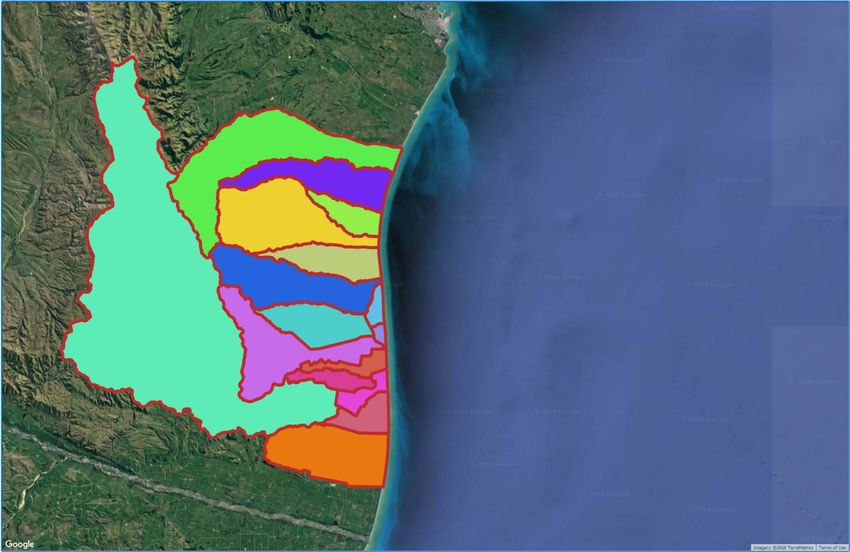
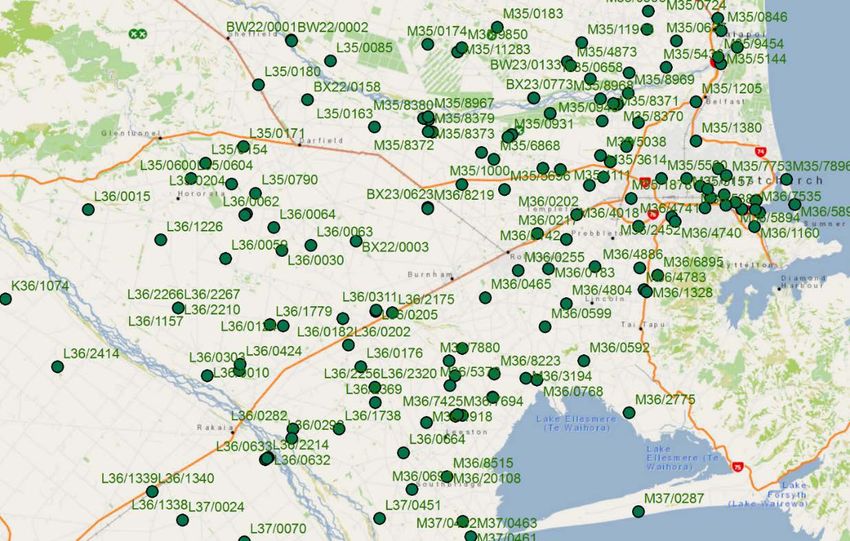
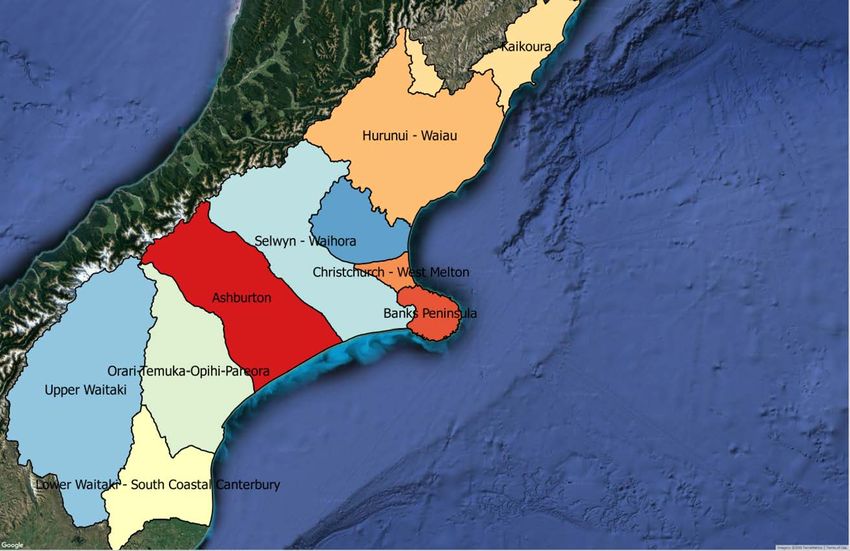
environment-classification-0Canterbury Streams and Groundwater Monitoring Groundwater wells
Planning Zones with Flow Models
Potentially Irrigable Areas of New
Zealand

 Source of Data: Andrew Dark, Aqualinc
Existing and Proposed Irrigable Areas
                                     IRRIGATION

Half of existing
irrigable areas
and more than
half of
proposed
irrigable areas
are in
Canterbury

                   Source: Irrigation New Zealand
Selwyn Modflow Groundwater Model
Source of Data: Julian Weir, AqualincSelwyn Groundwater System
Geological and Nuclear Sciences Data

Can be purchased and sent by mail
Rivers in Selwyn Groundwater
Model
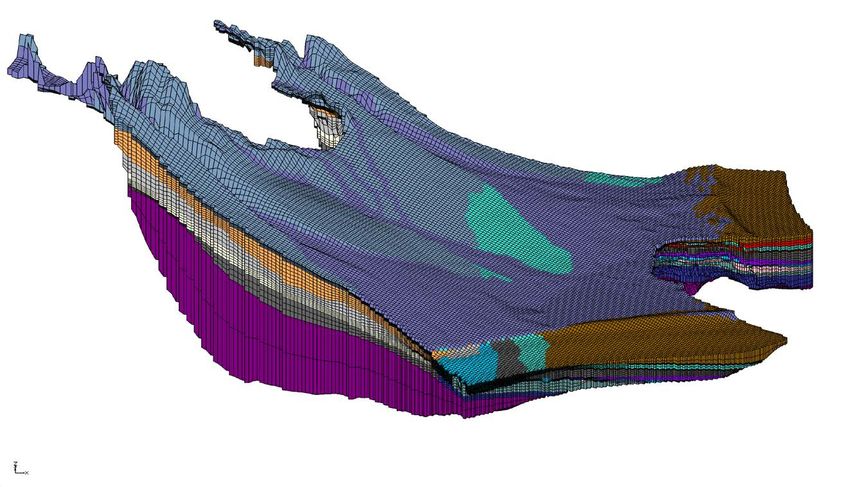
Source: Julian Weir, Aqualinc3D Model of Selwyn Groundwater Source: Julian Weir, Aqualinc
Selwyn Hydrogeological Strata

                                         Waimakariri River

                                               Selwyn River

Rakaia River

               Source: Julian Weir, Aqualinc
Groundwater Level Calibration
Simulated vs. Measured Groundwater Levels
Steady State Calibration
400
350 Normalised RMSE = 1.25%
R^2 = 0.992
300
Modelled groundwater levels (m amsl)
250
200
150
100
50
0
0 50 100 150 200 250 300 350 400
Average measured groundwater levels (m amsl)
Source: Julian Weir, AqualincSurface Water Calibration
Styx River at Radcliffe Rd
4.0
3.5
3.0
2.5
Flow (m3/s)
2.0
1.5
1.0
0.5
0.0
1960 1965 1970 1975 1980 1985 1990 1995 2000 2005 2010 2015
Date (1/1/yyyy)
Measured Modelled
Source: Julian Weir, AqualincA Comprehensive Hydrological Model for the Canterbury Region • What do we have now? - Canterbury is “data rich” - Lots of observations data - Good web sites for individual data locations - Good digital river network - Impressive groundwater modeling for planning zones
A Comprehensive Hydrological Model for
the Canterbury Region

• What   do we have now?
• What   is needed?
• How   do we get there?
A real-time, hydrologically connected (3D) model for Canterbury

 Model surface water – quantity and quality

 Model groundwater – flow paths, connectivity and change over
 time; also include GW quality

 Have the ability to backcast – based on prior data to show
 quarterly, seasonal and annual changes over time

 Have the ability to show real-time data– what is the state
 today? – based on current hydrological and meteorological
 information

 Have the ability to forecast – scenarios & options, warnings

 Have the ability to connect w/ non-science data (e.g., consents,
 water metering) and inform adaptive management conditions

 Incorporate Matauranga Maori indicators
Surface Water and Groundwater, Quantity
and Quality, in 3D for all of Canterbury
A real-time, hydrologically connected (3D) model for Canterbury

 Model surface water – quantity and quality

 Model groundwater – flow paths, connectivity and change over
 time; also include GW quality

 Have the ability to backcast – based on prior data to show
 quarterly, seasonal and annual changes over time

 Have the ability to show real-time data– what is the state
 today? – based on current hydrological and meteorological
 information

 Have the ability to forecast – scenarios & options, warnings

 Have the ability to connect w/ non-science data (e.g., consents,
 water metering) and inform adaptive management conditions

 Incorporate Matauranga Maori indicators
Slide :Rob Vertessy
A real-time, hydrologically connected (3D) model for Canterbury

 Model surface water – quantity and quality

 Model groundwater – flow paths, connectivity and change over
 time; also include GW quality

 Have the ability to backcast – based on prior data to show
 quarterly, seasonal and annual changes over time

 Have the ability to show real-time data– what is the state
 today? – based on current hydrological and meteorological
 information

 Have the ability to forecast – scenarios & options, warnings

 Have the ability to connect w/ non-science data (e.g., consents,
 water metering) and inform adaptive management conditions

 Incorporate Matauranga Maori indicators
Blue Cliffs Station
 Presented by William Rolleston
        28 March 2018
Ecan Watersheds in South Canterbury Slide: William Rolleston
Otaio Catchment in South Canterbury

Slide: William Rolleston
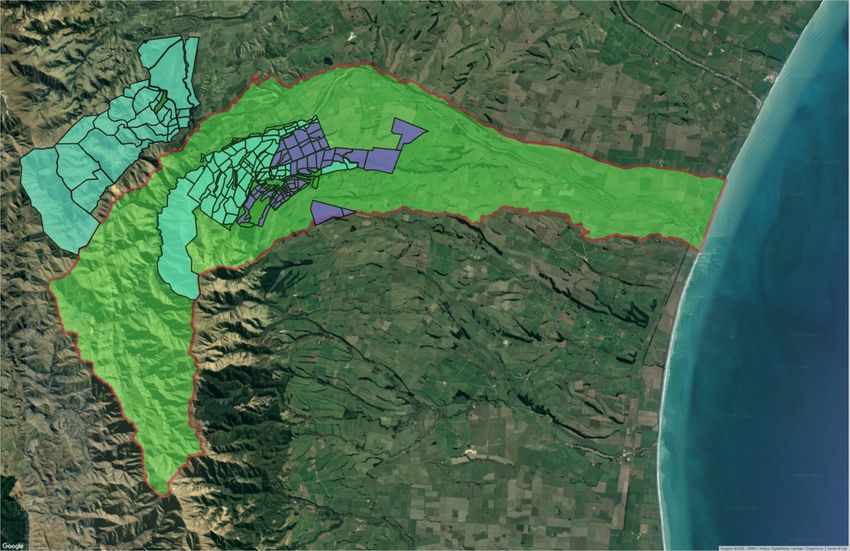
Blue Cliffs Station (5000 ha)

Slide: William Rolleston
Possible Riparian Zones on Blue Cliffs
                           45 Hectares

                                                       27 Hectares
                                         49 Hectares

Slide: William Rolleston
Hydrology and Groundwater of
Blue Cliffs Modelled in 3D
Make regional modelling
meaningful at farm scaleWater Data Canterbury
Sharing data through Management Regional
open standards
Farming
Mapping Modelling
Monitoring
National Regional Urban Iwi Industry FarmingA Comprehensive Hydrological Model for the Canterbury Region • What do we have now? • What is needed? • How do we get there?
New Zealand Water Information System
          proposed in 2013
      NIWA operates about 10% of 1300 hydrometric stations
      Regional authorities operate about 90% of stations

                                                         New Zealand
                                                   Water Information System

              Develop a federated hydrological information infrastructure . . .
                          . . . linking nationally and regionally collected data
Current State of Play for NZ – all Done!
Local National -
CRIs
Government
16 3
SOS2/WaterML2 SOS2/WaterML2
now now
SOS = Sensor Observation Service
Slide: Brent Watson, HRCLand Air Water Aotearoa (LAWA)
Observations of Water QualityData Sharing using Open Standards in LAWA • Each region maintains its own data • Data are accessed through “web services” • Common language for water: WaterML2 • Open Geospatial Consortium standards • All information “looks the same” to user • A tremendous technological achievement for New Zealand!!! Credit: LAEMG, especially Horizons Regional Council Michael McCartney, Jeff Watson, Brent Watson, Sean Hodges NIWA and Landcare
Core Observation Networks

Precipitation    Streamflow   Groundwater
Digital River Network of New Zealand
Version 3 (DN3) -- NIWA, Christchurch

     LIDAR-based

            Waituna

 Improvements started in Southland, done for most of North Island by June 2017,
 for all of North and South Islands by June 2018
This meeting led to an engagement between the
academic community of the United States and the
National Weather Service to help build the National
Water Model
4/26/2018 PRE-DECISIONAL - DO NOT DISTRIBUTE 65
Inaugural Meeting – May, 2014National Flood Interoperability Experiment
• Partnership between National Weather Service and
the academic community
• Includes Summer Institutes for 105 graduate
students from 49 universities at the National Water
Center, June-July in 2015, 2016, 2017, ….Centralized Water Model and Forecasting
National Water CenterNHDPlus Version 2.1
Foundation for a Geospatial Hydrologic Framework for the United States
NHDPlus
2.7 million reach catchments in US
average area 3 km2
reach length 2 km
Uniquely labelled
National Elevation Dataset Watershed Boundary Dataset
National Hydrography Dataset
National Land Cover DatasetStampede
1.2 million gallon cooling tank
500,000 processors operating in parallelOperational on 16 August 2016
2.7 million reaches covering 5.2 million Km of streams and rivers
National Water Center
Tuscaloosa, ALNational Water Forecasting
Now
Analysis Best estimate of current conditions
Short Range Hourly for 18 hours ahead
Medium Range 6 Hourly for 10 days ahead
Long Range Daily for 30 days ahead
Ensemble of 4 forecasts each 6 hours (24 forecasts total)
Operational with publicly accessible forecasts as of 16 August 2016
ftp://ftpprd.ncep.noaa.gov/pub/data/nccf/com/nwm/prod/Groundwater Model for Continental US
250 m cells horizontal
1 km total depth
1 billion computational cells
Source: Reed Maxwell
Colorado School of MinesGeospatial Systems Are Helping Us Understand
Understanding Sharing and
Collaboration
Knowledge
Integration
Information
Mapping
Data
. . . Helping Us Make Better DecisionsGeographic Data Models “All geographic information systems are built using formal models that describe how things are located in space. A formal model is an abstract and well-defined system of concepts. A geographic data model defines the vocabulary for describing and reasoning about the things that are located on the earth. Geographic data models serve as the foundation on which all geographic information systems are built.” Scott Morehouse, Preface to “Modeling our World”, First Edition. He was the chief software engineer at ESRI
Geographic Information Models for Surface Water
               and Groundwater
Arc Hydro Groundwater Data Model Environment Canterbury has all these data
Aqualinc MODFLOW Model Grid, MODFLOW-NWT
Not yet in AH-GW
flopy &
pyshp
CellBudgetFile
Headfile
Grid Shapefile
->
Modfow Output
in ArcGIS
Slide: Justin RogersFlux in and out of
surface layer
Slide: Justin RogersFlux in and out of
surface layer
Vectors of
Groundwater Flow
Slide: Justin RogersFlux in and out of
layer 1
Slide: Justin RogersSurface Water and Groundwater, Quantity
and Quality, in 3D, for all of Canterbury
Can this be done ….
…. yes, we can
It needs information models, services, and supercomputingYou can also read