AUTOMATED AIRCRA-OBSERVA2ONS: THEIR IMPORTANCE TO FUTURE AVIA2ON TRANSPORTA2ON OPERA2ONS - WMO LIBRARY
←
→
Page content transcription
If your browser does not render page correctly, please read the page content below
Automated Aircra- Observa2ons:
                  Their Importance to Future Avia2on
                      Transporta2on Opera2ons
  Ralph Petersen1, Bre0 Hoover1, Anne-Sophie Daloz1, Lee Cronce1, Tim Wagner1, Skyler Williams1,
               Richard Mamrosh2, Randy Baker3, Patricia Pauley4, and Nancy Baker4
   1 University   of Wisconsin-Madison, CooperaLve InsLtute for Meteorological Satellite Studies (CIMSS), Madison, WI
                              2 NaLonal Weather Service (NWS) Forecast Office, Green Bay, WI
                                         3 United Parcel Service (UPS), Louisville, KY
                          4 Marine Meteorology Division, Naval Research Laboratory, Monterey, CA

  Just as Efficient use of Weather is key to optimizing
               the Future Air Transportation System,
Global DistribuLon                                Several Years Old, but
of AMDAR Temp/                                        still interesting
WindAvailability
     ObservaLons     of Good (and Adequately Distributed)
                                                   Credit: Bill Moninger,
                                                       NOAA/ESRL
  overObservations
       24 hours         is key to Understanding Weather,
                      Now and into the Future.
AMDAR Temperature/Wind Impacts
• AMDAR Temperature and Wind data are among 3-5 most important data
  sources for global analyses across mulLple NWP centers
  •   Extremely Cost Effec*ve (Very Low Cost / High Impact)
       – AMDAR profiles could backfill for lost rawinsondes if moisture is included

         Results from 2012 WMO Data Impact Workshop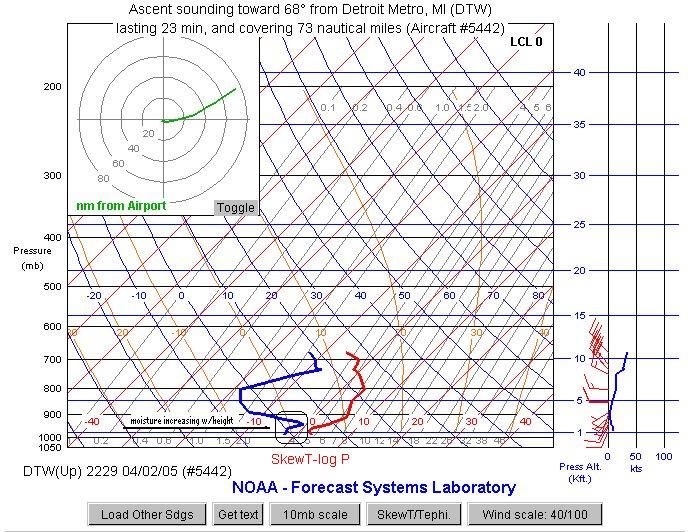
Recent Numerical Weather Prediction (NWP) Impact Tests:
   Determining the Effect of Data Distribution/Density on the
            Impact of In-situ AMDAR Observations
                  Using the operational US Navy Global Model
       Data from an 11-month period between Oct 2016 and September 2017
• The impact of AMDAR observations in the Navy Global Environmental Model
  (NAVGEM) was determined using Forecast Sensitivity Observation Impact
  (FSOI) methods (Hogan et al. 2014; Langland and Baker 2004).

   • FSOI values were computed for each observation type included in the
     operational NAVGEM.
       • The relative importance of each instrument type and variable in reducing the
         24-hr forecast error was measured by the total moist energy error norm.

           •   In these tests, the Global and Regional Impact of Temperature and Wind
               observations were determined throughout the entire atmosphere

       • Note: The Navy Global Model is tuned to optimize oceanic forecasts and relies
         more heavily on Satellite Cloud Motion Winds observations than other Global
         Forecast Centers.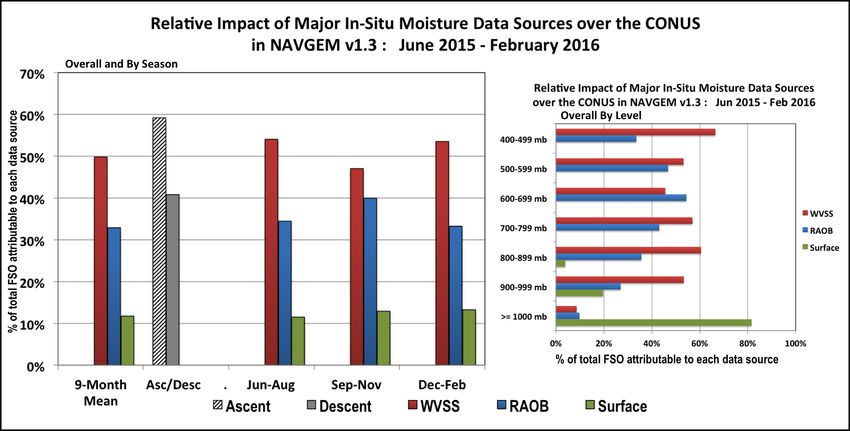
Global and Regional Impacts of AMDAR on NWP
Based on Influence of all Observation types on 24 hr. forecasts from US Navy Global Model

                                               Benchmark Map of typical daily AMDAR
                                               ObservaLon DistribuLon from October
                                               2016 – Before the US began supporLng
                                               enhanced data collecLon over South
                              Oct. 2016        America

   Assessing impact of augmenting AMDAR observations over South America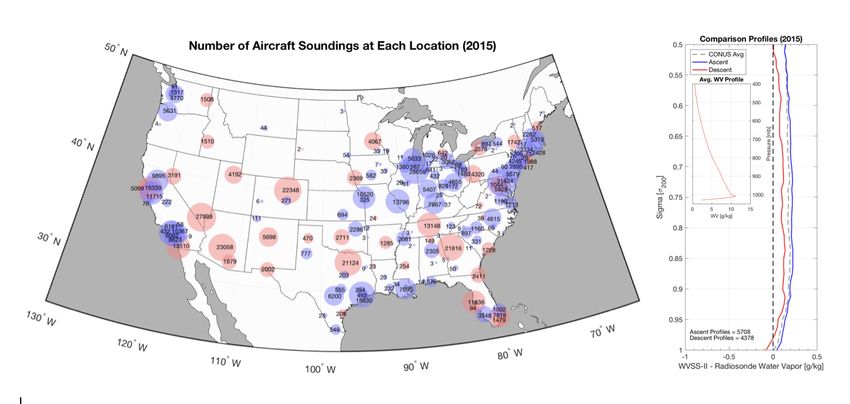
Global and Regional Impacts of AMDAR on NWP
Based on Influence of all Observation types on 24 hr. forecasts from US Navy Global Model

                                               Updated Map of typical daily AMDAR
                                               ObservaLon DistribuLon from September
                                               2016 – A_er the US began supporLng
                                               enhanced data collecLon over South
                              Sep. 2017        America

                                               The following slides will compare 2016
                                               and 2017 observaLon impacts fo 4 areasr:

                                               Globe                ConLguous US

                                                Southern Africa      South American
                                               (south of Equator)   (south of Equator)
                                                + offshore areas      + offshore areas

   Assessing impact of augmenting AMDAR observations over South America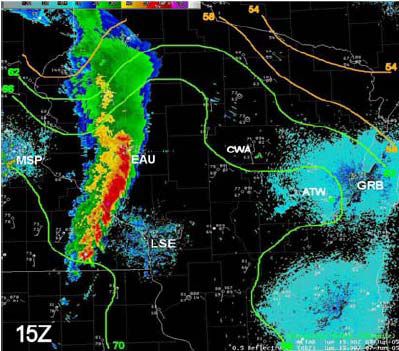
Global and Regional Impacts of AMDAR on NWP
Based on Influence of all Observation types on 24 hr. forecasts from US Navy Global Model

                                                     US

                               Sep. 2017
                               Oct. 2016

                     So. Af.                              So.
                                                          Am.

   Assessing impact of augmenting AMDAR observations over South America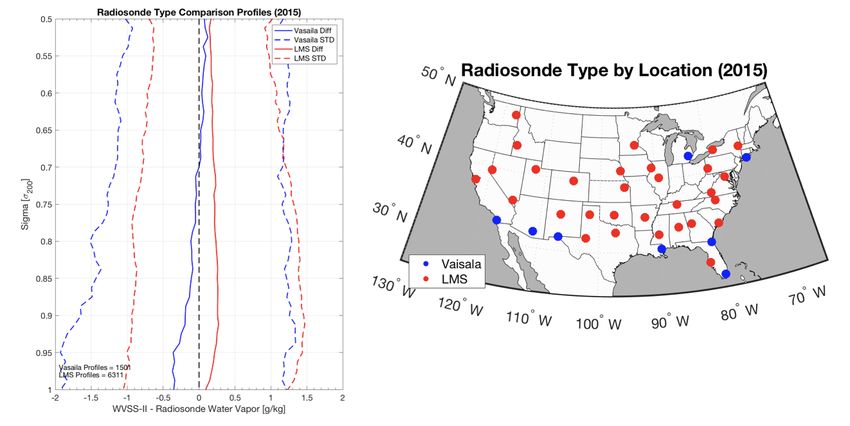
Global and Regional Impacts of AMDAR on NWP
Influence of all Observation types on 24 hr. US Navy Global Model Forecasts – Oct 2016

               In Oct. 2016, Aircra-                   Over data-dense US, Aircra-
             Observa2ons were the 6th                  Observa2ons were the most
            most important data source                   important data sources
            Globally in the Navy Model

            Over less-AMDAR-rich Southern Africa,        Over South America, lack of
              Aircra- Observa2ons had greater           Aircra- Observa2ons reduced
                   impact than Radiosondes              their importance substan2ally

   Oct. 2016 - Before increase in AMDAR observations over South America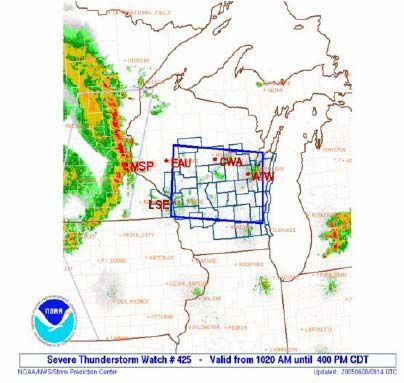
Global and Regional Impacts of AMDAR on NWP
Influence of all Observation types on 24 hr. US Navy Global Model Forecasts – Sept 2017

              Globally, Aircra- Observa2ons            Over data-dense US, Aircra-
             remain in group of 6 major data            Observa2ons are again the
               sources, but increase impact            most important data sources

            Over less-data-dense Southern Africa,       Over South America, abundant new
              Improved distribu2on of Aircra-          Aircra- Observa2ons have become the
             Observa2ons increases impact over               most important data source
               Radiosondes and Surface Obs.

    Sep. 2017 - After increase in AMDAR observations over South America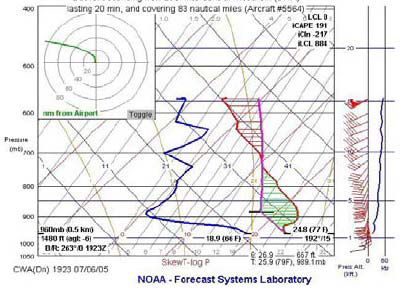
AMDAR Temperature/Wind Impacts
• AMDAR Temperature and Wind data conLnue to be among 4-5 most
  important data sources for global assimilaLon across mulLple NWP centers
  •     Having sufficient AMDAR data density is essenLal to improving analyses and
        0-48 hour forecasts
         – Requires only air-to-ground communica*ons support
         – Major impacts on parameters important to flight planning
             • Temperature and Winds

Refs:

Petersen, 2017: On the impact and future benefits of AMDAR observations in operational forecasting - Part 1: Temperature and Wind Observations –
BAMS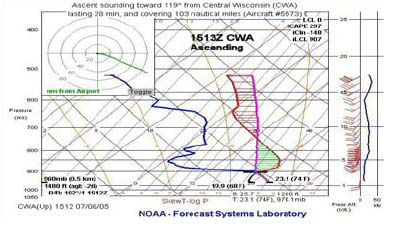
Measuring AMDAR Impacts
• AMDAR Temperature and Wind data conLnue to be among 4-5 most
  important data sources for global assimilaLon across mulLple NWP centers
   •   Extremely Cost EffecLve (Cost/Impact)
        – Profiles could backfill for lost rawinsondes if moisture is included
• Large number of moisture profiles now available over US
   • Greater impact expected at shorter Lme ranges and in local areas
       • Useful for subjec*ve Nowcasts as well as NWP
Measuring AMDAR Impacts
• AMDAR Temperature and Wind data conLnue to be among 4-5 most
important data sources for global assimilaLon across mulLple NWP centers
• Extremely Cost EffecLve (Cost/Impact)
– Profiles could backfill for lost rawinsondes if moisture is included
• Large number of moisture profiles now available over US
• Greater impact expected at shorter Lme ranges and in local areas
• Useful for subjec*ve Nowcasts as well as NWP
Typical Daily US
AMDAR WVSS
(Water Vapor Sensing System)
Humidity Profiles
• Currently, 135 WVSS-equipped
aircraR in US
• 700+ Profiles/day
• ~10 WVSS aircraR in
Europe (E-AMDAR)Forecaster Impacts: Using real-Lme aircra_ T/Q profiles
in NowcasLng where
Convec2ve Storms will and will not develop
• Central Wisconsin, 6 July 2005 (Example used TAMDAR ObservaLons)
• Linear mesoscale convecLve system expected to persist into Wisconsin
• Severe thunderstorm watch was iniLally issued at 1530 UTC for most of Central
WisconsinForecaster Impacts: Using real-Lme aircra_ T/Q profiles
in NowcasLng where
Convec2ve Storms will and will not develop
• Aircra_ soundings from watch area showed a persistent strong capping
inversion that appeared unlikely to break
• Forecasters lowered the chance for storms and the severe thunderstorm
watch was cancelled
• Storms dissipated before reaching central Wisconsin
1513 UTC 1923 UTCForecaster Impacts: Using aircra_ T/Q profiles in
NowcasLng Low Ceilings, VisibiliLes and Fog
• Detroit, Michigan, 4 February 2005
• Soundings near 2230 UTC showed light boundary layer winds, near-
surface moisture, dryness above
• Favorable condiLons for fog development (Pe0erssen, 1940s)
• Based on the observaLons, the
TAFs for 09 and 12 UTC were
amended, reducing visibiliLes to ½
mile.
• METARS showed that visibiliLes
remained below ¼ mile
KDTW 0532z 00000kt 2sm br clr
KDTW 0739z 17003kt 1 3/4sm br r04/
1000v3500
KDTW 0936z 17004kt 1/4sm fg r04/
0500v0600
KDTW 1154z 16004kt 1/4sm fg r04/
2800v0600Measuring AMDAR Moisture Impacts
• AMDAR Temperature and Wind data are among 4-5 most important data
sources for global assimilaLon across mulLple NWP centers
• Extremely Cost EffecLve (Cost/Impact)
– Profiles could backfill for lost rawinsondes if moisture is included
• Large number of moisture profiles now available over US
• Greater impact expected at shorter Lme ranges and at mesoscale
• Useful to forecasters (and NWP)
Refs:
Petersen, Cronce, Mamrosh, Baker and Pauley, 2017: On the impact and future benefits of AMDAR observations in operational forecasting - Part 2: Water
Vapor Observations – BAMSWVSS-to-RAOB Validation Results
Summary of 3-Season Humidity Inter-comparisons - 2009-2010
All observations – All Levels
Random Differences (Including Dry/Moist Environments):
Differences between aircraft data and rawinsonde reports generally showed
variability of 0.3 to 0.8 g/kg from the surface to 600 hPa – decrease aloft.
StDev less than 3-hour variability between bounding rawinsonde reports.
Systematic Differences showed
Small positive Bias across all RH rangesRecent WVSS-to-Operational-RAOB Comparisons
Summary of year-long Humidity Inter-comparisons - 2015
• All US Sites, Mul*ple airlines
• Opera*onal NWS RAOBS
• Two manufacturers
• Same Matchup criteria
• Within 30 minutes and 50 km
• Results validate special tests
• Two US RAOBs provide similar results
Upper atmospheric comparisons show
moister results in region of suspect
radiosonde accuracy.
- - Important for managing Contrails, . . . - -Inter-Comparisons amongst co-located WVSS Aircraft
ApproximaLng RepresentaLveness Error using WVSS-II SH ObservaLons
RMS calculated for:
Time (and distance)
ranges of
0-15, 15-30, 30-45,
and 45-60 minutes (km) ~0.16 g/kg
RMS Differences show (ALL reports, All Seasons):
Moisture Variability more than doubles from 0-15 to 30-45 minute intervals
Because the Total Variability is made up of two parts:
1) Instrument Error and 2) Atmospheric Variability
Projecting to exact co-locations ( ΔT=0 and ΔX=0 ) , Δq~0.16 g/kg
This is substantially better than WVSS-II vs. Rawinsonde Std. Dev. (top)Inter-Comparisons amongst co-located WVSS Aircraft
ApproximaLng RepresentaLveness Error using WVSS-IIeSHa2 onally
ObservaLons
r
il ab l e op
be s t ava t u re.
et he the f u
y to b i n t o n d o m)
ar e likel ow and * c and ra
a2 on s u r c e , n y s t em a
l e t h at i s
b erv
sfor: ata s o rrors ( s
varia b
S O
RMS calculated r e d re e y s i s
WVS moist
u
tem peratu
o i s tu r
l
e ana serva*on
R i rcra e am i ty Ob
i n a u s i d
Time (and distance)
o f er rors
t i s vi tal to pecific Hum
ranges cof i n fl u ence n a l y s es, i W V SS S
e del a n a *v e
redu 30-45,
0-15,To15-30, a l m o t h e
n u m eric t en t with
n
and 45-60 iminutesco(km) ns i s
~0.16 g/kg
RMS Differences show (ALL reports, All Seasons):
Moisture Variability more than doubles from 0-15 to 30-45 minute intervals
Because the Total Variability is made up of two parts:
1) Instrument Error and 2) Atmospheric Variability
Projecting to exact co-locations ( ΔT=0 and ΔX=0 ) , Δq~0.16 g/kg
This is substantially better than WVSS-II vs. Rawinsonde Std. Dev. (top)Measuring AMDAR Moisture Impacts
• AMDAR Temperature and Wind data conLnue to be among 4-5 most
important data sources for global assimilaLon across mulLple NWP centers
• Extremely Cost EffecLve (Cost/Impact)
– Profiles could backfill for lost rawinsondes if moisture is included
• Large number of moisture profiles now available over US
• Greater impact expected at shorter Lme ranges and at mesoscale
• Useful to forecasters (and NWP)
• Aircra- Water Vapor Measurements are high quality (Bias and Std. Dev. small)
• Can fill a-synop*c data voids over land
Refs:
Petersen, Cronce, Mamrosh, Baker and Pauley, 2017: On the impact and future benefits of AMDAR observations in operational forecasting - Part 2: Water
Vapor Observations – BAMS
Hoover, Santek, Daloz, Zhong, Dworak and Ralph A. Petersen, 2016: Forecast Impact of Assimilating Aircraft WVSS-II Water Vapor Mixing Ratio
Observations in the Global Data Assimilation System – In Press –AMS - Weather and Forecasting,
Petersen, R., L. Cronce, R. Mamrosh, and R. Baker, 2015: Impact and benefits of AMDAR temperature, wind, and moisture observations in operational
weather forecasting. WMO Technical Report 2015-01, 93 pp.NWP Impacts: Determining the Relative Contribution of
In-situ Moisture Observations in the operational NAVGEM v1.3
Data from a 9-month period from June 2015 – February 2016
• The impact of WVSS observations in the Navy Global Environmental Model
(NAVGEM) was determined using Forecast Sensitivity Observation Impact
(FSOI) methods (Hogan et al. 2014; Langland and Baker 2004).
• FSOI values were computed for each observation as part of operational
NAVGEM.
• All observations and variables were summed over a specified period to provide
a measure of the relative importance of each instrument type in reducing the
24-hr forecast error, as measured by the total moist energy error norm.
• Global impact of WVSS observations concentrated in CONUS was relatively small
• Regional impacts over CONUS were large
• Consistent across seasons
• Important through entire troposphereNWP Impacts: Determining the Relative Contribution of
In-situ Moisture Observations in the operational NAVGEM v1.3
Data from a 9-month period from June 2015 – February 2016
Impact Calculated as Percentage of Total FSOI attributable to each data source.
• WVSS data dominate at all seasons and all levels except surface & 600-700hPa.
• Ascent profiles have more impact than descent, but impact per ob. ~ equalFurther tests of WVSS Specific Humidity Impacts for multi-season
experiments in NCEP’s Global Data Assimilation System
In coordination with the National Center for Environmental Prediction (NCEP),
WVSS SH observations were added to the Global Data Assimilation System
(GDAS) and Global Forecast System (GFS) - Hoover et al. (2017)
• Tests for both warm (April – May 2014) and cold seasons (Dec. 2014 – Jan. 2015)
• WVSS Observations were used in Native Form (Specific Humidity)
• Avoided detrimental effects to variable AMDAR Temperature biases
• Negligible additional QC or analysis system changes were needed
Impacts of WVSS observations were based on a board set of diagnostics
Impacts on Analyses: Impacts on PrecipitaDon Forecasts:
• Improvements at most threshold
Impacts larger in warm season with • Most impacts for large amounts
greater moisture variability
• Few are staDsDcally significant
WVSS obs:
• Note: PrecipitaDon scores reflect
1 - Improve ROAB fits integrated deficiencies full model
2 - Fit analysis background be\er precipitaDon process, not just moisture
than RAOBs fields – Use a more direct approachCompare forecasts to GPS/TPW Observa2ons for Mul2-Season Tests Blue – Control – no WVSS Random Error - Bias SystemaLc Error - StDev Red – Experiment with WVSS A More Direct Approach 5% and 95% confidence limits shaded. Dots indicate statistically significant differences between the experiment and control When used in combinaLon with ROABS over CONUS, WVSS observaLons: • Had larger impacts larger in warm season • Increased known seasonally-variable GFS dry bias • Reduced Random errors - out to 66hrs in warm season
Error in forecasts rela2ve to GPS/TPW Observa2ons for Mul2-Season Tests

                                                                                        Warm Season (April 2014 – May 2014)
 Blue – Control – no WVSS          SystemaLc Error - Bias   Random Error – Std Dev
 Red – Experiment with WVSS

 5% and 95% confidence limits
 shaded.

 Dots indicate statistically
 significant differences between
 the experiment and control

    When used in
  combina2on with
 ROABS over CONUS,
 WVSS observa2ons:

                                                                                     Cold Season (Dec. 2014 – Jan. 2015)
• Had larger impacts
  larger in warm
  season
• GFS Random Errors
  were reduced out to
  66hrs (warm season)
• GFS integrated dry
  bias observed during
  tests presisted
WVSS Impact on Random Errors in GFS Analyses for Warm Season Period
WVSS impacts on GDAS random integrated moisture errors were posi2ve across all
moisture ranges. Largest impacts occurred:
• In areas with ‘mid-ranges’ of moisture – about 85% of cases
• At loca*ons with large amounts of water vapor
• Smallest impact for least amounts of TPWWVSS Impact on Random Errors in GFS Analyses for Warm Season Period
WVSS impacts on GFS random integrated moisture forecast errors were also posi2ve and
most apparent:
• At shortest forecast ranges
• >1% Reduc*on in Random Error out to 42 hours
• Majority of GPS sites showed improvements at ALL forecast lengths
What is the distribu*on of moisture changes over forecast *me?
Throughout the 48 hour
forecast period, impacts
of the added WVSS
observa2ons:
• Decrease with
forecast 2me
• Few negaDve impacts
• Posi2ve TPW impacts
remain concentrated
in 10-30 mm range
• Large, but less well
organized posi2ve
impacts at high TPWs
Overall TPW > 60mmWVSS Impact on Random Errors in GFS Analyses for Warm Season Period
WVSS impacts on GFS random integrated moisture forecast errors were also posi2ve and
most apparent:
• At shortest forecast ranges
• >1% Reduc*on in Random Error out to 42 hours
• Majority of GPS sites showed improvements at ALL forecast lengths
What is the distribu*on of moisture changes over forecast *me?
Throughout the 48 hour
forecast period, impacts
of the added WVSS
observa2ons:
• Decrease with
forecast 2me
• Few negaDve impacts
• Posi2ve TPW impacts
remain concentrated
in 10-30 mm range
• Large, but less well
organized posi2ve
impacts at high TPWs
Overall TPW > 60mmTests removing 10 RAOBS - Error in forecast fit-to-GPS/TPW Observa2ons
An Extreme Test
Blue – Control – no WVSS Warm Season (April 2014 – May 2014)
Red – Experiment with WVSS
SystemaLc Error - Bias
Green – Experiment with WVSS but withholding
10 RAOBS
5% and 95% confidence limits shaded.
Dots indicate statistically significant differences
between the experiment and control
When used in combina2on with
reduced set of ROABS over
CONUS in the warm season,
WVSS observa2ons:
Random Error – Std Dev
• Foreast Errors out to 42hrs
were essen2ally unchanged
• Seasonally-variable GFS dry
bias s2ll persists
• Degraded forecasts past 48 hr.
• Possibly due to errors in
moisture fields or lack of
dynamical informaDon in
upper-trop/lower-stratNow starLng a Less Extreme Test –Removing only “Special Off-Time” RAOBs
ObjecDve - Determine if savings from reduced
supplemental RAOBS could save resources
without jeopardizing forecast accuracy• AMDAR Temperature and Wind data are among 4-5 most important data
sources for global assimilaLon across mulLple NWP centers
• Extremely Cost EffecLve (Cost/Impact) – Easy to expand
• Large number of moisture profiles now available over US
• Greater impact expected at shorter Lme ranges and at mesoscale
• Useful to forecasters (and NWP)
• Aircra- Water Vapor Measurements are high quality
• Can fill a-synop*c data voids over land
• AMDAR WVSS observa2on have posi2ve impacts in NWP
• Forecast improvements extend beyond 48 hours
Similar improvements are expected in other areas of the globe as data
coverage increases spa2ally and temporally• AMDAR Temperature and Wind data are among 4-5 most important n g data
miz i
sources for global assimilaLon across mulLple NWP
p ticenters
o
• Extremely Cost EffecLve (Cost/Impact) – Easy to k e y
expandt o ,
r is s t e m e d )
• Large number of moisture profiles now a e
thavailable n S y
over US ibu t
W e t a t io i s t r r,
• Greater impact expected e o f
at shorter
p or
Lme ranges l and
y D at mesoscale
at h e
t u s a n s u a te W e
• Useful to forecasters
i c i e n (and
ir T rNWP)
d e q d i n g
E f f re AMeasurements
n d A s t a nquality
• Aircra-
s t a s Water
u tVapor
u d (a d
are
e r high
r e .
u
J • Canthfillea-synop*cF G o
o voidstoover
data n
U land Fut u
y o f e y t he
b il i t is k n o
tposi2ve
• AMDAR i l a WVSS
io
observa2on
n s d i
have impacts in NWP
A•vaForecast
er v a t
improvements o w a n beyond 48 hours
extend
O b s N
Similar improvements are expected in other areas of the globe as data
coverage increases spa2ally and temporally
Thank you QuesLons?You can also read