Hampshire COVID-19 weekly datapack - 3rd February 2021 - Produced by the Public Health Team and the Insight and Engagement Unit - Hampshire County ...
←
→
Page content transcription
If your browser does not render page correctly, please read the page content below
Hampshire COVID-19 weekly datapack
   3rd February 2021

   Data correct as of 2nd February 2021 but subject to revision

Produced by the Public Health Team and the Insight and Engagement Unit
What do weekly case rates per 100,000 population tell us about COVID-19 activity in England?
              Weekly rate: Week 2, 17th January 2021                                                 Weekly rate: Week 3, 24th January 2021

                                                                                          Source: Weekly Coronavirus Disease 2019 & Influenza (COVID-19) Surveillance Report
Overall case rates and Pillar 2 positivity continued to decrease in week 3. Pillar 1 positivity decreased slightly in week 3. The case rates decreased in all PHE Centres in
week 3. Case rates decreased across all age groups in week 3. By ethnicity, case rates remain highest in other ethnic groups and decreases were noted across all ethnic
groups.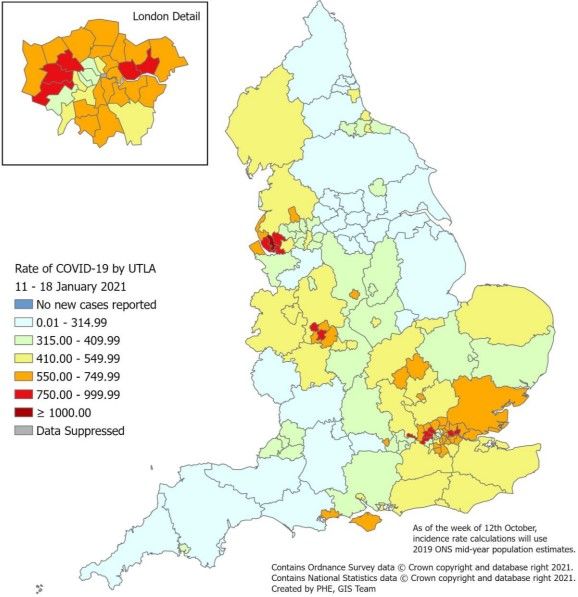
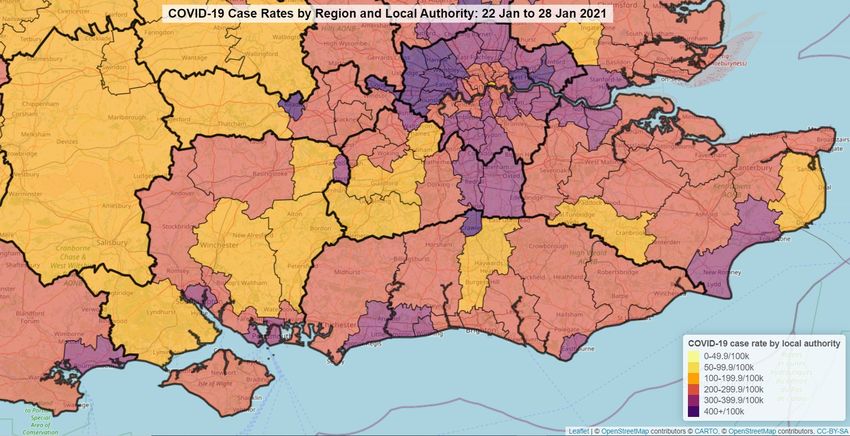
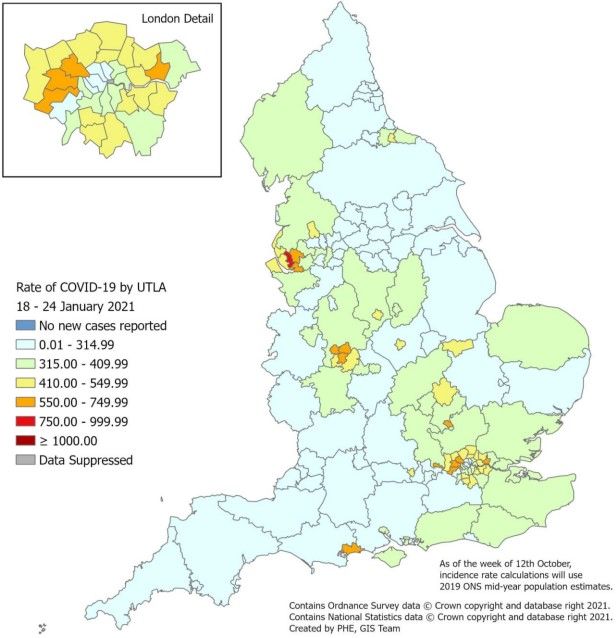
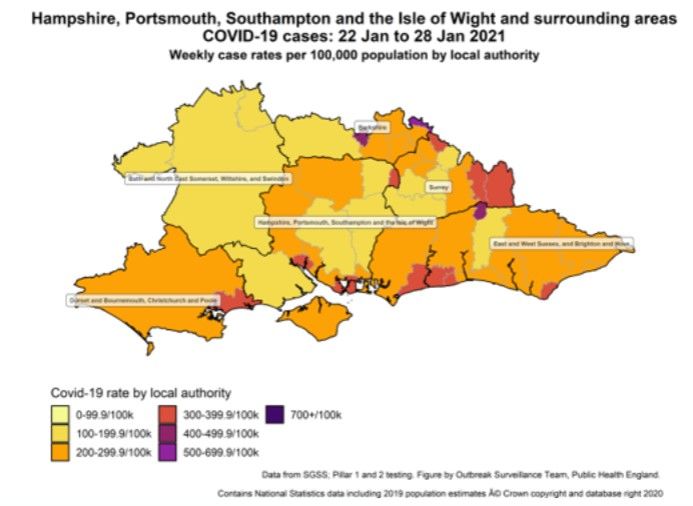
What do weekly case rates tell us about COVID-19 activity across South East regional local authorities?

                                                                                    Reproduction number (R) and growth
                                                                                    rate of COVID-19, 29th January 2021

                                                                                             Source: The R number in the UK

 Case rates across the South East have begun decrease.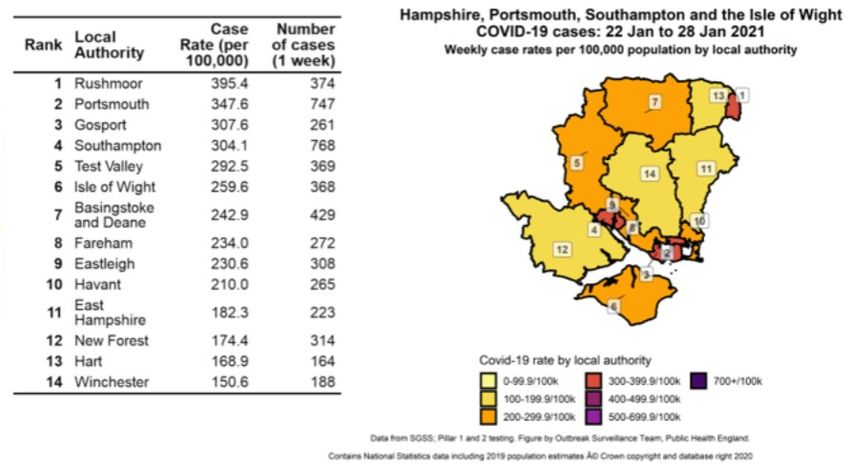
What do weekly cumulative case rates tell us about COVID-19 activity across ceremonial Hampshire?

Trends suggest a slowing in the rise of infection rates across ceremonial Hampshire. Portsmouth City Council authority area has the
highest cumulative case rate as of the 28th January 2021, although it is lower than the England rate.
What do daily cases tell us about how the epidemic is progressing over time in Hampshire?
 During wave 1 only Pillar 1 (NHS/PHE laboratories) testing was available, this included people admitted to hospital and
 later people living or working in a health or care environment. Widespread Pillar 2 community testing (Government's
 commercial testing partners) began on 14th July 2020 and since then the data includes both testing Pillars. Due to these
 different testing strategies, it is not possible to directly compare case numbers between wave 1 and wave 2.                 Caution: There is a data lag with more test results expected for
                        Data only includes those cases which have tested positive                                             the most recent week.

                                                                                                                                              1659 cases

                                                                                                                                          386 cases

                                         144 cases

                                                                                                                                                                                     Subject to
                                                                                                                                                                                     revision

                                                                                                                      Source: PHE dashboard (Last updated on 1st February 2021)
There is a decrease in daily cases suggesting that the spread of the virus is reducing. Over the epidemic, there have been 55,490 case
detections in Hampshire.
                                                                                                                                                              Please note the five-day lag
                                                                                                                                                              for data quality purposes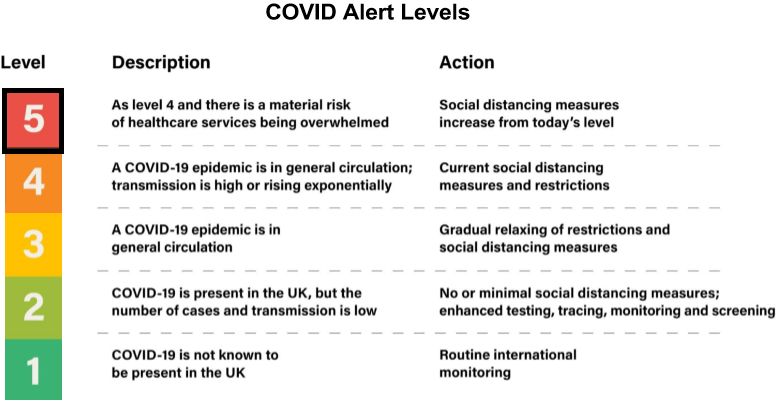
What do weekly COVID-19 case rates tell us about COVID-19 activity across Hampshire Districts?
     7 day case rate per 100,000 for Districts and Unitary Authorities: 22 nd to 29th January 2021

                 Further detailed county and district case numbers and rates can be accessed from the Public Health Hampshire Districts COVID-19 Cases and Mortality Report

Although case rates still remain high, this past week they have decreased further across all Hampshire Districts, although to varying
degrees. Other areas in the South East also show decreasing case rates.
                                                                                    Please note that these are crude rates and do not take
                                                                                    account of the age/sex/socio-economic/casemix profile of
                                                                                    the district populations. Also, district figures are subject to
                                                                                    large statistical fluctuation due to the smaller populations
What do the trends in weekly all age case rates tell us
about overall COVID-19 activity across Hampshire Districts?

Daily rates of COVID-19 cases per 100,000 population in districts up to 28 th January 2021

                                                                                                                                    7-day rates per 100,000, 27th January 2021
                                                                                                                                    England                               294.2
                                                                                                                                    South East                            273.1
                                                                                                                                    London                                355.1
                                                                                                                                    Hampshire (3,324)                     240.4
                                                                                                                                    Southampton                           337.4
                                                                                                                                    Portsmouth                            373.7
                                                                                                                                    IOW (415)                             292.7

                                                                                Data source: PHE Line List data analysis and PHE dashboard (Last updated on 1st Feb)
Trends suggest a decrease in all age COVID-19 case rate activity across all Hampshire Districts. At 395.35 per 100,000 population, Rushmoor had the
highest 7-day case rate. Gosport the 2nd highest rate (307.65 per 100,000 population) in the period 21st to 28th January 2021.
                                                                                       Please note that the charts on this page show
                                                                                       rates of cases per 100,000. Also, district figures
                                                                                       are subject to large statistical fluctuation due to
                                                                                       the smaller populations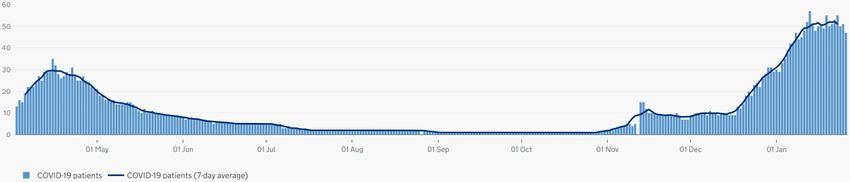
What do trends in the over 60s weekly case rates tell us about
COVID-19 activity across Hampshire Districts?

Daily rates of COVID-19 cases in the over 60s per
100,000 population in districts up to 29 th January 2021

                                                                                                                                       Data source: PHE Line List data analysis

Trends suggest a slowing down or decrease in COVID-19 activity in the over 60s across most Hampshire districts, apart from Test Valley which has seen a
recent increase. At 367.57per 100,000 population, Test Valley borough had the highest over 60s weekly case rate in the period up to 29 th January 2021.

                                                                Please note that the charts on this page show rates of cases
                                                                per 100,000. Also, district figures are subject to large statistical
                                                                fluctuation due to the smaller populations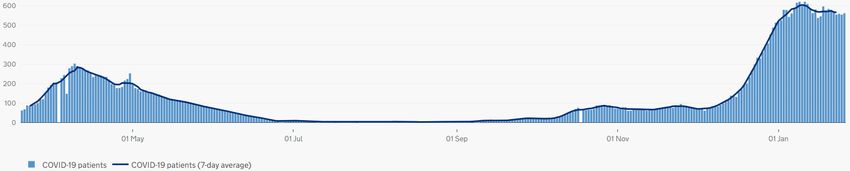
Which age group is most affected in Hampshire?

                                                                                                        Source: PHE dashboard (Last updated on 1st February 2021)
Cases rates are still high in the majority of age groups. Age demographics of case data suggest highest transmission rates (400+ per
100,000 population) in people aged 20-34 years and 85 years and over.

                                                   Please note that these data are experimental and therefore
                                                                                                                                                  9
                                                   subject to change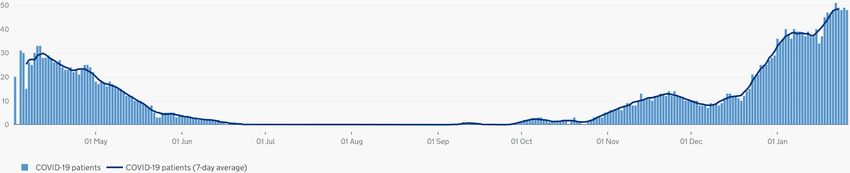
How have weekly COVID-19 cases changed across Hampshire Districts?
                                                   Weekly percentage change, comparing to the previous non-overlapping 7-day period
                        27 January 2021    26 January 2021    25 January 2021   24 January 2021        23 January 2021       22 January 2021                          21 January 2021
England                            -30.4              -29.5              -27.4               -25.3                 -23.2                -22.5                                    -20.6

Isle of Wight                      -38.3               -37.2                      -37                    -37.7                       -39.7                   -42                    -40.4

Hampshire                          -32.8               -33.7                    -30.2                    -27.7                       -28.5                 -28.1                    -25.1

Basingstoke and Deane              -31.6               -35.2                    -34.9                    -28.9                         -30                 -26.4                    -20.3
East Hampshire                     -31.4                 -31                    -24.5                    -32.3                       -28.1                 -23.2                    -21.7
Eastleigh                          -34.8               -34.4                    -43.1                    -42.2                       -40.3                 -34.3                    -24.7
Fareham                            -25.8               -25.7                    -29.1                    -19.5                       -23.2                 -30.8                    -29.5
Gosport                            -10.8               -15.5                    -17.1                    -18.7                       -21.8                 -20.4                    -23.6
Hart                               -48.8               -55.7                    -35.7                    -36.6                       -37.2                 -41.1                    -48.7
Havant                               -41                 -45                    -39.6                    -35.3                       -38.7                 -38.4                    -34.7
New Forest                         -34.3                 -32                    -21.6                    -18.9                       -19.1                 -20.4                    -19.7
Rushmoor                           -44.1               -40.6                    -36.8                    -30.5                       -27.6                 -28.8                    -27.1
Test Valley                           -7                -3.7                     -4.7                     -0.7                        -5.5                 -16.1                     -7.9
Winchester                         -40.9               -41.8                    -28.7                    -33.6                       -37.2                 -25.7                    -13.7

                                                                                                                                             Data source: https://coronavirus.data.gov.uk

 Cases are decreasing across all Hampshire Districts representing decreasing trends in infection. Hart, Havant, Rushmoor and Winchester have seen a 40%+
 decrease in weekly infections. The largest percentage change in Hampshire weekly cases was in Hart (down 48.8% on the previous week).

                                              Please note that the table on this page shows the percentage change, as a
                                              percentage of the previous non-overlapping seven day count, and factors the
                                              five-day lag for data quality purposes. The change in the seven day count by
                                              district is subject to large statistical fluctuation due to the smaller populations.
What do trends in COVID-19 patients admitted to hospital tell us about healthcare activity across Hampshire?
Hampshire Hospitals NHS Foundation Trust – 249 patients in hospital Portsmouth Hospitals University NHS Trust – 425 patients in hospital
Frimley Health Foundation Trust – 561 patients in hospital University Hospital Southampton NHS Foundation Trust – 276 patients in hospital
Isle of Wight NHS Trust – 78 patients in hospital
Data source: https://coronavirus.data.gov.uk/details/healthcare as of 1st February 2021
Overall, trends in new COVID-19 admissions are beginning to slow in all Trusts, apart from Hampshire Hospitals, hospital occupancy is still high, indicating
continued intense healthcare activity across Hampshire. Hospitals continue to be overwhelmed due to the onset of the second wave combined with seasonal
winter pressures.
Please note that the charts on
this page show actual
numbers of hospitalised casesWhat do trends in COVID-19 patients in mechanical ventilation beds tell us about healthcare activity across Hampshire?
Hampshire Hospitals NHS Foundation Trust – 19 patients on ventilation Portsmouth Hospitals University NHS Trust– 47 patients on ventilation
Frimley Health Foundation Trust – 48 patients on ventilation University Hospital Southampton NHS Foundation Trust – 47 on ventilation
Isle of Wight NHS Trust – 8 patient on ventilation
Data source: https://coronavirus.data.gov.uk/details/healthcare as of 1st February 2021
Trends across the trust are mixed, the overall number of COVID-19 patients in mechanical ventilation beds in critical care units (CCU)
across Hampshire remains high. The need to avoid CCUs being overwhelmed is a key factor in significant policy decisions, including
regional and national ‘lockdowns’.
Please note that the charts on
this page show actual
numbers of hospitalised casesWhat do trends in excess deaths tell us about the COVID-19 mortality experience across Hampshire?
Hampshire deaths per week over 2020 to 22nd January 2021 compared with 2015-2019 five-year average
Source: PHE ONS- Deaths registered weekly in England and Wales, provisional
Further detailed county and district mortality data can be accessed from the Public Health Hampshire Districts COVID-19 Cases and Mortality Report
In Hampshire excess (extra) deaths have now risen above the five-year weekly average we would usually see at this time of year, for the
fifth consecutive week. Sadly, 2,039 people have so far died of COVID-19, with 208 deaths reported over the latest week.
Please note that whilst District data tends to mirror the
Hampshire trend, data at this level is subject to large
statistical fluctuation due to the smaller populations.The COVID-19 alert level and Tiering indicators – Hampshire summary 22nd to 28th January 2021
The Joint Biosecurity Centre’s COVID-19 alert level - On the 5th of January 2021 England was moved into
alert level 5. The top alert level means “transmission is high or rising exponentially” and health services are
at risk of being overwhelmed. National lockdown has been imposed including the closing of all schools until
at least mid-February the tier system is therefore suspended.
The Joint Biosecurity Centre Tier allocation indicators - The JBC’s Tiering allocation is separate and
independent of its alert level system. As we are now in national lockdown an update on these indicators for
Hampshire is provided below for reference as they provide a picture of what is happening with the virus in
local areas:
1. Case detection rates in all age groups - The overall Hampshire and all lower tier local authority COVID-19 all age weekly case detection rates still remain high but are
decreasing in all districts. Rushmoor has the highest rate of 395.4 per 100,000, followed by Gosport, 307.6 per 100,000 and Test Valley, 292.5 per 1000,000.
2. Case detection rates in the over 60s - The overall Hampshire and lower tier local authority COVID-19 weekly case detection rates in the 60+ have decreased across most
Hampshire districts, apart from Gosport and Test Valley. Rushmoor has the highest over 60s rate of 325.4 per 100,000 followed by Test Valley, 275.8 per 100,000.
3. The rate at which cases are rising or falling –Hampshire is experiencing a decrease in cases in all districts, the largest percentage change was in Hart (down 48.8% on the
previous week).
4. Positivity rate (the number of positive cases detected as a percentage of tests taken) –Weekly positivity rates have decreased in all districts. Rushmoor has the highest
positivity (12.4%), followed by Basingstoke and Deane (9.7%). Three districts now have a positivity below 6.5%, these are East Hampshire (5.6%), New Forest (5.7%) and
Winchester (6.1%). Note that a positive rate of less than 5% indicates that the epidemic is under control.
5. Pressure on the NHS, including current and projected occupancy – There are early signs that for Frimley and Portsmouth Hospitals, the number of new COVID-19
admissions and inpatient diagnoses may be slowing, however the overall level of hospital activity in HIOW has continued to grow, and the number of patients in hospital beds,
and in intensive care beds across HIOW continues to increase.
*Please note data for 7-day period 22nd to 28th January 2021Key messages and factors to consider………………..
• There continues to be a high number of new confirmed COVID-19 infections across Hampshire. However, the all-age rate of new infections is decreasing. The latest case rate data,
reporting the 7-day period for 22nd to 28th January, also shows a decrease in the over 60s case rate, apart from Gosport (+19%) and Test Valley (+37%). Positivity is falling across all
districts.
• The R for the South East region is estimated to be between 0.7 and 0.9 and the growth rate between -6 and -1. These revised estimates suggest case rates in the region continue to
decrease. We need to ensure that growth is reversed, and R is kept below 1 so that the prevalence and spread of disease falls to improve COVID-19 trajectory metrics, and that, ultimately,
fewer restrictions are required, and we are able to get beyond the devastating health and economic impacts of COVID-19.
• There are early positive signs that the rate of new COVID-19 cases in Hampshire has slowed, however the level of hospital activity in HIOW has continued to grow, and the number of
patients in hospital beds, and in intensive care beds, across HIOW continues to increase.
• Although falling, the percentage of cases that are compatible with the new variant is still high and remains dominant across Hampshire districts. For the period between 22nd to 28th
January, it’s highest in New Forest
• On the 5th January 2021 England was moved into alert level 5. The top alert level means “transmission is high or rising exponentially” and health services are at risk of being overwhelmed.
National lockdown was imposed including the closing of all schools until at least mid-February. National research suggested that only stringent interventions comparable to the March 2020
lockdown including school closures and mass vaccination would reduce the effective reproduction number Rt to less than 1 and reduce NHS burden.
• Decreasing all age case rates evident locally and across the South East region suggest that the national lockdown is having an effect suppressing the R. This trend needs to continue to
ensure the R is less than 1 and to ensure that the epidemic is shrinking. We need to be cognisant of the fact that the virus has not reached a peak naturally, rather polices have suppressed
the infection rates temporarily. Case rates still reflect high community transmission, so it is important that we ‘normalise and sustain COVID-19 control behaviours’ to break the chains of
virus transmission.
15Notes on the methodology
• Data is drawn from a range of sources, including:
• The official UK Government website for data and insights on Coronavirus (COVID-19) (https://coronavirus.data.gov.uk)
• The Office for National Statistics (https://www.ons.gov.uk)
• Hampshire County Council’s public health data resources (https://www.hants.gov.uk/socialcareandhealth/publichealth/jsna/covid19-data-and-intelligence)
• Due to time lags relating to testing times, data is generally shown excluding the previous five days, for the purposes of data quality
• Where rates are used, these are shown per 100,000 population
• Locally calculated rates are slightly ahead of the national data but do align
• Importantly, at lower tier local authority levels data tends to be unstable and need to be interpreted with caution!You can also read