SHORT TERM SCIENTIFIC MISSION (STSM) SCIENTIFIC REPORT - Atmospheric Electricity Network
←
→
Page content transcription
If your browser does not render page correctly, please read the page content below
SHORT TERM SCIENTIFIC MISSION (STSM)
               SCIENTIFIC REPORT
This report is submitted for approval by the STSM applicant to the
STSM coordinator

Action number: CA15211
STSM title: Intercomparing atmospheric electrical potential gradient with
GPS derived tropospheric and ionospheric properties
STSM start and end date: 15/11/2019 to 25/11/2019
Grantee name: Attila Buzás

PURPOSE OF THE STSM
The primary objective of the completed STSM was to intercompare different atmospheric
electricity and satellite quantities in order to study the coupling mechanisms between the
lithosphere, atmosphere, and the ionosphere during a larger earthquake (magnitude:
4.6). To this end, atmospheric electrical potential gradient (PG) and GPS-derived
Integrated Water Vapour (IWV) data recorded at the Emilio Serge Observatory, Mount
Hermon, Israel (33°18’30’’N, 35°47’07’’E; HRMN) were analyzed. As one of the most
important processes related to earthquakes that can cause an impact on the
atmospheric electrical field is the enhanced radon emanation from the soil, radon
measurements from HRMN were also included in the research (Pulinets and Ouzounov,
2011). Furthermore, to detect possible earthquake-related ionospheric phenomena, we
examined variations in the TEC values derived from a global model (UPC-IonSAT;
ftp://cddis.nasa.gov/gnss/products/ionex/) for the investigated area. Ultimately, water
conductivity and water level data measured in a well in Nurit, Israel (32°32’32’’N,
35°21’18’’E) were added to the research as well.
By constructing a consistent dataset we were able to investigate the lithosphere-
atmosphere-ionosphere coupling mechanisms based on several different physical
quantities in a case study. We selected a series of larger (maximal magnitude: 4.6),
shallow (depth of the largest earthquake: 8 km) earhquakes occurred in the vicinity of
the measurement sites (~70 km away from HRMN and ~40 km from Nurit, earthquake
preparation area: 95 km, Fig. 1).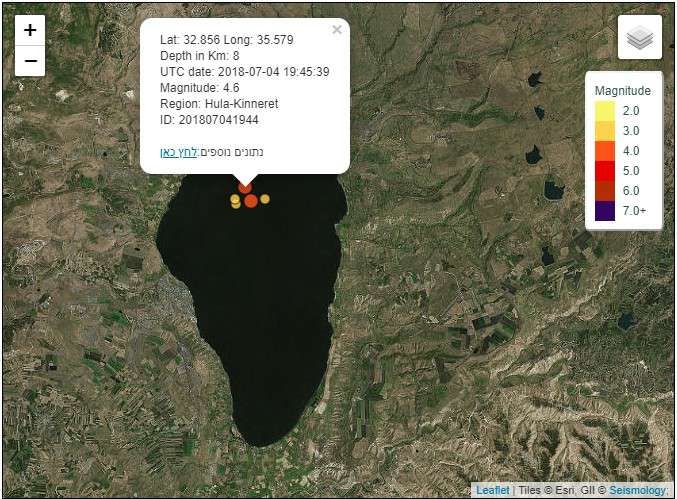
Fig. 1: The investigated earthquakes under the Sea of Galilee, Israel (Geological
Survey of Israel).
DESCRIPTION OF THE WORK CARRIED OUT DURING THE STSM
15. November 2019: arrival to Tel-Aviv, Israel. Check-in at the hotel.
16-17. November 2019: familiarizing with the literature of atmospheric electricity,
groundwater, and ionospheric earthquake precursors and the modus operandi of
IWV and TEC measurements. Checking data availability and data structure.
18. November 2019: visiting Ariel University (the host institute). Discussing the
research, i.e. which methods, data to use, selecting the nearest, large earthquake
for which data are available (Fig. 1) and collecting the appropriate data (i.e. data
from HRMN: IWV, radon counts in the air and in the ground, precipitation, PG,
TEC and data from Nurit: groundwater conductivity and groundwater level).
19-21. November 2019: writing Python scripts to build a coherent, uniform
database from all the various data.
22-25. November 2019: processing the data and applying statistical and spectral
data analysis methods on them, i.e. removing erroneous values, selecting the fair-
weather data, calculating spectrograms and periodograms. Looking for possible
earthquake-related anomalies in the data and intercomparing them with each
other.
2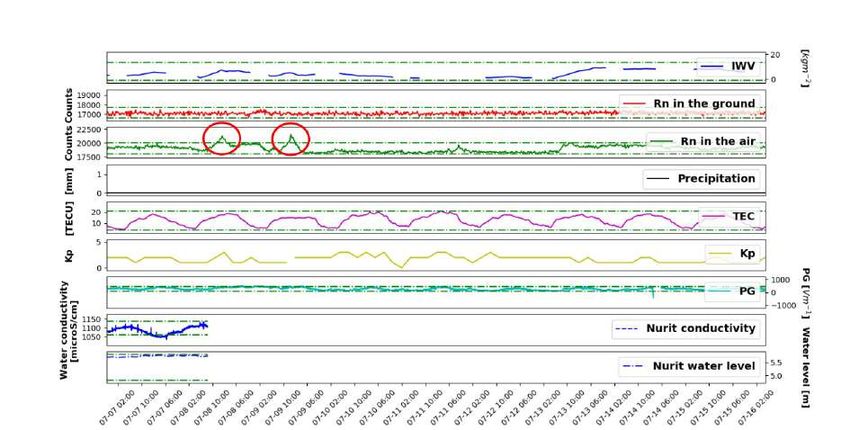
DESCRIPTION OF THE MAIN RESULTS OBTAINED
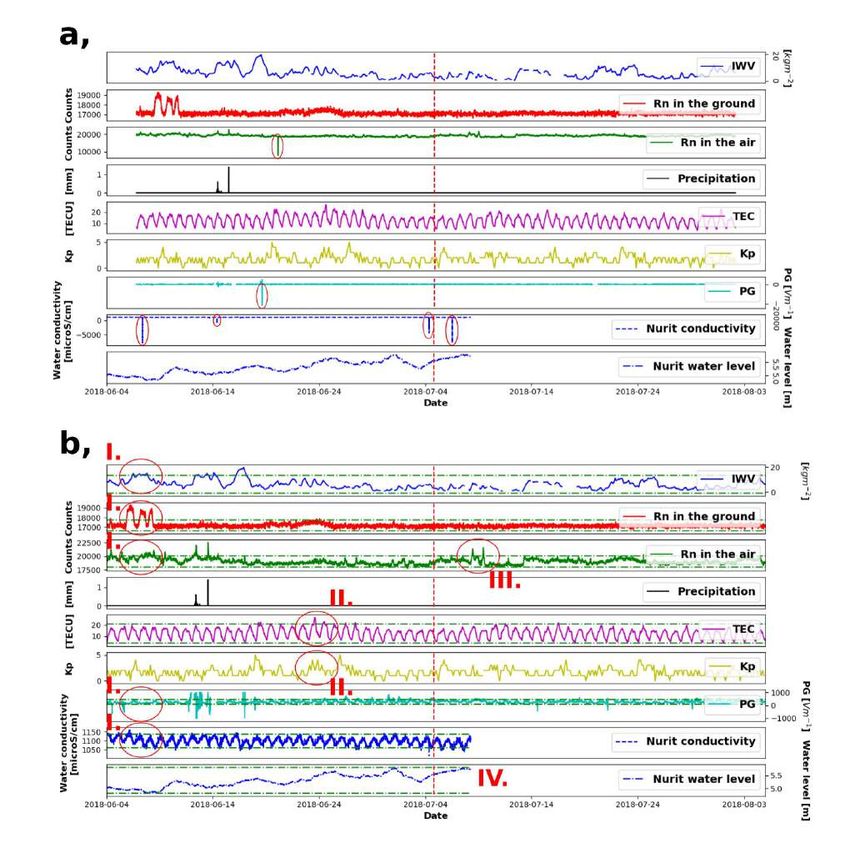
After constructing a consistent database, all the time series 30 days before and after the
earthquake occurred (04. July 2018) were plotted (please note that the Nurit
groundwater conductivity and level data were only available until 08. July 2018) ( Fig.2a).
However, there were some apparent sharp peaks in the data (denoted by red ellipses on
Fig. 2/a) which turned out to be erroneous values. These values were removed
subsequently (Fig. 2/b). There are also some data gaps where the time series were not
plotted (Fig. 2/a and Fig. 2/b).
Fig. 2: a, The raw time series. The vertical dashed red line denotes the time of the
main earthquake whereas the red ellipses mark erroneous values that were later
removed. b, The time series after the removal of the erroneous values. The
horizontal dashed-dotted green lines represent the data +- 2 σ (standard deviation)
boundaries, whereas the red circles and Roman numbers denote the investigated
anomalies.
3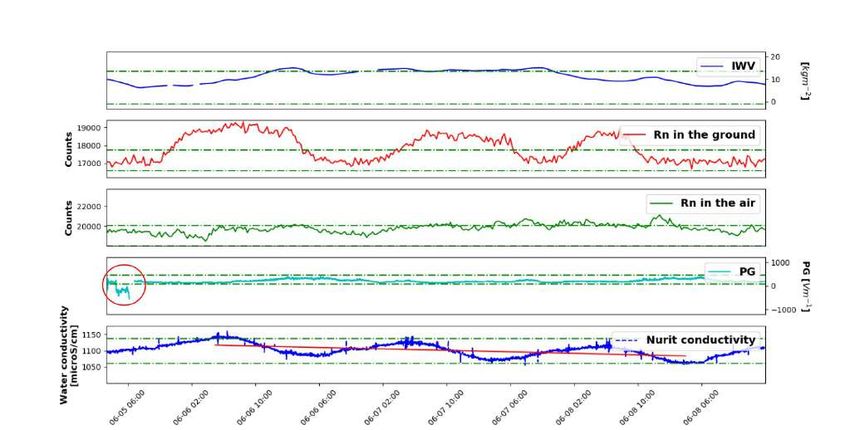
When searching for earthquake-related anomalies one has to bear in mind that
certain variations might be caused by another physical quantity. For instance, it is
important to take into consideration the precipitation as it can affect the PG and, via
the wash-out effect, the radon measurements (Fig. 2/b). Unfortunately, the proper
fair-weather selection of the PG data was not possible owing to the fact that apart
from the precipitation data, wind speed, cloud height, and other meteorological data
were not available. As for excluding any extraterrestrial effects from the TEC data
the Kp index and the X-ray flux measured by the GOES spacecraft were used.
After the preprocessing of the data four possible earthquake-related anomalies were
chosen to investigate them further:
    I. Between 05. June 2018 and 08. June 2018 (27-30 days before the
        earthquake) there are some anomalously high (i.e. surpassing the upper 2 σ
        boundary) values in the subsurface radon time series which may be a sign of
        enhanced pre-earthquake radon emanation (Pulinets and Ouzounov, 2011)
        (Fig. 2/b and Fig. 3). However, these high values are not mirrored in the
        aerial radon and PG measurements, although there is a bay-like depression
        with a magnitude of ~440 Vm-1 just before the radon enhancement in the PG
        data (red circle on Fig. 3). This negative PG anomaly is in accordance with
        some other case studies from the literature, however its duration is very short
        (~2 hours) (Silva et al., 2011).
        Simultaneously with the aforementioned anomalies there are some higher
        values in the IWV data which behavior was again reported in the literature
        and was attributed to increased evaporation due to an enhancement of
        surface latent heat flux before earthquakes (Dey et al., 2004) (Fig. 3).
        Ultimately, a decrease in the water conductivity measured at Nurit station
        was observed at the same time (R2 = 0.25, Fig. 3). This feature has been also
        reported during other earthquakes (Zmazek et al., 2002).

Fig. 3: Time series of IWV, subsurface radon, aerial radon, and water conductivity
27-30 days prior to the earthquake. The red circle denotes a bay-like depression of
the PG, whereas the solid red line on the lowest panel represents a line fitted to the
water conductivity data.
                                                                                      4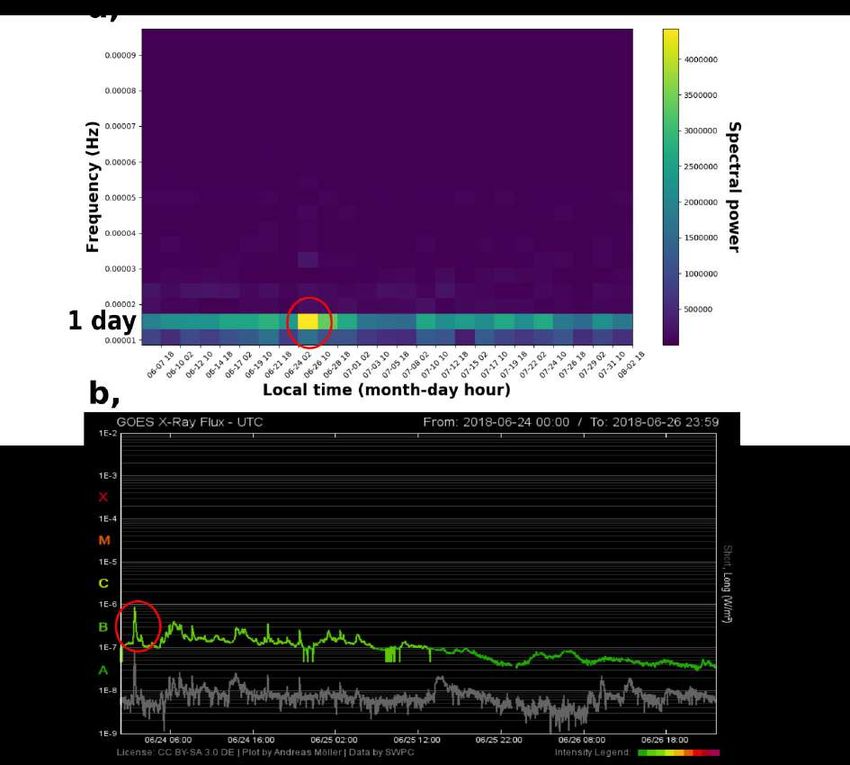
II. Approximately 11 days prior to the earthquake there is a significant
       enhancement of the TEC values (Fig. 2/b). The increase can be detected as
       a more pronounced diurnal variation at that time on the spectrogram as well
       (Fig. 4/a). Nonetheless, this might have an extraterrestrial cause as there is a
       moderate pike in the X-ray flux measured by the GOES satellite in the same
       time (Fig. 4/b) and the Kp index is a bit elevated too (Fig. 2/b).

Fig. 4: a, Fourier spectrogram of the TEC time series. b, X-ray flux measured by the
GOES spacecraft (https://www.polarlicht-vorhersage.de/goes-archive).

   III. 4-5 days after the earthquake there are two significant peaks in the aerial
        radon time series which is followed by a longer lasting depression (Fig. 5).
        There is not any feature in the other physical quantities that would seem to
        mirror this behavior (Fig. 5).

                                                                                      5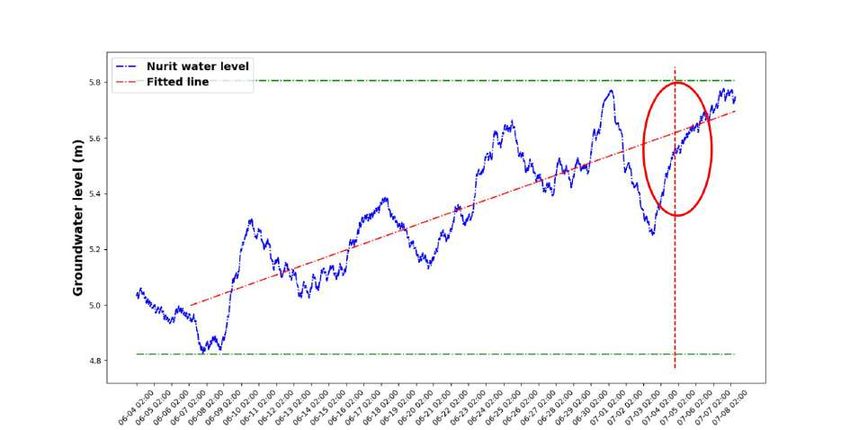
Fig. 5: Significant peaks in the aerial radon flux measurements (denoted by red
circles).

    IV. There is an apparent increasing trend in the Nurit groundwater data
        (R2 = 0.74, Fig. 6). However, the lack of meteorological data makes its
        interpretation difficult. Although, there is not a step-like change when the
        earthquake occurred as reported in the literature (Chen et al., 2013), but at
        the time of the earthquake the slope of the increasing trend changes
        (denoted by a red ellipse on Fig. 6).

Fig. 6: Nurit groundwater level data.

Ultimately, the grantee found a possible earthquake-related anomaly consistent in
multiple time series which is in accordance with the reports from the literature only in
one case from the four investigated anomalies (I. Anomaly, Fig 2/b and Fig. 3).

                                                                                       6
References
Chen, C.-H., Wang, C.-H., Wen, S., Yeh, T.-K., Lin, C.-H., Liu, J.-Y., Yen, H.-
Y., Lin, C., Rau, R.-J., and Lin, T.-W. (2013): Anomalous frequency
characteristics of groundwater level before major earthquakes in Taiwan.
Hydrol. Earth Syst. Sci., 17, 1693-1703.
Dey, S., Sarkar, S., and Singh, R. P. (2004): Anomalous changes in column
water vapour after Gujarat earthquake. Advances in Space Research, 33,
274-278.
Pulinets, S. and Ouzounov, D. (2011): Lithosphere-Atmosphere-Ionosphere
Coupling (LAIC) – A unified concept for earthquake precursors validation. J.
of Asian Earth Sci., 41, 371-382.
Silva, H. G., Bezzeghoud, M., Reis, A. H., Rosa, R. N., Tlemçani, M., Araújo,
A. A., Serrano, C., Borges, J. F., Caldeira, B., and Biagi, P. F. (2011):
Atmospheric electrical field during the M = 4.1 Sousel earthquake (Portugal).
Nat. Hazards Earth Syst. Sci., 11, 987-991.
Zmazek, B., Italiano, F., Živčić, M., Vaupotič, J., Kobal, I., and Marrtinelli, G.
(2002): Geochemical monitoring of thermal waters in Slovenia: relationships
to seismic activity. Applied Radiation and Isotopes, 57(6):919-930.
FUTURE COLLABORATIONS
The STSM to Ariel University was highly beneficial to the grantee as he acquired
knowledge and know-how on GPS-based and other satellite measurements that will
surely aid him in his research regarding atmospheric electricity in the future.
Future collaboration between the grantee and the host institute is planned as the grantee
wishes to publish the results of the carried out STSM. One possible way of publication is
a poster presentation at the EGU annual meeting 2020 but after elaborating and
continuing the research there is the possibility to publish it in a scientific paper as well.
Moreover, the home institute of the grantee and the host institute have similar
measurements and are interested in some common research areas. This STSM fostered
future collaboration as data and ideas were exchanged and there are topics on which the
grantee and the host could definitely work together fruitfully.
7You can also read