Developing a plant electrical energy model from historic batch scheduling data - Catalyst Inc
←
→
Page content transcription
If your browser does not render page correctly, please read the page content below
Proceedings of IMC35, Dublin Institute of Technology, June 2018

    Developing a plant electrical energy model
       from historic batch scheduling data
                 Konrad Mulrennan1, John Donovan1, Russell Macpherson2 and David Tormey1
           1
               Precision Engineering and ManufacturingTechnology Gateway, Institute of Technology Sligo
                                                2
                                                GlaxoSmithKline, Sligo
                                             mulrennan.konrad@itsligo.ie

Abstract: As sustainable manufacturing is of increasing interest to many batch production facilities, energy
efficiencies achieved through scheduling is a desired target. To achieve these energy efficiencies the initial step is
accurately modelling plant energy profiles from production schedule data. This poses a number of challenges as the
data required to model plant energy is stored in a number of separate locations and does not conform to a common
sampling rate or data type. Also, separating the energy consumption caused by plant production from the base load
of lighting and HVAC systems is difficult unless each production process is metered adequately. This paper focuses
on a methodology to deal with the complexities of data collection, tidying and modelling within a pharmaceutical
batch production facility. Historical energy and scheduling data have been utilised to generate a Random Forest
model for the site’s energy profile. The approach incorporates data science and machine learning tools, which pose a
possible solution to the problem outlined. The results from this work can feed into an overarching goal of more
sustainable manufacturing processes by allowing site energy engineers to predict and better manage plant energy
load.

Keywords: Energy model, production data, data science, machine learning, random forest

INTRODUCTION
In general manufacturing production processes there have been several recent publications and reviews
[1, 2] in relation to energy efficient manufacturing. However, these do not transfer directly to the
pharmaceutical industry. Gahm et al. [2] review energy efficient scheduling across the manufacturing
industry.
        Jiménez-González et al. [3] review green production in pharmaceutical processes in a broader
sense. A significant point which they highlight, discusses the major barrier to monitoring process energy
is of not having the measuring equipment in place to separate the energy usage of individual unit
operations from the overall plant energy [3].
        There have been a number of recent data driven approaches to modelling building energy loads
using data science and machine learning techniques [4, 5]. Conventional methods, such as time series
modelling and regression modelling, suffer from a lack of flexibility to adapt to the non-linear feature
patterns, which are used to predict building energy demands. The data driven approaches are often
preferred as they lend themselves to ease of use and adaptability.

METHODOLOGY
The available data consists of plant energy data, product codes, the manufacturing vessels and the date of
production. The raw data came from several different sources which included the SAP system, LIMS
system and the building energy supplier. Combining these data sets into a usable format is time
consuming and poses difficulties. These include converting all of the features to the same date format and
creating a sampling period which is useful for all sources. An additional time-series feature was created to
identify months. This was done to split the data set by months.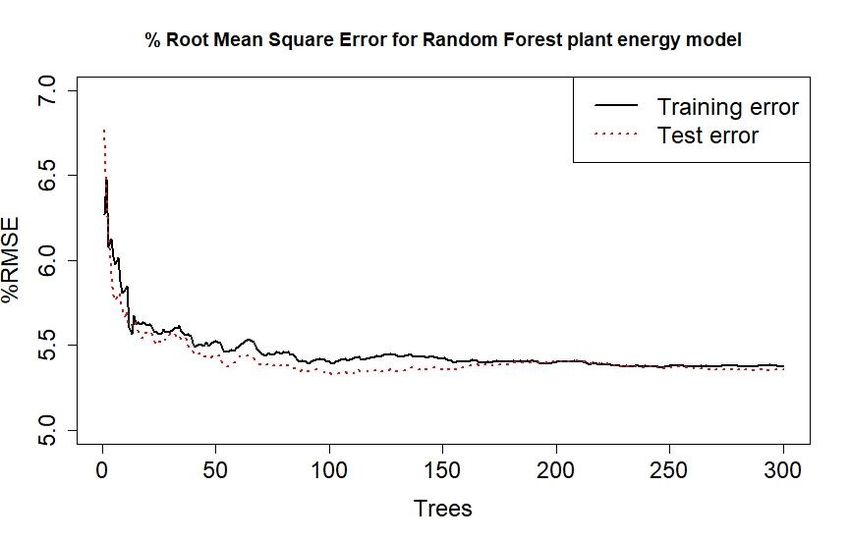
Proceedings of IMC35, Dublin Institute of Technology, June 2018
Both the product codes and the manufacturing vessels are categorical variables of 27 and 8 levels
respectively and are used as the input features to the model along with the time-series date of production
data. The daily energy data usage is continuous and is the model response. Data was provided for the
period April 2017 to December 2017. The Random Forest algorithm lends itself well to modelling
continuous responses from a variety of input features [4, 5] and was the approach pursued in this work.
Random Forest Model
The Random Forest model is an ensemble of decision tree models [6]. At each split point in a tree, a
random subset of size m of all available input features is created. The model then searches for the best
feature and split value from within that subset to partition the data set and minimise the combined residual
sum of squares (RSS). This is repeated until the default stopping criterion of 5 observations in a leaf node
is reached, this is an accepted heuristic for Random Forests for regression. The mean of the observations
in the final leaf nodes or terminal nodes is the prediction for each individual tree. The Random Forest
prediction is the aggregation of all of the predictions from each tree in the forest.
Results
The data set was split in a ratio of 75:25 with 75% of the data set used to train the model and 25% of the
data set used to test the model. The month feature was used to split the data set. A number of data splits
were investigated and the 75:25 split gave the best results while also preventing the model overfitting the
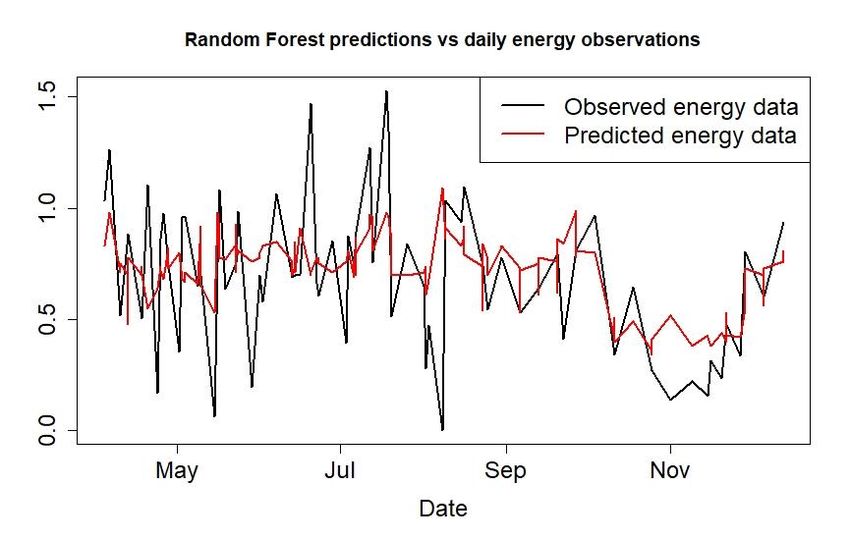
training data. Figure 1 presents the models predictions against the observed energy levels. Figure 2
highlights the percentage root mean squared error for training and test sets. The percentage root mean
square training error was 5.38% and the error on the test set was 5.36%. The energy values on the y-axis
have been scaled in Figure 1 for confidentiality reasons.
Figure 1Proceedings of IMC35, Dublin Institute of Technology, June 2018
Figure 2
DISCUSSION
The model suffers from a few issues which the authors plan to overcome in the next phase of work.
Several products and vessels are used on the same date and are all recorded as daily inputs. As such, there
is no way of accurately quantifying how much energy an individual product or vessel is using during any
given day.
The next phase includes collecting climate data for the region and incorporating this information
into the model. The temperature and humidity levels are expected to impact the energy demand of the
plant HVAC system. This data will be investigated for correlations with the overall plant energy demand
with a further aim for it to be used to improve the models performance.
Ideally, once a tested and accurate energy model has been developed and implemented, the model
output can be utilised as an objective function for the planning and scheduling teams. Minimising energy
consumption in this manner leads to more sustainable manufacturing processes.
ACKNOWLEDGEMENTS
The North West Centre for Advanced Manufacturing (NW CAM) project is supported by the European
Union’s INTERREG VA Programme, managed by the Special EU Programmes Body (SEUPB). The
views and opinions in this document do not necessarily reflect those of the European Commission or the
Special EU Programmes Body (SEUPB).
If you would like further information about NW CAM please contact the lead partner, Catalyst Inc, for
details.Proceedings of IMC35, Dublin Institute of Technology, June 2018 REFERENCES [1] Tao Peng and Xun Xu. “Energy-efficient machining systems: A critical review”. In: International Journal of Advanced Manufacturing Technology 72.9-12 (2014), pp. 1389–1406. doi: 10.1007/s00170-014-5756-0. [2] Christian Gahm, Florian Denz, Martin Dirr, and Axel Tuma. “Energy-efficient scheduling in manufacturing companies: A review and research framework”. In: European Journal of Operational Research 248.3 (2016), pp. 744–757. doi: 10.1016/j.ejor.2015.07.017. [3] Concepción Jiménez-González, David J. C. Constable, and Celia S. Ponder. “Evaluating the “Greenness” of chemical processes and products in the pharmaceutical industry—a green metrics primer”. In: Chemical Society Reviews 41.4 (2012), pp. 1485–1498. doi: 10.1039/C1CS15215G. [4] Muhammad Waseem Ahmad, Monjur Mourshed, and Yacine Rezgui. “Trees vs Neurons: Comparison be- tween random forest and ANN for high-resolution prediction of building energy consumption”. In: Energy and Buildings 147 (2017), pp. 77–89. doi: 10.1016/j.enbuild.2017.04.038. [5] Zeyu Wang, Yueren Wang, Ruochen Zeng, Ravi S Srinivasan, and Sherry Ahrentzen. “Random Forest based Hourly Building Energy Prediction”. In: Energy and Buildings (2018). doi: 10.1016/j.enbuild.2018. 04.008. [6] Leo Breiman. “Random Forests”. In: Machine Learning 45.1 (2001), pp. 5–32. doi: 10.1023/A:1010933404324.
You can also read