Influenza incidence prediction for the United States: an update for the 2018-2019 season - bioRxiv
←
→
Page content transcription
If your browser does not render page correctly, please read the page content below
bioRxiv preprint first posted online Sep. 7, 2018; doi: http://dx.doi.org/10.1101/411348. The copyright holder for this preprint
(which was not peer-reviewed) is the author/funder, who has granted bioRxiv a license to display the preprint in perpetuity.
                             It is made available under a CC-BY-NC-ND 4.0 International license.

        Influenza incidence prediction for the United States: an update for the
        2018-2019 season

        Xiangjun Du1, Yousong Peng2, Mi Liu3, Mercedes Pascual4,5

        1
          School of Public Health (Shenzhen), Sun Yat-sen University, Guangzhou 510006, China
        2
          College of Biology, Hunan University, Changsha 410082, China
        3
         Jiangsu Institute of Clinical Immunology & Jiangsu Key Laboratory of Clinical
        Immunology, First Affiliated Hospital of Soochow University, Suzhou 215006, China
        4
          Department of Ecology and Evolution, University of Chicago, Chicago, IL 60637, USA
        5
          The Santa Fe Institute, Santa Fe, NM 87501, USA

        Abstract
        Introduction: Seasonal influenza causes a high disease burden every year in the United
        States and worldwide. Anticipating epidemic size ahead of season can contribute to
        preparedness and more targetted control and prevention of seasonal influenza.
        Methods: A recently developed process-based epidemiological model that incorporates
        evolutionary change of the virus and generates incidence forecasts for the H3N2 subtype
        ahead of the season, was previously validated by several statistical criteria, including an
        accurate real-time prediction for the 2016-2017 influenza season. With this model, a new
        forecast is generated here for the upcoming 2018-2019 season. The accuracy of predictions
        published for the 2017-2018 season is also retrospectively evaluated.
        Results: For 2017-2018, the model correctly predicted the dominance of the H3N2 subtype
        and its higher than average incidence. Based on surveillance and sequence data up to June
        2018, the new forecast for the upcoming 2018-2019 season indicates low levels for H3N2,
        and suggests an H1N1 dominant season with low incidence of influenza B.
        Discussion: Real-time forecasts, those generated with a model that was parameterized
        based on data preceding the predicted season, allows valuable evaluation of the approach.
        Anticipating the dominant subtype and the size of the upcoming epidemic ahead of season
        informs disease control. Further studies are needed to promote more accurate ahead-of-
        season forecasts and extend the approach to multiple subtypes.

        Funding statement
        This work was funded by the Sun Yat-sen University. The funders had no role in the study
        design, data collection and analysis, decision to publish, or preparation of the manuscript.

        Human infections caused by the seasonal influenza virus impose a large burden on public
        health in the United States and worldwide. Anticipating the severity of the upcoming
        influenza season can contribute to timely and effective preparation, including targeted
        resource allocation and vaccination campaigns. To predict influenza incidence for the
bioRxiv preprint first posted online Sep. 7, 2018; doi: http://dx.doi.org/10.1101/411348. The copyright holder for this preprint
(which was not peer-reviewed) is the author/funder, who has granted bioRxiv a license to display the preprint in perpetuity.
It is made available under a CC-BY-NC-ND 4.0 International license.
H3N2 subtype in the United States, a process-based model (EvoEpiFlu) was recently
developed that incorporates evolutionary information into epidemiology based on the
mathematical SIRS formulation of transmission dynamics (for Susceptible, Infected,
Recovered and Susceptible immune classes in the population) (1,2). The SIRS model
(without evolutionary change) is being used successfully to implement within-season
forecasting (3). EvoEpiFlu makes additional use of evolutionary information related to
antigenic change and based solely on readily available genetic sequences of the virus, to
extend the lead time of prediction and make it possible to produce forecasts ahead of the
influenza season (1,2). There are two versions of the EvoEpiFlu model based respectively
on either a continuous or a discrete covariate for evolutionary change. The ‘continuous’
version of the model relies on an evolutionary index measuring how much the genetic
sequences encoding antigenic sites have changed relatively to the recent past. The ‘discrete’
or ‘cluster’ version relies instead on the proportion of antigenic variants (PAV) inferred
on the basis of an existing genotype-phenotype map (4), to identify intermittent periods of
antigenic change (1,2). An increasing and high value of either measure of evolutionary
change indicates the emergence of novel variants and a potential for high levels of future
infection. A decreasing trend for PAV implies similar circulating strains and potentially
fewer infections due to immune protection (1,2). Similarly, a decrease from sustained high
values of the evolutionary index would preclude a high number of susceptible individuals
and reduce transmission (1,2).
Based on the EvoEpiFlu model, we had previously generated a prediction for the 2017-
2018 influenza season before it arrived, which we can now be validated with the updated
surveillance data (Figure 1, bottom panel). The prediction was a high H3N2 season with
an estimated higher than average incidence rate (proportion of the population infected) of
0.09 (median, with 95% confidence interval [0.05,0.14]) (Figure 1, dotted black curve and
shaded black area, bottom panel). For comparison, the observed average incidence rate of
H3N2 for the past sixteen years is 0.06 . Our prediction is consistent with an observed value
of 0.14 for the season that just ended (5), with the actual rate higher than the median and
within, but at the higher limit, of our prediction interval (Figure 1, bottom panel, solid black
curve).
Encouraged by the prediction skill of EvoEpiFlu in this last season and before (1,2), we
report here a routine forecast for the upcoming 2018-2019 influenza season. Both the PAV
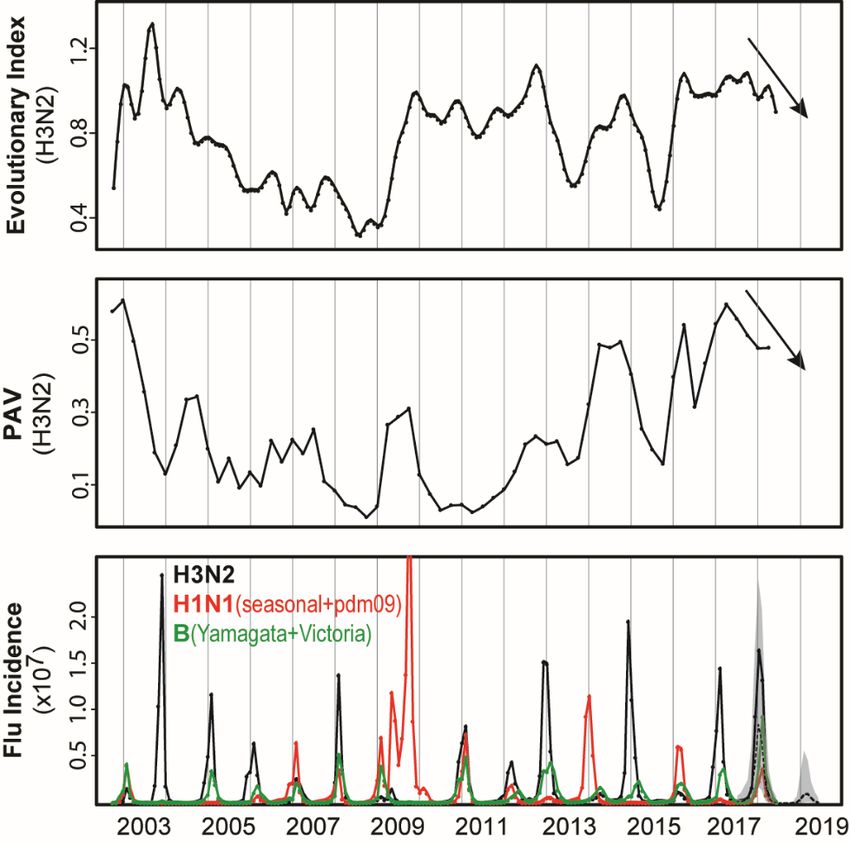
and the Evolutionary Index, exhibit a decreasing trend (Figure 1, top 2 panels). On the basis
of this trend in PAV and the incidence data up to June 2018, EvoEpiFlu’s cluster model
predicts that the upcoming 2018-2019 season will be H3N2 low, with an estimated median
incidence rate of 0.013 ([0.003,0.041], 95% confidence interval) (Figure 1, bottom panel,
black dotted curve and shaded area). The continuous model gives similar result with an
estimated median incidence of 0.059 ([0.022,0.109], 95% confidence interval), at the edge
of the historical average.bioRxiv preprint first posted online Sep. 7, 2018; doi: http://dx.doi.org/10.1101/411348. The copyright holder for this preprint
(which was not peer-reviewed) is the author/funder, who has granted bioRxiv a license to display the preprint in perpetuity.
It is made available under a CC-BY-NC-ND 4.0 International license.
Figure 1. Evolutionary components and forecasts of the EvoEpiFlu model. Top panel: the
evolutionary index calculated monthly. Middle panel: proportion of antigenic variants
(PAV) calculated for strains in each quarter compared to strains in the past 12 months.
Bottom panel: incidence and forecasts. The monthly observed incidence data of seasonal
influenza in the United States are shown, with H3N2 in black, H1N1 (both seasonal and
pandemic H1N1) in read and B (both Yamagata and Victoria lineages) in green. H3N2
incidence forecasts for 2017/2018 and 2018/2019 seasons are shown in dotted lines (with
shaded 95% uncertainty intervals) based on data up to June, 2017 and 2018 respectively.
Because EvoEpiFlu is specifically designed for H3N2, it is not yet possible to apply it to
model and predict influenza A-H1N1 and B. The annual incidence of H3N2 and H1N1
between the 2002/2003 and 2017/2018 seasons in the United States (Figure 1, bottom panel)
exhibit however a significant negative correlation (Spearman correlation of -0.64, p-value
< 0.01), and H3N2 and B, a positive one (Spearman correlation of 0.58, p-value < 0.05).
Additionally, we did not observe any novel antigenic change for either H1N1 or B in the
last three years based on the PAV analysis (PAV < 0.1) (4,6). As a result, with a forecast
of low H3N2 (median incidence rate 0.01) for the upcoming 2018/2019 season in the
United States, we would expect a higher than average level for H1N1, and a lower than
average level for B. For reference, the mean incidence rate of H1N1 was 0.10, and the
mean value for B was 0.02 ( based on the only two pandemic H1N1-dominant seasons of
2013/2014 and 2015/2016).bioRxiv preprint first posted online Sep. 7, 2018; doi: http://dx.doi.org/10.1101/411348. The copyright holder for this preprint
(which was not peer-reviewed) is the author/funder, who has granted bioRxiv a license to display the preprint in perpetuity.
It is made available under a CC-BY-NC-ND 4.0 International license.
Although we correctly predicted an H3N2-dominant season for the past season that just
ended, its observed incidence rate was more severe than our mean prediction (2,5). Also,
the continuous model consistently predicts higher incidence rates than the cluster model,
and has a tendency to overpredict (1). This indicates that there is room for improvement of
EvoEpiFlu, to better incorporate information on antigenic change and to include other
important information on vaccination and climate covariates. Future work is also needed
to implement similar process-based dynamical models for H1N1 and for type B. Type B
influenza in particular has been less studied, including the dynamics of its two lineages
and their interaction with type A. Although the PAV values are low (bioRxiv preprint first posted online Sep. 7, 2018; doi: http://dx.doi.org/10.1101/411348. The copyright holder for this preprint
(which was not peer-reviewed) is the author/funder, who has granted bioRxiv a license to display the preprint in perpetuity.
It is made available under a CC-BY-NC-ND 4.0 International license.
2. Du X, Pascual M, Incidence Prediction for the 2017-2018 influenza season in the United
States with an evolution-informed model. Plos Currents Outbreaks 2018, January 17.
3. Shaman J, Karspeck A, Yang W, Tamerius J, Lipsitch M, Real-time influenza forecasts
during the 2012-2013 season. Nature Communications 2013, 4:2837.
4. Du X, Dong L, Lan Y, Peng Y, Wu A, Zhang Y, Huang W, Wang D, Wang M, Guo Y,
Shu Y, Jiang T, Mapping of H3N2 influenza antigenic evolution in China reveals a
strategy for vaccine strain recommendation. Nature communications 2012, 3:709.
5. Gartem R, Blanton L, Elal AIA, Alabi N, Barnes J, Biggerstaff M, Brammer L, Budd
AP, Burns E, Cummings CN, Davis T, Garg S, Gubareva L, Jang Y, Kniss K, Kramer
N, Lindstrom S, Mustaquim D, O’Halloran A, Sessions W, Taylor C, Xu X, Dugan VG,
Fry AM, Wentworth DE, Katz J, Jernigan D, Update: influenza activity in the United
States during the 2017-2018 season and composition of the 2018-2019 influenza vaccine.
MMWR Morb Mortal Wkly Rep 2018, 67(22):634-642.
6. Liu M, Zhao X, Hua S, Du X, Peng Y, Li X, Lan Y, Wang D, Wu A, Shu Y, Jiang T,
Antigenic patterns and evolution of the human influenza A (H1N1) virus. Scientific
Reports 2015, 5:14171.
7. Blanton L, Alabi N, Mustaquim D, Taylor C, Kniss K, Kramer N, Budd A, Gary S,
Cummings CN, Chung J, Flannery B, Fry AM, Sessions W, Garten R, Xu X, Elal AIA,
Gubareva L, Barness J, Dugan V, Wentworth DE, Burns E, Katz, J, Jernigan D,
Brammer L, Update: influenza activity in the United States during the 2016-2017 season
and composition of the 2017-2018 influenza vaccine. MMWR Morb Mortal Wkly Rep
2017, 66(25):668-676.You can also read