2018 Spring Outlook for Northern and Central New Mexico
←
→
Page content transcription
If your browser does not render page correctly, please read the page content below
2018 Spring Outlook for                                                                                      Albuquerque
Northern and Central New Mexico                                                                              WEATHER FORECAST OFFICE

*Updated 3/13/2018 to
add a slide on the Pacific
Meridional Mode (PMM)
(slide 9) and update SSTA
map on slide 3 and sub-
surface graphics on slide
4 as La Niña continues to
weaken rapidly.

                                                          Shuree SNOTEL near the Valle Vidal (10,100 feet)
                                                 January 29, 2018 Courtesy of Chris Romero USDA – NRCS

Shuree Snow Telemetry (SNOTEL) station just east of the Valle Vidal in the northeast Sangre de Cristo Mountains at
10,100 feet elevation on January 29, 2017. Average snow depth since 2010 at this site for the date is 19”. What happened
to winter? Is it all La Niña’s fault? Not all of it. Part of the blame can be put on a negative Arctic Oscillation (AO) or weak
polar vortex. Climate models do not currently anticipate changes in the polar vortex and therefore cannot predict
whether a blocking weather pattern in the form of a deep closed low will set up across eastern Canada and the northeast
U.S. Will the warm and nearly unprecedented dry continue through meteorological spring (March, April and May(MAM))?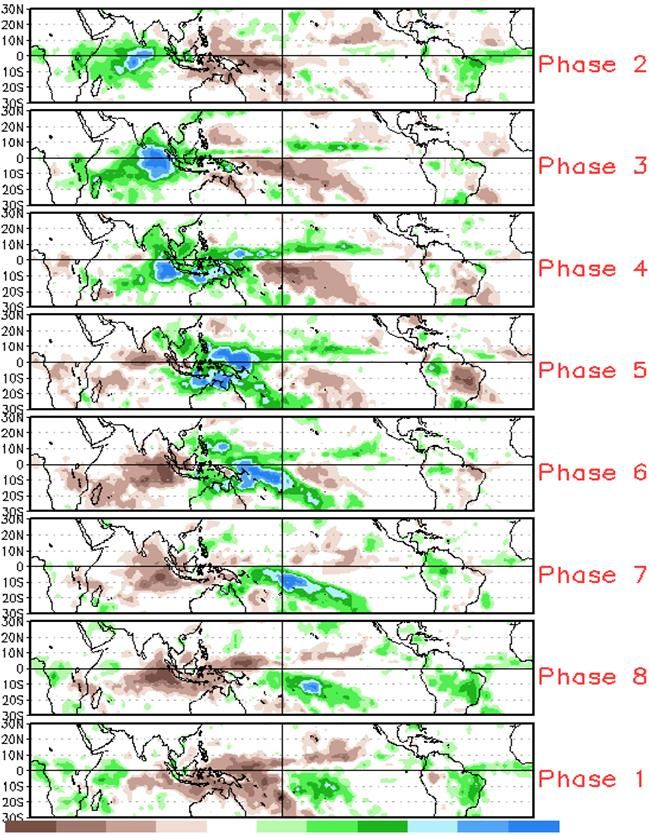
Why Was It So Dry for So Long? Albuquerque
WEATHER FORECAST OFFICE
Blame A Weakened Arctic Oscillation (AO)/Polar Vortex in Combination with La Niña
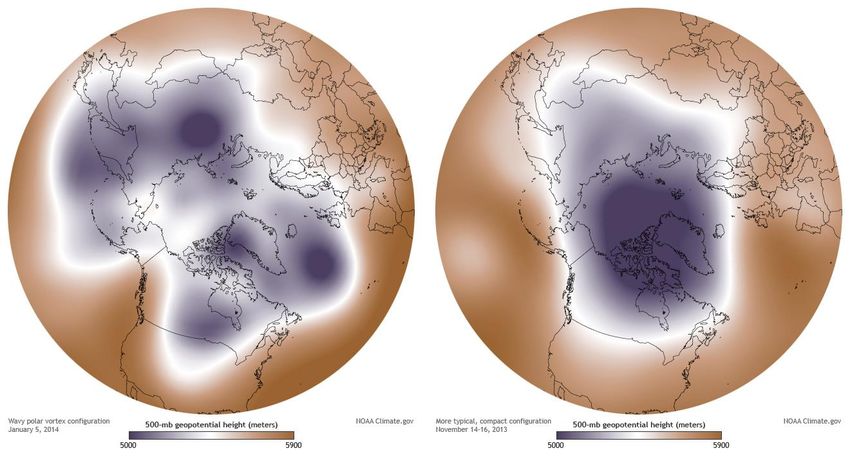
Figures 1 and 2. A strong polar vortex (right - December 2013) is centered over the Arctic and typically keeps the coldest of Arctic air over
northern North America. A weakened polar vortex (left - from January 2014) allows Arctic air to dip farther south into the central and northeast
U.S. and can slow or block the westerly wave-train across western North America. 500-mb height anomalies (right image) in December 2017 and
January 2018 showing a pattern that mimics a weekend polar vortex state. Weather and climate prediction models do not currently anticipate
changes in the polar vortex and sea ice extent, and did not forecast such a pattern.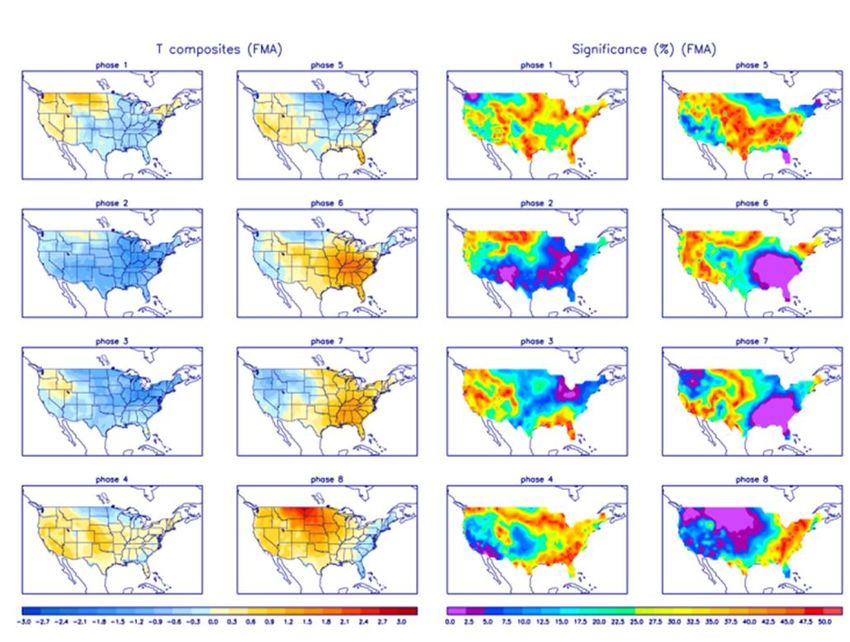
Latest Sea Surface Temperature (SST) Albuquerque
Observations and Oscillation Index Values WEATHER FORECAST OFFICE
*Updated SSTA map and ONI
value on 3/5/2018
Multivariate ENSO Index (MEI)
for DEC-JAN: -0.62
Pacific Decadal Oscillation
(PDO) for JAN 2018: +0.70
Atlantic Multidecadal
Oscillation (AMO) for JAN 2018:
+0.17
Oceanic Niño Index (ONI)
(uses Niño 3.4 region - inner
rectangle) for NDJ 2017: -0.9
Figure 3. Latest weekly global SST anomalies showing cooler than average temperatures in the eastern equatorial Pacific Ocean.
Sub-Surface SSTAs                                                                                   Albuquerque
                                                                                                      WEATHER FORECAST OFFICE

Figures 4 and 5. Negative subsurface temperature anomalies continue across the eastern Pacific Ocean with positive anomalies
now being observed below the surface in the Western and Central Pacific.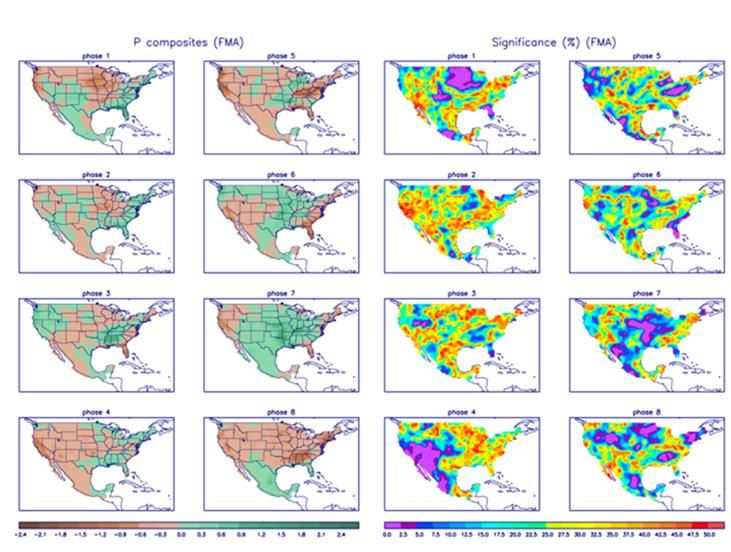
Madden-Julian Oscillation (MJO)                                                                                       Albuquerque
                                                                                                                       WEATHER FORECAST OFFICE

Figures 6-8. The MJO is an area of enhanced thunderstorms that travels around the world every 30 to 60 days from west to east along/near
the equator. An active MJO’s importance on the weather/climate impacts for the Southwest U.S. cannot be overstated. Ahead and behind the
active stormy area are areas of suppressed convection and drier conditions. The MJO affects near-surface wind patterns, because the rising air in
the stormy area causes surface winds to blow toward the active area. During La Niña, the trade winds are stronger than average, keeping the
surface waters cooler (vice versa during El Niño). If the MJO is active, it typically changes the wind patterns temporarily. During February 2018,
the MJO was active and moved eastward into the East Pacific (Phases 7/8). The MJO is currently acting to weaken La Niña. The two images on the
right indicate that the GEFS and ECMF ensemble model members (yellow lines) keep the MJO weak (near the circle in the middle) and in phases
2/3 for the next two weeks.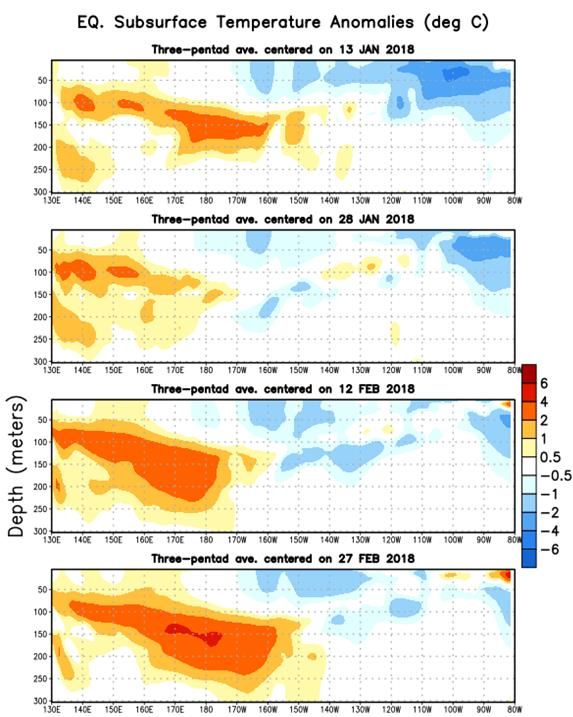
Madden-Julian Oscillation (MJO) cont’d                                                                                Albuquerque
                                                                                                                        WEATHER FORECAST OFFICE

Figures 9 and 10. Precipitation anomalies based on outgoing long-wave radiation (OLR) during the different phases of the MJO (left image). The
two left columns on the right image show temperature anomalies by MJO phase for MJO events that have occurred over the three month period
in the historical record. Blue (orange) shades show negative (positive) anomalies respectively. The images in the right two columns measure the
significance for the aforementioned anomalies. Purple shades are areas where the anomalies are significant at the 95% or better confidence level.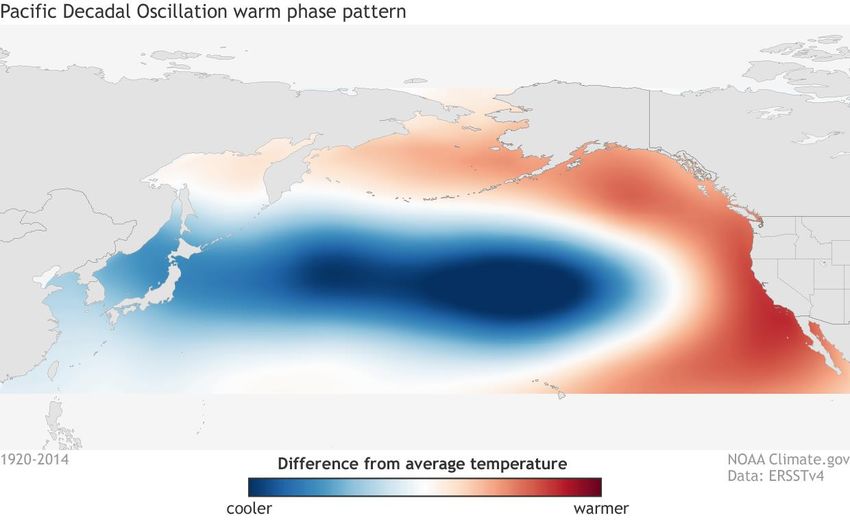
Madden-Julian Oscillation (MJO) cont’d                                                                                   Albuquerque
                                                                                                                           WEATHER FORECAST OFFICE

Figures 11 and 12. Precipitation anomalies based on outgoing long-wave radiation (OLR) during the different phases of the MJO (left image).
The two left columns in right image show precipitation anomalies by MJO phase for MJO events that have occurred over the three-month period
in the historical record. Brown (green) shades show negative (positive) anomalies respectively. The images in the right two column show a
measure of significance for the anomalies. Purple shades indicate areas in which the anomalies are significant at the 95% or better confidence level.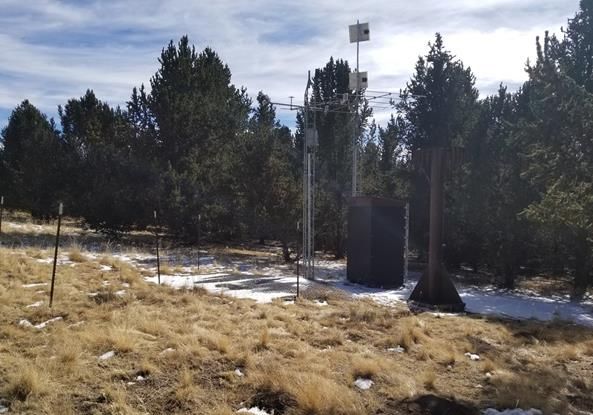
Pacific Decadal Oscillation (PDO)                                                                       Albuquerque
                                                                                                         WEATHER FORECAST OFFICE

 A key factor during a positive PDO is increased low and mid-level moisture availability over far northeast Pacific/Gulf of CA.
                                                                              °C
                                                           °C

Figure 13. Typical Sea Surface Temperature Anomaly (SSTA) patterns in the North Pacific Ocean during a positive
Pacific Decadal Oscillation phase (PDO). As with ENSO, the PDO correlates well with spring precipitation in the
southwest United States.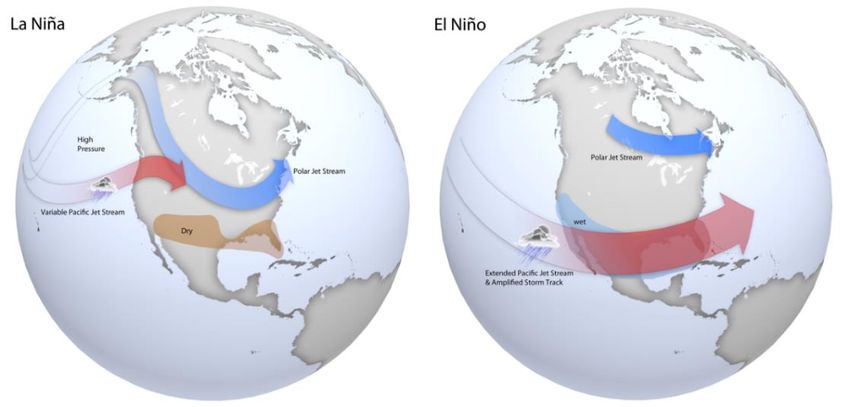
Pacific Meridional Model (PMM)                                                                               Albuquerque
                                                                                                               WEATHER FORECAST OFFICE

Figure 14. Tropical patterns associated with the positive state of the Pacific Meridional Mode (PMM). Red shading indicates above-
average sea surface temperature and blue shading indicates below-average sea surface temperature.Vectors (black arrows) show near-
surface wind anomalies (difference from average). Figure based on Chiang and Vimont (2004) and modified by Climate.gov. The index is
the most positive it’s been a several years (see Figure 3). Why do we care? The contrast between warmer north and cooler south can
influence wind patterns along the equator, thereby influencing El Niño Southern Oscillation (ENSO).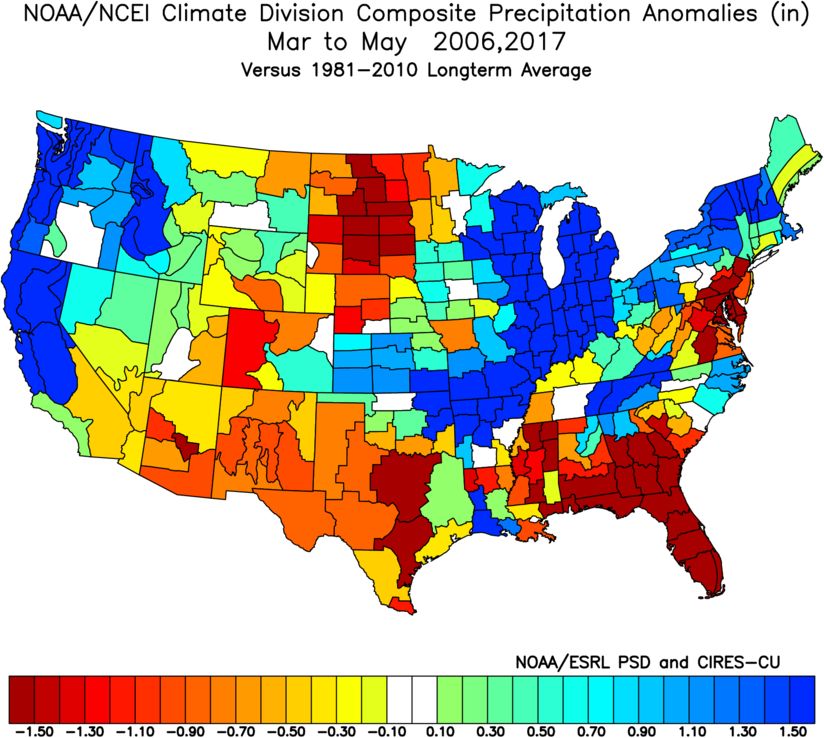
Why SSTs in the Eastern Pacific Ocean Are So                                                                             Albuquerque
Important WRT to Weather Patterns/Climate                                                                                   WEATHER FORECAST OFFICE

                   Typical Jet                                                                                Typical Jet
                   Stream Pattern                                                                             Stream Pattern
                   during La Niña                                                                             during El Niño

                                                                                                         Typical Tropical
                                                                                                         circulations
                                                                                                         during El Niño

                        Typical Tropical
                        circulations
                        during La Niña

Figures 15 and 16. Warmer SSTs support deep tropical and subtropical convection farther east than average. This deep convection draws the jet
stream farther south into the far eastern Pacific Ocean and southwestern United States during El Niño. The opposite is true during moderate to strong
La Niñas and the polar jet stream generally remains north of New Mexico. Weak La Niñas are sometimes wetter and cooler than average.
Comparing Late February 2006 Albuquerque Global SSTAs to Late February 2018 WEATHER FORECAST OFFICE Figures 17 and 18. SSTAs from the most analogous weak-moderate La Niña event, 2006, and current conditions. Note the differences between the north and southeast Pacific Ocean. The cooler than average temperatures along the west coast of South America are slightly more prominent this year, indicative of a slightly stronger La Niña event.
Analog Seasons Using MEI and ONI                                                                     Albuquerque
                                                                                                      WEATHER FORECAST OFFICE

Figures 19 and 20. Multivariate ENSO Index (MEI) (left) and Oceanic Niño Index (ONI) (right) indicating two recent late
winter seasons were similar to 2018. While analog years are getting harder to come by given a changing global climate system,
there are two recent spring seasons where SSTAs were similar to current conditions, 2005/2006 and 2016/2017.
Temperature and Precipitation for 2006, 2017 Albuquerque
WEATHER FORECAST OFFICE
Figures 21 and 22. During two recent analog years, 2006 and 2017, temperatures were above 1981-2010 averages (left) across
New Mexico while precipitation was slightly below to below average.Latest Climate Model Forecasts Albuquerque
WEATHER FORECAST OFFICE
Figure 23. A vast majority of climate model forecasts bring SSTAs in the eastern equatorial Pacific into neutral territory
(between -0.5°C and +0.5°C ) during the northern hemisphere spring (MAM) 2018.Climate Prediction Center: 2018 Winter Outlook Albuquerque
WEATHER FORECAST OFFICE
Figures 24 and 25. The Climate Prediction Center (CPC) MAM 2018 precipitation and temperature forecasts favoring below
average precipitation and above to well above average temperatures for much of New Mexico.Numerical Climate Prediction Albuquerque
Model Precipitation for MAM WEATHER FORECAST OFFICE
Highest model skill in
MAM across southwest Highest model skill in MAM
NM. across southwest NM.
Orange/red equates to below
average precipitation rates. Orange/red equates to below
average precipitation rates.
Figures 26-29. Model precipitation rate anomaly plots from the two climate models that have the highest skill percentages (top two images),
the North American Multi-Model Ensemble (NMME) and the Geophysical Fluid Dynamics Laboratory (GFDL_FLOR) model. Both model
forecasts are predicting below average precipitation for MAM 2018 across New Mexico.Numerical Climate Prediction Albuquerque
Model Temperature for MAM WEATHER FORECAST OFFICE
Highest model skill in
MAM across southwest Highest model skill in MAM
NM. across southwest NM.
Orange/red equates to below
average precipitation rates. Orange/red equates to below
average precipitation rates.
Figures 30-33. Model temperature rate anomaly plots from the two climate models which have the highest skill percentages (top two images),
the North American Multi-Model Ensemble (NMME) and the Geophysical Fluid Dynamics Laboratory (GFDL_FLOR) model. Both model
forecasts are predicting above to well above average temperatures for MAM 2018 across New Mexico.Albuquerque
How About Wind? WEATHER FORECAST OFFICE
Wind Outlook
81-10 climo Analog Yrs
14
12.1
12
11.5 11.7 11.1
10.2 10.4
10 8.8 8.3
8
6
4
2
0
Albuquerque Gallup Las Vegas Santa Fe
Figures 34 and 35. Hourly average wind speeds during two analog years (2006 and 2017) were near to slightly above the 1981-
2010 climatological averages for MAM (left image) and 700mb (~10,000 feet MSL) wind anomalies in meters per second from
2006 and 2017.A Peek Ahead to Summer Albuquerque
WEATHER FORECAST OFFICE
Figures 36-42. While the spring predictability “barrier” (a lull or a valley in ENSO forecasting accuracy) still has to be cleared
and the climate model skill is only slightly better than flipping a coin, nearly all climate models have been forecasting a relatively
robust North American Monsoonal (NAM) plume in June, July and August. Let’s hope.Summary Albuquerque
WEATHER FORECAST OFFICE
Precipitation data from the two most analogous years to 2018 (2006 and 2017) combined with
forecasts from the most highly skilled climate forecast models indicate that precipitation in
central and northern New Mexico during March, April and May (MAM) 2018 will most likely
range from slightly below to below the 1981-2010 climatological averages.
Snowfall data from the two previous weak to moderate La Niña events combined with climate
model forecasts suggest that snowfall will range from slightly below to below average.
Temperature data from the two most recent analogous years combined with climate model
forecasts indicate that temperatures in central and northern New Mexico during MAM 2018
will mostly likely range from above to well above average.
Wind data from two recent analogous years suggest that winds will be near to slightly above
average in MAM 2018.Outlook Information Albuquerque
WEATHER FORECAST OFFICE
Outlook provided by National Weather Service Forecast
Office Albuquerque, NM.
For further information contact Andrew Church:
andrew.church@noaa.gov (505) 244-9150You can also read