Supplement of Aircraft-based measurements of High Arctic springtime aerosol show evidence for vertically varying sources, transport and ...
←
→
Page content transcription
If your browser does not render page correctly, please read the page content below
Supplement of Atmos. Chem. Phys., 19, 57–76, 2019
https://doi.org/10.5194/acp-19-57-2019-supplement
© Author(s) 2019. This work is distributed under
the Creative Commons Attribution 4.0 License.

Supplement of
Aircraft-based measurements of High Arctic springtime
aerosol show evidence for vertically varying sources,
transport and composition
Megan D. Willis et al.

Correspondence to: Megan D. Willis (megan.willis@mail.utoronto.ca)

The copyright of individual parts of the supplement might differ from the CC BY 4.0 License.
1    Supplementary Methods

Figure S1: Pressure versus time since take-off, coloured by measured potential temperature,
for all six High Arctic NETCARE flights during 7 – 13 April 2015. Note that the full flight
is shown in each case; however, this work only considers measurements made at pressures
higher than ∼640 mbar (i.e., below ∼3.5 km) because the ToF-AMS was not run at lower
ambient pressures.

                             April 7, 8 (leg 1), 9, 11     April 8 (leg 2), 13
      Menu 1     Mode       Ensemble MS, SP laser on Ensemble MS, SP laser on
                Duration     10s (5s open, 5s closed)   10s (5s open, 5s closed)
      Menu 2     Mode       Ensemble MS, SP laser off Ensemble MS, SP laser off
                Duration     10s (5s open, 5s closed)   10s (5s open, 5s closed)
      Menu 3     Mode          epToF, SP laser on      Event Trigger, SP laser on
                Duration               10s                        10s

       Table S1: Summary of ToF-AMS Operation Modes during NETCARE 2015

                                            1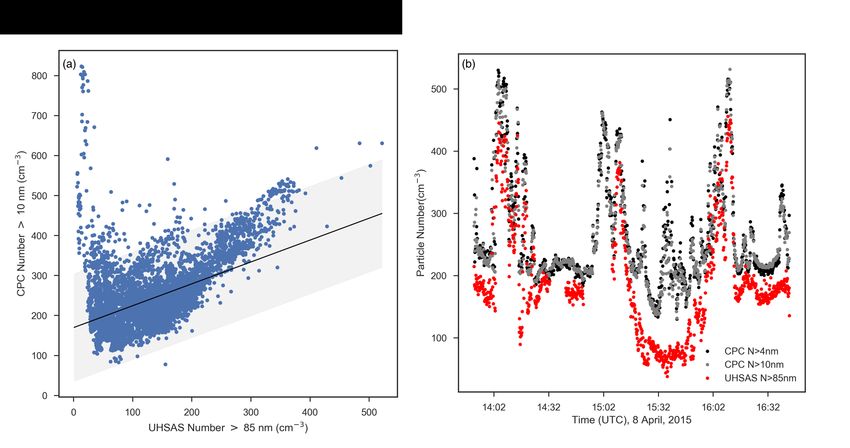
Figure S2: Comparison between the number of particles greater than 500 nm measured by
the UHSAS and OPC. (a) For all observations, average to 10 second time intervals. (b)
An example time series comparison for Flight 4 on 8 April 2015, also at 10 second time
resolution.

    Comparison of particle instruments. Two main issues arose when comparing ToF-AMS
particle mass with that estimated from other, size-resolved measurements of particle con-
centration. First, it is clear that the AMS underestimates aerosol mass in the presence of
sea salt. Second, when sea salt was not important, the ToF-AMS gives a higher mass con-
centration than that predicted by the UHSAS by approximately a factor of two. A similar
discrepancy between ToF-AMS aerosol mass and UHSAS estimated mass concentrations
was discussed in Willis et al. (2017) for measurements from NETCARE 2014. The source
of this discrepancy is discussed further here.
    In addition to the two issues noted above, it appears that the UHSAS may not be
counting the very low concentrations of larger particles accurately, and giving approximately
a factor of two lower particle numbers above 500 nm compared to an optical particle counter
(OPC) that was also sampling during the NETCARE flights (Figure S2). Unfortunately the
OPC was not integrated onto the Polar6 for NETCARE 2014, and so is not included in the
instrumental comparisons described by Leaitch et al. (2016) and a quantitative laboratory
comparison between the UHSAS and OPC is not available. The OPC periodically provides
spuriously high concentrations of particles between 250 - 400 nm and so we restrict the
comparison to sizes above 500 nm.
    Total particle concentrations above 4 and 10 nm were measured with two condensation
particle counters (TSI CPC 3776 and 3772). Total number concentrations from the CPCs
and the number of particles larger than 85 nm from the UHSAS agreed reasonably because
the number concentrations of Arctic haze particles are dominated by particles larger than
85 nm (Figure S3). Thus, there is no indication of a significant bias in the particle number
concentrations measured with the UHSAS. The discrepancy between the OPC and UHSAS
for particles larger than 500 nm can still happen as the number of particles larger than 500
nm make very small relative contributions to the total particle number concentration. While
the number concentrations of particles above 500 nm are small, they contribute significant
amounts of mass (e.g., up to ∼1ug/m3 depending on the assumed density). For the above
reasons, we have used UHSAS observations between 100 – 500 nm and OPC observations
above 500 nm.

                                             2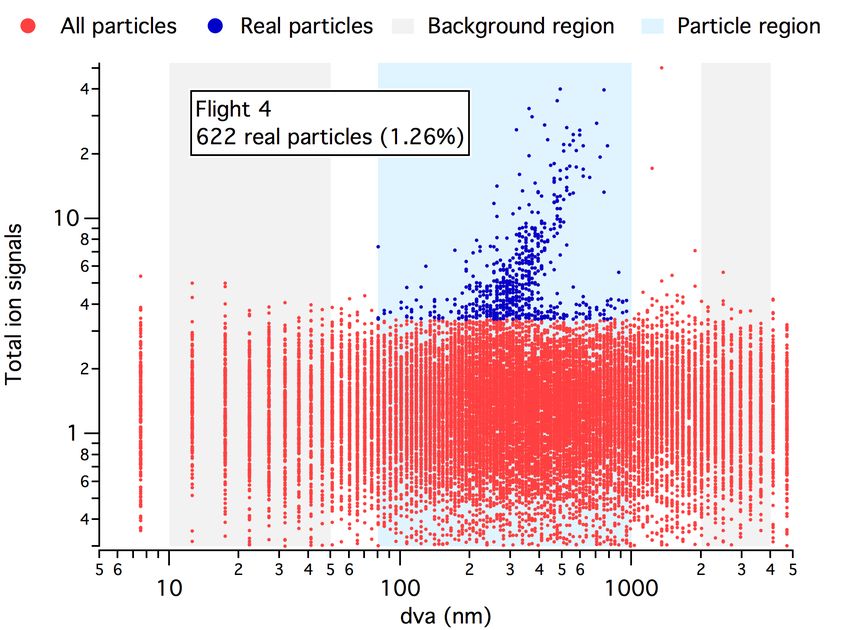
Figure S3: Comparison between the number of particles greater than 10 nm measured by
the CPC and the number of particles greater than 85 nm measured by the UHSAS, averaged
to 10 second time intervals. (a) For all observations when the difference in concentration
measured by the two CPCs was negligible. (b) An example time series comparison for Flight
3 on 8 April 2015.

    Assuming a particle density of 1.5 g/cm3 , we compared total non-refractory aerosol mass
from the ToF-AMS with the mass estimated from combined data from the UHSAS and OPC
(i.e., the number of particles between 100 – 500 nm (N100−500 ) derived from UHSAS observa-
tions and the number greater than 500 nm (N>500 ) from the OPC. This comparison illustrates
that the ToF-AMS does not reflect aerosol mass compared to the OPC and UHSAS when
sea salt is an important component and overestimates aerosol mass compared to the OPC
and UHSAS by approximately a factor of two at other times (Figure S4). This discrepancy
likely arises from biases in both the UHSAS and ToF-AMS measurements. Comparison
of the UHSAS volume size distributions with that measured at the Alert Observatory was
possible for short periods when the aircraft flew low in the area (i.e., between 60-200 m
above ground level). These comparisons suggest that the UHSAS underestimates particle
volume between 250 – 500 nm by approximately 20%.
    Owing to the discrepancies discussed above the absolute particle mass concentrations
presented in this work should be treated with caution. However, we believe that these
discrepancies do not prevent us from using these data to make the interpretations described
in this work, which rely particularly on relative changes in aerosol composition with altitude.

                                              3
Figure S4: Comparison between ToF-AMS total non-refractory aerosol mass and aerosol
mass estimated from the UHSAS and OPC particle size distributions, assuming a particle
density of 1.5 g/cm3 and coloured by (a) sampling altitude and (b) ToF-AMS uncalibrated
signal for sea salt.

                                          4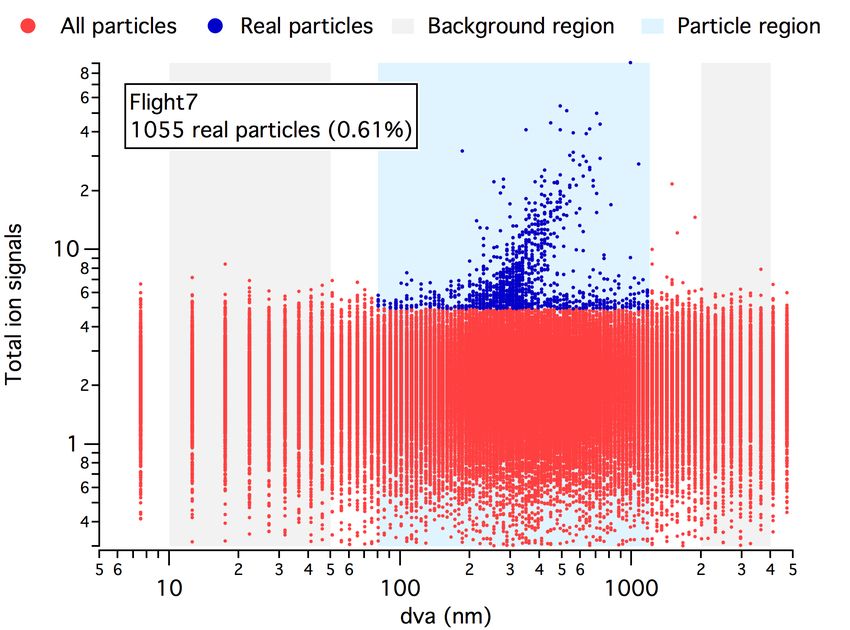
Single particle measurements.

                         ROI (m/z)     Threshold (Ions/Extraction)
                             46                     1
                             64                     1
                          45 - 150                  3

                        Table S2: Event Trigger Regions of Interest

  (a)                                          (b)

Figure S5: (a) Total aerosol ion signal, excluding air peaks, for all ETSP mass spectra
collected during flight 4 on 8 April, 2015 (red points). Blue points represent particle spectra
identified as “real” based on setting a threshold of the mean aerosol ion signal in background
regions (grey shading) plus three times its standard deviation. Blue shading indicates the size
range over which “real” particles are selected. 622 MS spectra were identified as associated
with “real” particle events during flight 4, corresponding to 1.26% of total spectra collected
during this flight. (b) As in (a) but for flight 7 on 13 April, 2015. 1055 MS spectra were
identified as associated with “real” particle events during flight 7, corresponding to 0.61%
of total spectra collected during this flight.

  (a)                                          (b)

  (c)                                          (d)

Figure S6: (a) Mean mass spectrum and mass spectral histogram (b) for particle class 1
of the two cluster solution. (c) Mean mass spectrum and mass spectral histogram (d) for
particle class 2 of the two cluster solution.

                                              5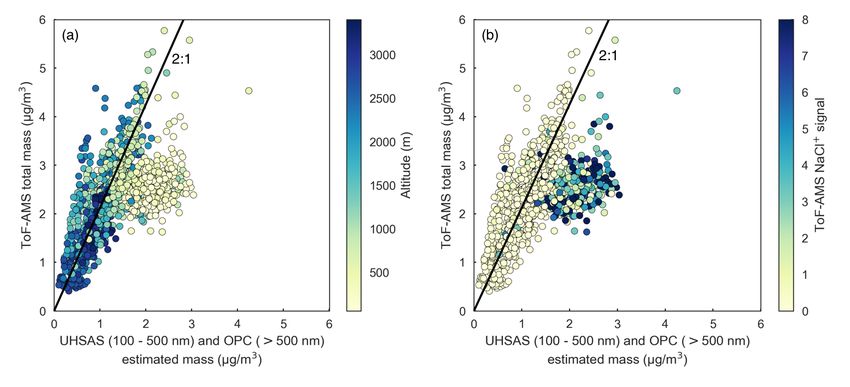
2    Supplementary Results

                  (a)

                  (b)

Figure S7: (a) Map of mean potential temperature during 7 – 13 April 2015 from ECMWF.
(b) Zonal mean potential temperature from ECMWF during 7 – 13 April 2015, averaged
between -110◦ W and -60◦ W.

                                         6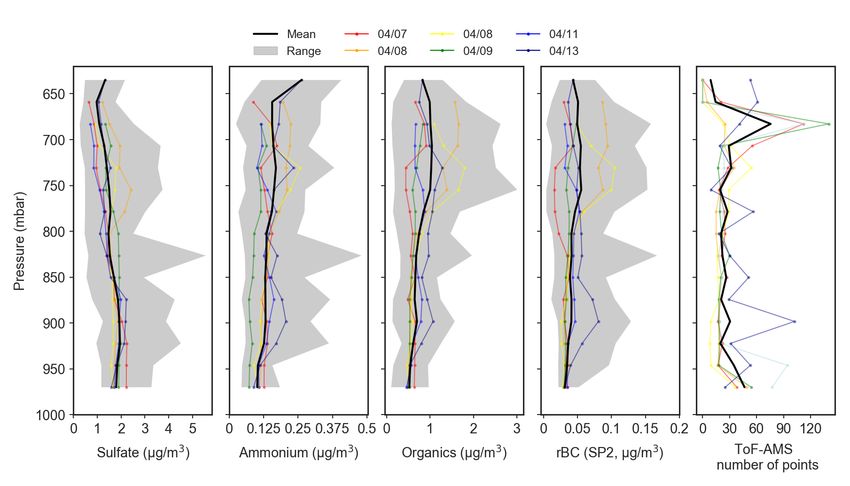
Figure S8: Monthly mean carbon monoxide concentrations at Alert, NU during 2008 –
2015 (black) (Novelli et al., 2016). The mean (± standard deviation) CO concentrations in
April 2008 – 2015 at Alert was 149.6 ± 2.9 ppbv. The mean (± standard deviation) CO
concentration measured during NETCARE 2015, from the surface up to 265 K (∼1500 m),
is shown with the red triangle (143.5 ± 2.5 ppbv).

                                           7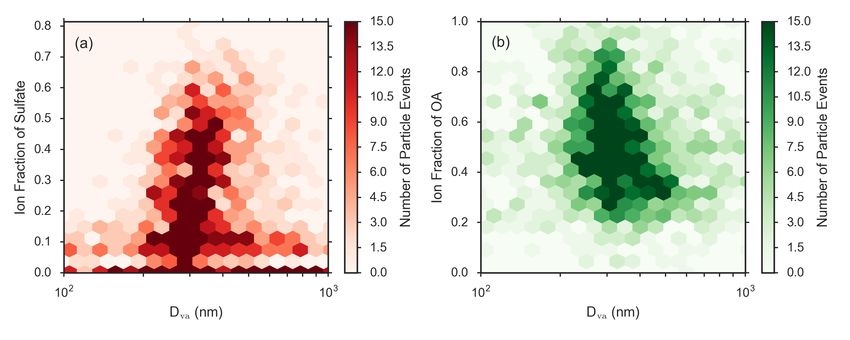
(a)

          (b)

Figure S9: (a) Mean pressure profiles of trace gases in the polar dome observed during 7 – 13
April 2015, including carbon monoxide, carbon dioxide, ozone and water vapour. (b) Mean
pressure profiles of sub-micron aerosol composition in the polar dome observed during 7 – 13
April 2015, including sulphate, organics and ammonium from the ToF-AMS and refractory
black carbon (rBC) from the SP2. The profile of number of points represents the number of
measurements from the ToF-AMS, which had the slowest sampling rate of all instruments
deployed during NETCARE 2015.

                                             8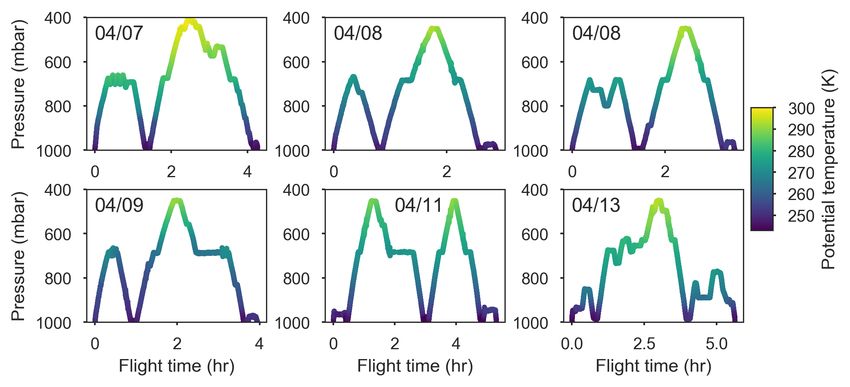
Figure S10: Mean altitude profiles of temperature (left) and potential temperature (right)
in the polar dome observed during 7 – 13 April 2015. Coloured lines indicate the mean
profile for each flight, the black line represents the mean profile over all flights, and gray
shading shows the range of observations in each altitude bin.

Figure S11: Observed potential temperature (K) as a function of FLEXPART-ECMWF
predicted fraction of the past 10 days in the mid-to-lower polar dome (i.e., below 265 K and
north of 69.5◦ N). The FLEXPART-ECMWF relative residence time is binned in the lower
(245 – 252 K), middle (252 – 265 K) and upper (265 – 280 K) polar dome.

                                              9
Figure S12: Active fire counts in the Northern Hemisphere north of 35◦ N dur-
ing March to May for the period 2004 – 2017 from MODIS C6 (obtained from
https://firms.modaps.eosdis.nasa.gov/download/)
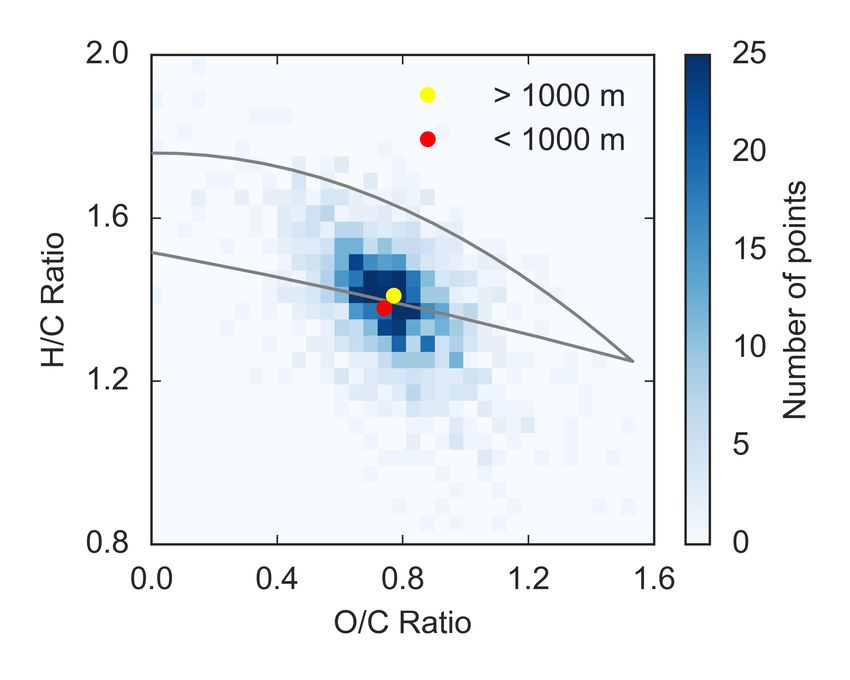
Figure S13: Two dimensional histogram showing the relationship between the oxygen-to-
carbon (O/C) and hydrogen-to-carbon (H/C) ratio estimated by the ToF-AMS according
to the method described in Canagaratna et al. (2015), where the color scale represents
the number of observations. Grey lines represent the ambient range observed by Ng et al.
(2011). Red and yellow circles represent the mean O/C and H/C ratios below and above
1 km, respectively, showing no discernible difference within error.
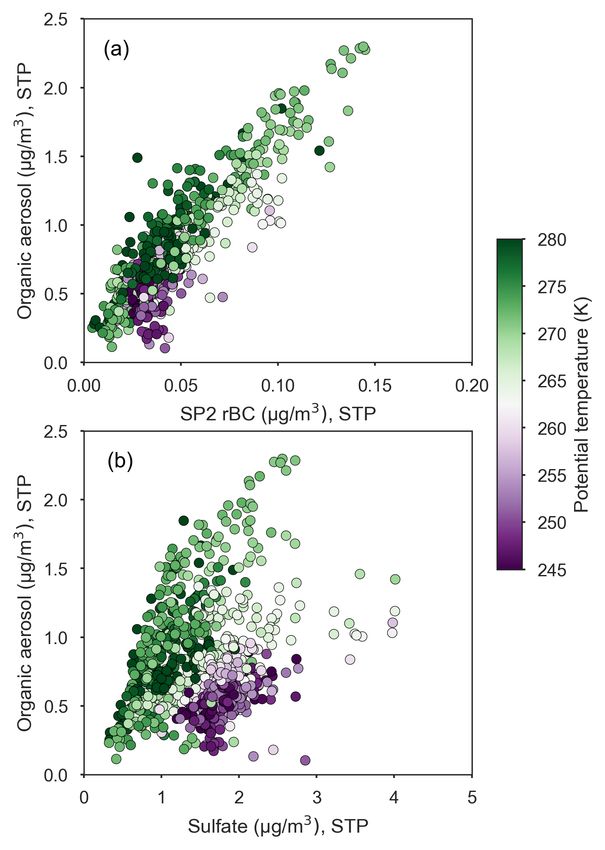
10Figure S14: (a) ToF-AMS organic aerosol versus SP2 refractory black carbon (rBC), coloured
by measured potential temperature. (b) ToF-AMS organic aerosol versus ToF-AMS sul-
phate, coloured by measured potential temperature.
Figure S15: Normalized mean ToF-AMS size distributions of organic aerosol subset by
observed potential temperature: below 252 K (black), above 265 K (light blue).
11Figure S16: (a) Ion fraction of sulfate in single particle (ETSP) mass spectra as a function
of particle size. (b) Ion fraction of total organic aerosol in single particle mass spectra
as a function of particle size. The colour scale in both plots represents the number of
real particle events observed. A total of 1677 real particle spectra were obtained from the
combined observations on two flights (8 April and 13 April, 2015).
12References
Canagaratna, M. R., Jimenez, J. L., Kroll, J. H., Chen, Q., Kessler, S. H., Massoli, P.,
Hildebrandt Ruiz, L., Fortner, E., Williams, L. R., Wilson, K. R., Surratt, J. D., Don-
ahue, N. M., Jayne, J. T., and Worsnop, D. R.: Elemental ratio measurements of or-
ganic compounds using aerosol mass spectrometry: characterization, improved calibra-
tion, and implications, Atmospheric Chemistry and Physics, 15, 253–272, https://doi.org/
10.5194/acp-15-253-2015, 2015.
Leaitch, W. R., Korolev, A., Aliabadi, A. A., Burkart, J., Willis, M. D., Abbatt, J. P. D.,
Bozem, H., Hoor, P., Kollnr, F., Schneider, J., Herber, A., Konrad, C., and Brauner,
R.: Effects of 20 – 100nm particles on liquid clouds in the clean summertime Arctic,
Atmospheric Chemistry and Physics, 16, 11 107–11 124, https://doi.org/10.5194/acp-16-
11107-2016, 2016.
Ng, N. L., Canagaratna, M. R., Jimenez, J. L., Chhabra, P. S., Seinfeld, J. H., and Worsnop,
D. R.: Changes in organic aerosol composition with aging inferred from aerosol mass spec-
tra, Atmospheric Chemistry and Physics, 11, 6465–6474, https://doi.org/10.5194/acp-11-
6465-2011, 2011.
Novelli, P., Crotwell, A., Lang, P., and Mund, J.: Atmospheric Carbon Monoxide Dry Air
Mole Fractions from the NOAA ESRL Carbon Cycle Cooperative Global Air Sampling
Network, 1988-2015, ftp://aftp.cmdl.noaa.gov/data/trace-gases/co/flask/surface/, 2016-
07-06, 2016.
Willis, M. D., Köllner, F., Burkart, J., Bozem, H., Thomas, J. L., Schneider, J., Aliabadi,
A. A., Hoor, P. M., Schulz, H., Herber, A. B., Leaitch, W. R., and Abbatt, J. P. D.: Evi-
dence for marine biogenic influence on summertime Arctic aerosol, Geophysical Research
Letters, https://doi.org/10.1002/2017gl073359, 2017.
13You can also read