Industrial and Structural Transformation in Sub-Saharan Africa - Melo Jaime de, Scientific Director, FERDI Fondation pour les études et ...

 
CONTINUE READING
Industrial and Structural Transformation in Sub-Saharan Africa - Melo Jaime de, Scientific Director, FERDI Fondation pour les études et ...
Jaime de Melo

December 16 2015 | Nairobi, Kenya

Industrial and Structural Transformation in Sub-Saharan Africa

    Melo Jaime de, Scientific Director, FERDI (Fondation pour les études et
                          Recherches sur le développement international)
Industrial and Structural Transformation in Sub-Saharan Africa - Melo Jaime de, Scientific Director, FERDI Fondation pour les études et ...
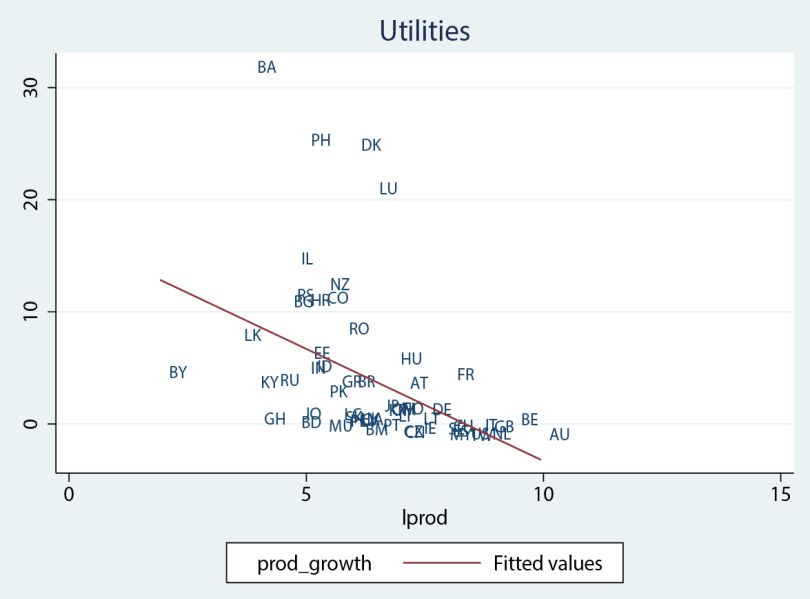
Summary of study commissioned by AFD (1)
          Reforms, Growth and poverty

• End of lost generation (70-95); reforms picked up
  and macroeconomic distortions fell (here)
• … growth picked up; poverty down sharply (here)
• … but the poverty gap with other regions persists
  (here)
• The elasticity of poverty reduction to growth is
  varied across regions and lower in SSA (here)
• Are we witnessing another resource-driven
  boom-bust cycle? (here)
                                                 2
Industrial and Structural Transformation in Sub-Saharan Africa - Melo Jaime de, Scientific Director, FERDI Fondation pour les études et ...
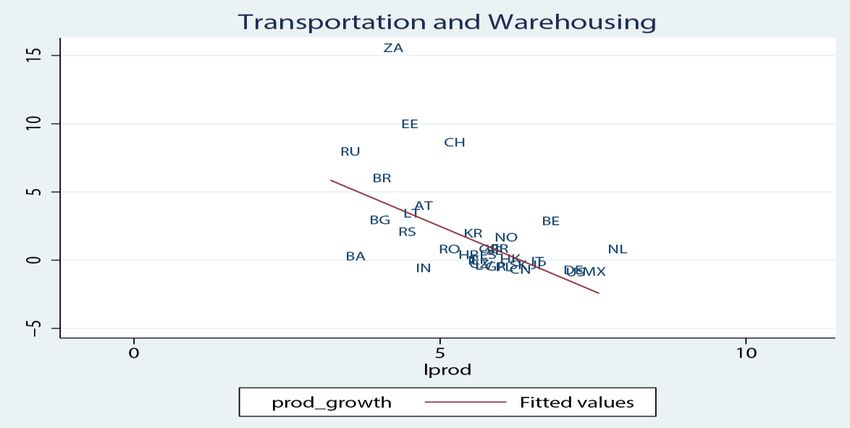
Summary of study commissioned by AFD(2)
        Trade and industrialization patterns

• SSA export basket diversified «as expected» (here)
• Export surges have ratchet effect and associated
  with real exchange rate depreciation (here)
• Industrialization is poverty reducing mostly in
  initally high-poverty countries (here)
• Premature de-industrialization confirmed (here)
• …as in Ethiopia and Mauritius (here)
• Labor has not shifted to high productivity growth
  sectors (here)                                 3
Industrial and Structural Transformation in Sub-Saharan Africa - Melo Jaime de, Scientific Director, FERDI Fondation pour les études et ...
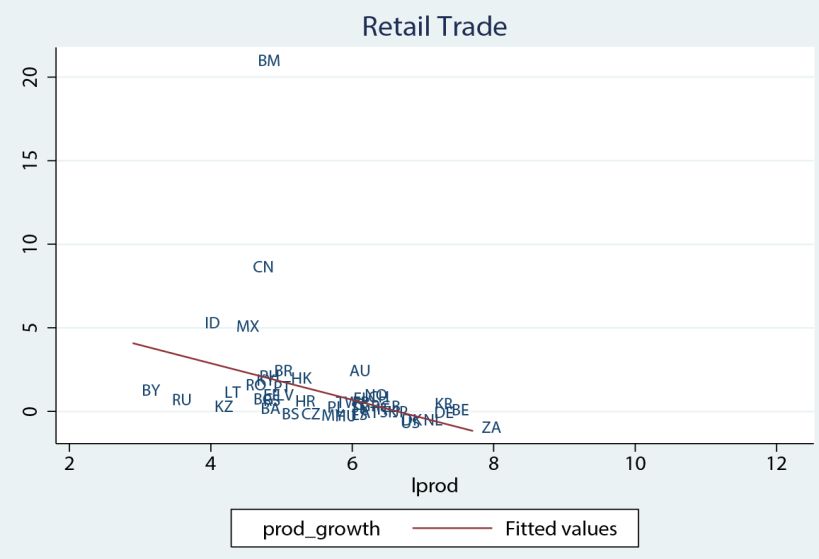
Summary of study commissioned by AFD(3)
De-industrialization but possible convergence by
                services activities

• As latecomers, SSA have lower levels of mfg. VA
  and employment at mfg. peak (here)
• High labor costslow mfg. Employment ? (here)
• Lack of conditional convergence (here)
• Convergence in services, a possible structural
  transformation paradigm for SSA? (here)
• TFA: improve customs &reduce trade costs(here)
                                                4
Industrial and Structural Transformation in Sub-Saharan Africa - Melo Jaime de, Scientific Director, FERDI Fondation pour les études et ...
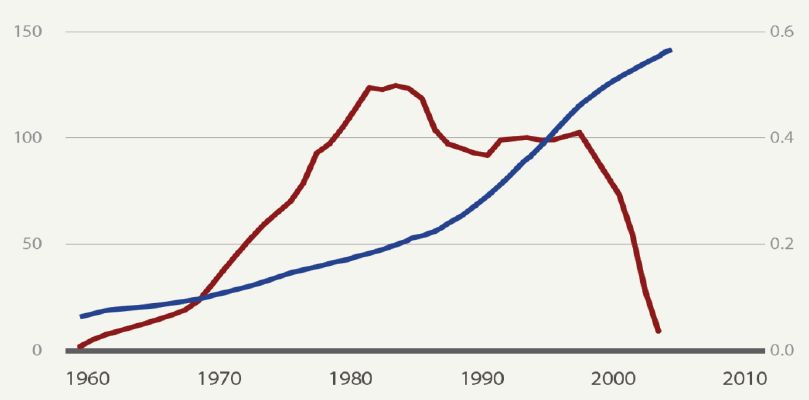
Summary & Recommendations
• Reforms, favorable external environment  growth ↑ and
  poverty ↓ (although the elasticity of poverty reduction to
  growth is low in SSA)
• Manufacturing has contributed to poverty reduction
  especially for those with initially high poverty
• Ressources have not shifted towards high productivity
  growth sectors
• SSA has not taken up labor intensive activities (Labor costs
  too high because of lack of appropriate skills?)
• Can the service sector (now increasingly tradable) help
  convergence?
• Trade costs are high. Take up opportunity offered by TFA to
  reduce customs-releated trade costs
                                                                 5
Thank you

            6
Industrial and Structural
        Transformation in Sub-
           Saharan Africa
                                Jaime de Melo
                                    FERDI

Nairobi,           The Future of Financing for Development Opportunities: Challenges and
December 16 2015
                   Danish Priorities for Financing Development in the Next Decades
Extra Material

                 8
Macroeconomic Distorsions and Reforms in SSA 1960-2010
      Black Market Premium (%)                Reform Index : Giuliano et al. (2013)

                      Black Market                                    Reform Index
                    Premium (left axis)                                (right axis)

     Source: Cadot et al. (2015). Figure 4 from UNECA (2014) based on Giuliano, Mishra and
     Spilimbergo (2013)                                                                      9
                                                                                             (back)
GDP Growth and Poverty

                                                                                                 GDP per capita growth by
                                                                                                   region (1950-2010)

                                                                                    60                                                               1700
                                                                                    58
                                                                                                                                                     1600
                                                                                    56

                                                                                                                                                            Real GDP per capita
                                                                Poverty Headcount
                                                                                    54                                                               1500
Source: Cadot et al. (2015). Figure 2(a) from Rodrik (2011).
                                                                                    52                                                               1400
                                                                                    50
                                                                                                                                                     1300
   GDP per capita and                                                               48
                                                                                    46                                                               1200
   poverty headcount ratio                                                          44
                                                                                                                                                     1100
                                                                                    42
   in SSA                                                                           40                                                               1000
                                                                                         1981 1984 1987 1990 1993 1996 1999 2002 2005 2008 2011

                                                                                                     Poverty Headcount Ratio at $1.25 a day (PPP)
                                                                                                     GDP per capita (constant 2011$)
                                                                                                                                                    10
                                                               Source: Cadot et al. (2015). Figure 2(b) from PovcalNet and WDI.                     (back)
Poverty Headcount Ratio by Region, 1981-2011
                                80

                                70

                                60
            Poverty Headcount

                                50

                                40

                                30

                                20

                                10

                                0
                                     1981      1984        1987   1990     1993       1996       1999   2002     2005      2008      2011

                                     East Asia & Pacific                 Europe & Central Asia             Latin America & the Caribbean

                                     Middle East & North Africa          South Asia                        Sub-Saharan Africa

Note: Poverty headcount ratio at 1.25$ per day (2005 PPP)
Source: Cadot et al. (2015) Figure 5 from PovecalNet.                                                                                       11
                                                                                                                                            (back)
Poverty Reduction (HC) vs. GDP per capita Growth

                                                         20%
                                                                 0%
                                                                       0%         2%            4%         6%             8%
               SSA
                                                         15%    -10%

                                 y = -3.5631x - 0.0406                                                y = -4.8361x - 0.4157
                                                                -20%
                                                         10%                           SSA
                                                                -30%

                                                         5%
                                                                -40%

                                                         0%     -50%
                                                                              ECA                    SA
   -2%   -1%         0%     1%          2%          3%
                                                                -60%        LAC
                           EAP                           -5%
                                                                                         MENA
                          ECA                                   -70%

                                                         -10%
                             MENA                               -80%
         LAC                                       SA                                                                    EAP
                                                         -15%   -90%

     GDP per capita growth                                         GDP per capita growth

Note: Poverty line at 1.25$ per day (PPP). 101 countries ( 43 SSA). HC= head count
Source: Cadot et al. (2015). Figure 6 from PovcalNet.                           12
                                                                                                                          (back)
Resource Abundance and Growth
                                                     South is Africa excluded.

                                                      RP have had a
                                                     relatively stable growth
                                                     ≈ 5% p.a.

                                                      Running out of
                                                     steam is attributable to
                                                     RR group

Note: Resource-rich = Resource rents > 15% of GDP
Source: Cadot et al. (2015). Figure 7(b) from WDI.                         13
                                                                           (back)
Export Concentration in SSSA is driven by RR Countries

                8
                6
                4
                2

                    4                6               8                10           12
                                          GDP per capita (log), PPP

                             Other Countries                 Resource-Poor (SSA)
                             Resource-Rich (SSA)             Fitted values

                                                                                        14
Source: Cadot et al. (2015). Figure 9 from IMF, Diversification Toolkit.                (back)
Export Surges in SSA
                                               (event analysis results)
12

11                                                                                                          Export surges have a
10
                                                                                                            ratchet effect on the
 9
                                                                                                            level of exports…
                                                                                      4.68
 8

                                                                                      4.66
 7
     -5   -4   -3     -2     -1      0   1    2       3         4                5
                                                                    REER (log)
                    Sub-Saharan Africa        Other Countries                         4.64

Source: Cadot et al.(2015). Figure 11 from Woldemichael (2015)                        4.62

     … and seem to be                                                                  4.6

     associated with a                                                                4.58

     temporary REER                                                                          -5   -4   -3     -2      -1

                                                                                                            Sub-Saharan Africa
                                                                                                                                 0   1   2      3

                                                                                                                                         Other Countries
                                                                                                                                                           4     5

     depreciation
                                                                                     Source: Cadot et al. (2015). Figure 13 from Woldemichael (2015)
                                                                                                                                                           15
                                                                                                                                                               (back)
In SSA, industrialization is poverty-reducing mostly
     in countries with high initial poverty rates

   Source: Cadot et al. (2015). Figure 15 from PovcalNet and WDI.   16
                                                                    (back)
Premature de-Industrialization in SSA
.5
.4

                                        SWZ
.3
.2

                                                    MUS
.1
 0

      4              6               8                    10             12
                           GDP per capita (log)

           Other Countries                        Resource-Poor (SSA)
           Resource-Rich (SSA)                    Trend (Other Countries)
           Trend (Resource-Poor, SSA)             Trend (Resource-Rich, SSA)

 Source: Cadot et al. (2015). Figure 16 from WDI.                              17
                                                                               (back)
Mauritius and Ethiopia trajectories confirm premature
                                                                  de-industrialization

                                                               Mauritius                                                                                                                       Ethiopia
10.0 12.0 14.0 16.0 18.0 20.0 22.0 24.0 26.0

                                                                                                                                                                 8.0
                                                             1987
                                                                    1988                                                                                                                     1997
                                                                         1990        1998 1999
                                                    1986     1989            1992 1996
                                                                    1991                         2000
                                                                         1993     1995 1997 2001

                                                                                                                                                                 7.0
                                                                                1994               2002
                                                                                                        Manufacturing VA (% GDP)
                                                                                                     2003
                                                        1985
                                                                                                        2004
                                                                                                        2005                                                                                2002
                                                                                                                                                                                    1999    .

                                                                                                                                                                 6.0
                                                                                                          2006                                                                                 .
                                                     1984                                                                                                                                     2000
                                                                                                                                          2008                                                    2004
                                                                                                                                            2009                               1998 1996
                                                                                                                                   2007                                                          1987
                                                                                                                                                   2011 2013
                                                    1983
                                                   1981
                                                    1982                                                                                    2010                                          1988 .         2005
                                                  1980                                                                                             2012                                1995
                                                   1976                                                                                                                                                         2006 2007

                                                                                                                                                                 5.0
                                                      1979
                                                    1977
                                                     1978                                                                                                                               1989 1990
                                                                                                                                                                                              1986   1981
                                                                                                                                                                             1994
                                                                                                                                                                                              1982       1983
                                                                                                                                                                                           1985                      2008
                                                                                                                                                                             1993                                                  2010         2011

                                                                                                                                                                 4.0
                                                                                                                                                                                                                                                               2013
                                                                                                                                                                                                                            2009

                                                                                                                                                                                                                                                   2012
                                                                                                                                                                                       1991
                                      8.0

                                                                                                                                                                 3.0
                                                                                                                                                                              1992

                                                 2000               3000           4000            5000                                   6000            7000         100                     150                    200                 250                  300
                                                                                    GDP per capita                                                                                                              GDP per capita

                                               Source: Cadot et al. (2015). Figure 18 from WDI.                                                                                                                                                           18
                                                                                                                                                                                                                                                          (back)
Decomposition of productivity growth in SSA 1960-2010
       4

       3

       2
                                                               Static labor reallocation effect

                                                               Within-sector effect
       1

                                                               Dynamic labor reallocation effect

       0
               1960-1975         1975-1990         1990-2010

       -1

       -2

Source: Cadot et al. (2015). Figure 22 adapted from Timmer et al (2014).                           19
                                                                                                   (back)
SSA countries are latecomers in
            industrialization. They exhibit lower levels of
             manufacturing VA and employment at peak
                             share in GDP
        Manufacturing VA (% GDP)                                                                                            Employment in manufacturing
50

                                                                                                                      .5
                                Employment in Manufacturing at its peak
40

                                                                                                                      .4
                                                                                       ZMB

                                                                                                                                                                                MUS
30

                                                                                                                      .3
                                                                                       ZWE
                                                                               MUS
                                                  ZAF
                                                CMR        LSO
                   GNB                       MWI SYC
20

                                                                                                                      .2
                                           RWA           SEN
                    BFA                                       MOZ
                         GHA                         CIV        NAM                                                                                                 GHA
                                           TCD
                                            BDI
                                             CPV                  KEN
                        BEN      AGO   MRT  CAF ERI TZA      MDG                                                                                                                              KEN
             BWA             NGA
10

                                                                                                                      .1
                    SOM              GAB TGO SLE SDN UGA
                                     COG                                                                                                                                                        SEN
                             LBR                     ETH   STP                                                                                                NGA                        BWA
                                       MLI                          GIN                                                                                                                          ETH
                                   NER                                 COM                                                                                                ZMB              MWI
                                                                                                                        0                                                                        TZA
 0

     1960      1970         1980                                                1990            2000         2010           1940               1960             1980                  2000             2020
                                                                          Peak Year                                                                           Peak Year

                                                                                                                                   Other Countries                        Sub-Saharan Africa, uncensored
              Other Countries                                                                Sub-Saharan Africa
                                                                                                                                   Sub-Saharan Africa, censored           Fitted values
              Trend, Sub-Saharan Africa                                                      Trend, Other Countries

Source: Cadot et al. (2015). Figure 23(a) from WDI                                                                    Source: Cadot et al. (2015). Figure 23(b) from
                                                                                                                      Groningen Growth and Development Center 20
                                                                                                                                                                                                  (back)
High labor costs in Sub-Saharan Africa seem to explain
         the lack of employment creation in manufacturing

Country comparisons : high mfg. labor costs
                                                                                                                    … a pattern confirmed by regression
in selected SSA countries …
                                                                                                                    analysis
2500

                                                                                                         8000
                                                                            GDP per capita (2005 $)
                                Labor costs in manufacturing, 2005 $

2000
                                                                            Labor cost, annual

                                                                                                         6000
1500

                                                                                                         4000
1000
                                                                                                                                                          AGO

                                                                                                         2000
                                                                                                                                             KEN
                                                                                                                                          ZMB
                                                                                                                                UGA     TZA      SEN
 500                                                                                                                          MLI             NGA
                                                                                                                        ETH             MOZ
                                                                                                                0                 GHA

                                                                                                                    5                   6               7                8               9
   0                                                                                                                                             GDP per capita (log)
         Zambia   Tanzania   Kenya                                     Nigeria   Bangladesh      India
                                                                                                                                        Other Countries            Sub-Saharan Africa
                                                                                                                                        Fitted values              Fitted values
       Source: Cadot et al. (2015). Figure 25 from
       Gelb et al. (2013)                                                                                       Source: Cadot et al. (2015). Figure 26 adapted
                                                                                                                from Gelb et al. (2013)                     21
                                                                                                                                                                                        (back)
Lack of Conditional Convergence in SSA
                                             (positive slope)

               10
                                                                   GNQ

                           ETH
                 5

                                 TCD
                          MOZ                 GHA    CPV
                                                                 MUS
                                  BFA LSO                  NAM    BWA
                                                                         SYC
                           NER GIN KEN        MRT
                                                           SWZ
                 0

                         MWI       GNB
                                   TGO

                                       ERI
                                               ZWE
               -5

                     6                           8                      10                      12
                                                GDP per capita PPP in 2000
                                 Other countries                               Resource-Rich (SSA)
                                 Resource-Poor (SSA)                           Fitted values
                                 Fitted values, Resource-Rich (SSA)

Note: Slope of the line is the marginal effect of the initial level of GDP per capita
(2000) on subsequent growth (2000-2012) after controlling for human capital
Source: Cadot et al. (2015). Figure 28(b) from WDI.                                                  22
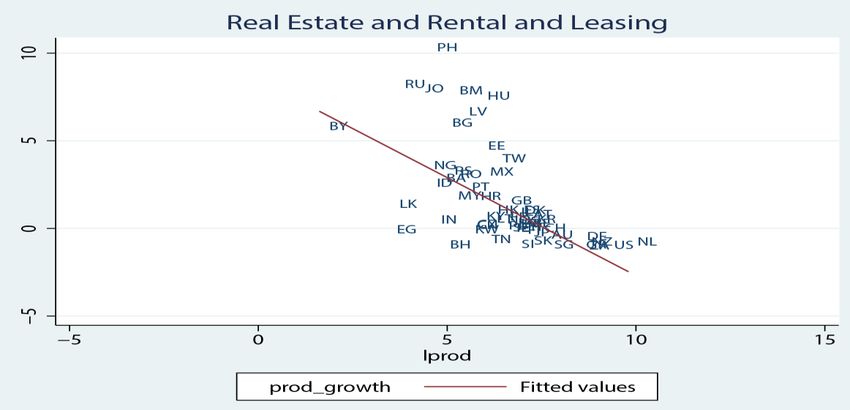
                                                                                                     (back)
Convergence in services, a possible structural transformation
              paradigm for Sub-Saharan Africa?

                                                                  23
Source: Cadot et al. (2015) Figure 31                             (back)
OECD Trade Facilitation Indicators for Customs (range : 0-2)
                                                                         LDCs                          non-LDCs

                                 Information availability (A)

                       Involvement of trade community (B)

                                       Advance rulings (C)

                                    Appeal procedures (D)

                                     Fees and charges (E)

                               Formalities - documents (F)

                               Formalities - automation (G)

                              Formalities - procedures (H)

                    Border agency cooperation - internal (I)

                   Border agency cooperation - external (J)

                           Governance and impartiality (L)

                           Average of OECD TF Indicators

                                                                0   .5    1     1.5       2   0   .5      1       1.5      2

                                                      Landlocked         non-Landlocked           LDCs                  Non-LDCs
Median time in import customs (in days)                   5                    2                   5                       2
Median time in export customs (in days)                   3                    2                   3                       2

                                                                                                                                   24
Source: De Melo and Wagner (2015). Table 4                                                                                         (back)
References
Cadot, Olivier, Jaime de Melo, Patrick Plane, Laurent Wagner, Martha Tesfaye
Woldemichael, (2015) “Industrialisation et Transformation Structurelle: L’Afrique
sub-saharienne peut-elle se développer sans usines?”, AFD, no 2015-10
http://www.afd.fr/webdav/shared/PUBLICATIONS/RECHERCHE/Scientifiques/Pa
piers%20de%20recherche/10-papiers-recherche.pdf

De Melo and Wagner (2015), “Aid for Trade and Trade Facilitation: What they can
do for LDCs”, FERDI

Gelb, Alan, C. Meyer and B. Ramachandran (2013), “Does Poor Mean Cheap? A
Comparative Look at Africa’s Labor Costs”, CGDEV

Giuliano, P.; P. Mishra et A. Spilimbergo (2013), “Democracy and Reforms:
Evidence from a New Dataset”, NBER working paper 18117.

Groningen Growth and Development Center, 10-Sector Database
http://www.rug.nl/research/ggdc/data/10-sector-database
                                                                              25
References (2)
IMF, Diversification Toolkit: Export Diversification and Quality Databases
https://www.imf.org/external/np/res/dfidimf/diversification.htm

Timmer, M.; G. de Vries et K. de Vries (2014), “Patterns of Structural Change in
Developing Countries”; GGDC Research Memorandum 149.

UNECA (2014), Economic Report on Africa 2014, Addis Ababa, 2014.

Woldemichael, Martha (2015), “Export Accelerations and the Exchange Rate” (in
progress).

World Bank, PovecalNet Database. http://iresearch.worldbank.org/PovcalNet/

World Bank, World Development Indicators Database.
http://data.worldbank.org/data-catalog/world-development-indicators

                                                                               26
You can also read