Unilever Half Year 2021 Results - Alan Jope & Graeme Pitkethly 22nd July 2021
←
→
Page content transcription
If your browser does not render page correctly, please read the page content below
Unilever Half Year 2021
Results
Alan Jope & Graeme Pitkethly

22nd July 2021
Safe harbour statement

This presentation may contain forward-looking statements, including ‘forward-looking statements’ within the meaning of the United States Private Securities
Litigation Reform Act of 1995. Words such as ‘will’, ‘aim’, ‘expects’, ‘anticipates’, ‘intends’, ‘looks’, ‘believes’, ‘vision’, or the negative of these terms and other similar
expressions of future performance or results, and their negatives, are intended to identify such forward-looking statements. These forward-looking statements are
based upon current expectations and assumptions regarding anticipated developments and other factors affecting the Unilever Group (the ‘Group’). They are not
historical facts, nor are they guarantees of future performance.

Because these forward-looking statements involve risks and uncertainties, there are important factors that could cause actual results to differ materially from those
expressed or implied by these forward-looking statements. Among other risks and uncertainties, the material or principal factors which could cause actual results to
differ materially are: Unilever’s global brands not meeting consumer preferences; Unilever’s ability to innovate and remain competitive; Unilever’s investment choices
in its portfolio management; the effect of climate change on Unilever’s business; Unilever’s ability to find sustainable solutions to its plastic packaging; significant
changes or deterioration in customer relationships; the recruitment and retention of talented employees; disruptions in our supply chain and distribution; increases or
volatility in the cost of raw materials and commodities; the production of safe and high quality products; secure and reliable IT infrastructure; execution of
acquisitions, divestitures and business transformation projects; economic, social and political risks and natural disasters; financial risks; failure to meet high and
ethical standards; and managing regulatory, tax and legal matters. A number of these risks have increased as a result of the current Covid-19 pandemic.

These forward-looking statements speak only as of the date of this document. Except as required by any applicable law or regulation, the Group expressly disclaims
any obligation or undertaking to release publicly any updates or revisions to any forward-looking statements contained herein to reflect any change in the Group’s
expectations with regard thereto or any change in events, conditions or circumstances on which any such statement is based.

Further details of potential risks and uncertainties affecting the Group are described in the Group’s filings with the London Stock Exchange, Euronext Amsterdam and
the US Securities and Exchange Commission, including in the Unilever Annual Report and Accounts 2020.

                                                                                                                                                                                   2
Alan Jope

Unilever Half Year 2021 Results

22nd July 2021
Strong delivery despite headwinds

        Growth                   Profit           Earnings & Cash          Competitiveness

 H1 Underlying Sales       Underlying Operating   Current Underlying EPS   % Business Winning MAT
      Growth                     Margin

        5.4%                  18.8%                  (2.0)%
                                                                                 52%
                                                     +4.3% constant

        4.0%               (100)bps                 €2.4bn
H1 Underlying Volume       Underlying Operating      Free Cash Flow
      Growth                Margin vs H1 2020

MAT: Moving Annual Total
                                                                                                    4
Guided by our strategic choices

1. Develop our portfolio into high growth spaces

2. Win with our brands as a force for good, powered by purpose & innovation

3. Accelerate in USA, India, China and leverage EM strength

4. Lead in the channels of the future

5. Build a purpose-led, future-fit organisation and growth culture

                             Operational Excellence
                                                                              5
Strategic change agenda

                                                                                    Develop eB2B
       Portfolio change                   High growth segments                     Share Buy Back
                                                                                 business platforms

• Announced the acquisition of          • Prestige 27% H1 USG               • Share buy back of up to €3bn
  digital-led, cruelty free skin care                                         underway
  brand Paula’s Choice                  • Functional Nutrition 18% H1 USG
                                                                            • Reflects strong free cash flow
• Operational separation of Tea                                               delivery and balance sheet
  business substantially complete                                             position

                                                                                                               6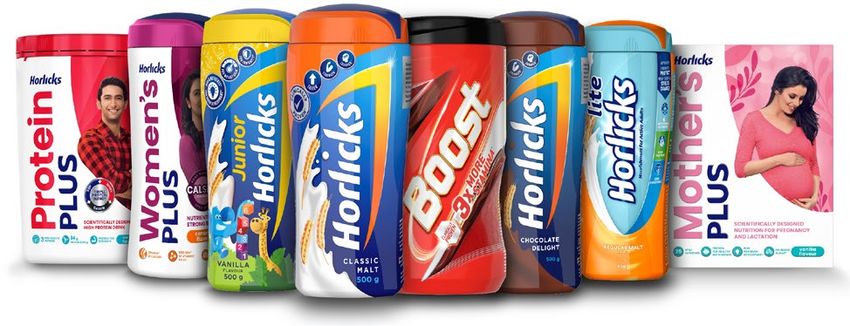
Category dynamics

                                                                                                                                                                                    All figures USG%
                                                                                                                           Laundry
                                                                                                                                                    6%       7%
                                                                                                                                        4%   2%
                                                                                                                           0%

                                                                                                                                (1 )%
                                                                             Hygiene
                                                                                    26%
                                                                                           19%
                                                                              7%                  11%     5%

                                                                                                                  (1 0)%
                           Prestige                             34%
                                                                                                                                         Personal Care
                                                                                                                                                                               10%
                                                          21%
                                             8%
                                                                                                                                         (2 )%            (3 )% (2 )% (0 )%
                            (2 )%                 (5 )%
                                                                             Functional Nutrition
                                    (1 0)%                                                                                                       (1 0)%

                                                                                                         54%
                                                                                    39% 45% 33%

                                                                                                                  9%

                           In Home                                                                                                                                Out of Home
                                                                                                                                                                                                        48%
                                    1 7%
                                             12% 13% 11%
                                                                                                                                                                                                   4%
                            4%
                                                                                                                                                                  (1 8)%            (1 6)%(2 0)%
                                                                (2 )%                                                                                                      (4 2)%

Hygiene: Skin Cleansing + Home & Hygiene
Out of Home: Food Service + Out of Home Ice Cream
Personal Care: Personal Care excl. Skin Cleansing and Prestige                                                                                                                                                7
Functional Nutrition: Health Foods Drinks + Vitamins, Minerals & Supplements; Horlicks reflected in USG from Q2
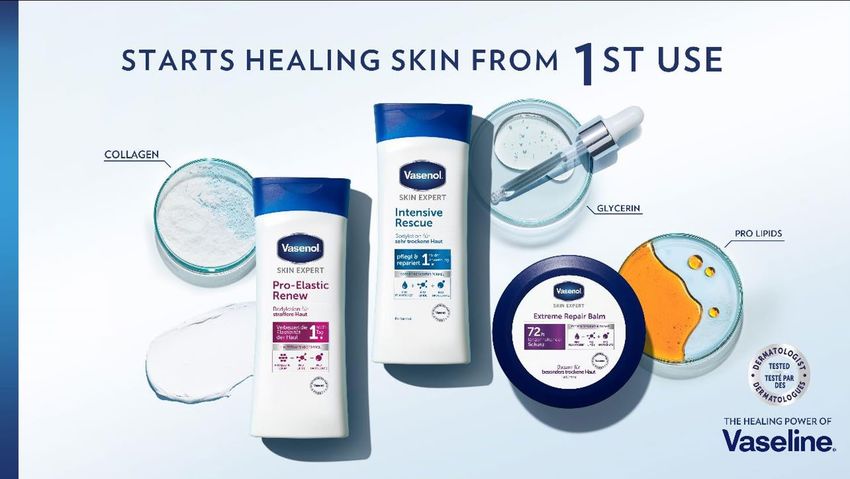
3.3%      1.8%
   Beauty & Personal Care                                                                        H1 USG    H1 UVG

                                Skin Cleansing H1 (4)%

                                                                           • Skin cleansing lapping
                                                                             household stocking in 2020,
                                                                             remains above 2019 levels

                                                                           • Skin Care, Hair, Oral and
                                      Rest of BPC H1 +5%                     Deodorants all grew as social
                                                                             occasions partially returned

                                                                           • Step up in pricing in Q2

Rest of BPC: Hair care, Deodorants, Skin Care, Oral Care, excl. Prestige
                                                                                                              8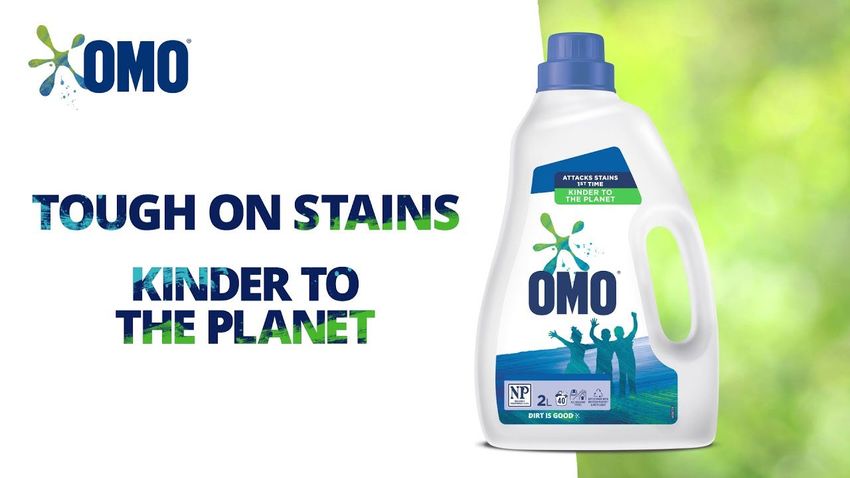
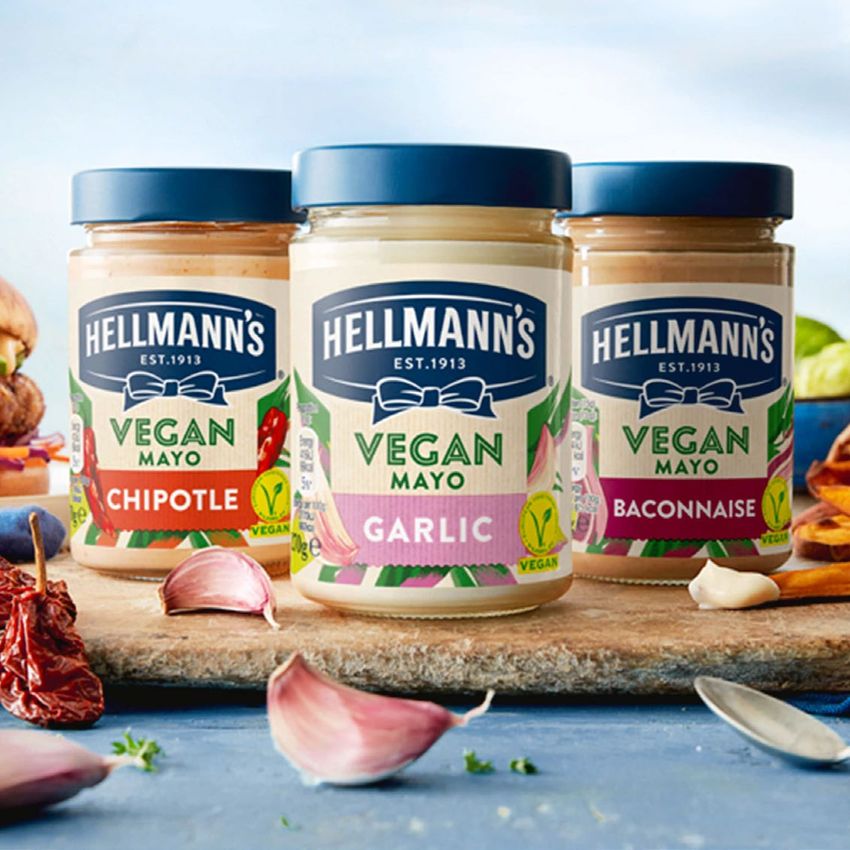
8.1%     5.8%
   Foods & Refreshment                                                                                          H1 USG   H1 UVG

                                        In-home H1 +4%

                                                                                            • In-home growth driven by power
                                                                                              brands Knorr, Hellmann’s,
                                                                                              Magnum

                                                                                            • Food Service growth driven by
                                                                                              China. Global demand remains
                                   Out of home H1 +26%                                        below pre-COVID levels
                    Food Service remains impacted vs 2019 base
  2019 base                                                                                 • Ice Cream grew across in-home
                                                                                              and out of home
                 (71)% April
                                                                         +37% H1 2021

   J     F     M      A     M       J    J   A   S   O   N   D   J   F     M    A   M   J

UFS included in other categories
                                                                                                                              9
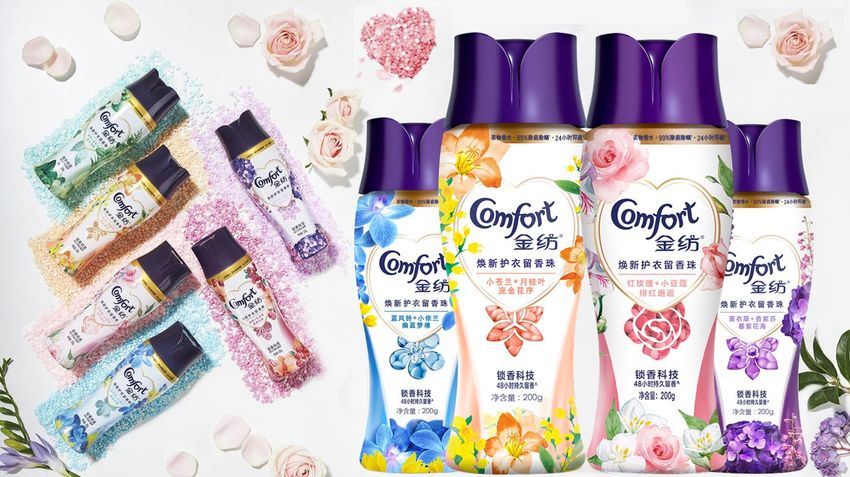
4.5%     4.8%
Home Care                                           H1 USG   H1 UVG

      Home & Hygiene H1 (1)%

                               • Home & Hygiene lapping surge
                                 demand

                               • Laundry growth driven by China
                                 and strong innovation
                                 programme rooted in Clean
            Laundry H1 +6%       Future agenda

                               • Price accelerated through the
                                 half

                                                                 10
Prestige & Functional Nutrition
Prestige H1 +27%
• Strong Prestige performance
across on and off line channels
• Functional Nutrition growing
strongly (Horlicks and Boost
Functional Nutrition H1 +18% brands in USG from Q2)
• Functional Nutrition LFL growth
+31% during the first half
Functional Nutrition: Health Foods Drinks + Vitamins, Minerals & Supplements
11Ecommerce
China Omnichannel
+34% +44%
USA Pure play
+16% +29%
India eB2B
>100% +105%
H1 USG +50% 11% of group turnover
12Graeme Pitkethly Unilever Half Year 2021 Results 22nd July 2021
5.4%     4.0%
Volume and price growth                                                  H1 USG   H1 UVG

USG   (0.3)%   4.4%     3.5%     5.7%     5.0%

                                                   •   Focus on operational excellence
                                 1.0%                  and our five strategic choices
                                                       continues to drive competitive
                                          1.6%         growth

UPG                              4.7%
                                                   •   Pricing stepping up to offset
UVG                                       3.3%
                                                       commodity inflation headwinds.
                                                       UPG of 2.2% in June

                                                   •   Operating environment remains
                                                       volatile
      '20 Q2   '20 Q3   '20 Q4   '21 Q1   '21 Q2

                                                                                    14
7.7% 6.4%
Asia / AMET / RUB H1 USG H1 UVG
USG (1.8)% 4.5% 2.6% 9.9% 5.7%
• C hina: continued strong
consumer demand driven by
online
1.2%
• India: strong growth with
UPG lockdown impact less severe
4.5% than last year
UVG
• Turkey: volume-led double digit
growth across all divisions
• SEA: markets severely impacted
'20 Q2 '20 Q3 '20 Q4 '21 Q1 '21 Q2
159.5% 3.1%
Latin America H1 USG H1 UVG
USG (0.8)% 6.5% 5.8% 7.2% 11.9%
• Strong pricing action in response
to high commodity inflation and
currency devaluation
7.4%
• Brazil: resilient growth during
UPG crisis
UVG 4.2%
• Mexico: strong growth across all
divisions
• C olombia: operations disrupted
by civil unrest
'20 Q2 '20 Q3 '20 Q4 '21 Q1 '21 Q2
162.6% 1.0%
North America H1 USG H1 UVG
USG 9.5% 9.1% 7.1% 4.3% 1.1%
• Growth across all divisions
despite lapping peak of surge
demand
• Accelerating price growth with
competitiveness improving
UPG 0.9%
UVG • In-home foods demand remains
3.3% high. Growth impacted by prior
2.2%
year household stocking
(1.1)%
• Strong contribution from Prestige
and Food Solutions as channels
'20 Q2 '20 Q3 '20 Q4 '21 Q1 '21 Q2
recover
171.1% 2.2%
Europe H1 USG H1 UVG
USG (4.5)% (0.8)% 0.8% (2.3)% 4.0%
• Volume growth led by out of
home ice cream in Q2
4.7%
• Price declined whilst lapping
lower promotional intensity
UPG
(0.6)%
UVG • UK & Germany: lapping spike in
household stocking in Q2 2020
• France: deflationary retail
environment
'20 Q2 '20 Q3 '20 Q4 '21 Q1 '21 Q2 • Italy & Netherlands:strong
growth
18Turnover +0.3%
USG 5.4%
1.5%
1.3% (0.1)%
4.0%
A & D 1.4%
(6.1)%
€25.7 bn €25.8 bn
19Underlying operating margin (100)bps
C O VID-19 Bps
Year
impact impact
vs H1 Mix (10)
2020 On cost 0
vs H1 Mix (50)
2019 On cost (40)
(60)bps
19.8% 40bps
18.8%
(80)bps
20Even higher commodity inflation
Commodity
Crude oil Soy bean oil Freight Packaging
inflation
+12% +21% +4% +7%
vs Q 1 2021 vs Q 1 2021 vs Q 1 2021 vs Q 1 2021
D’19 M’20 J’20 S’20 D’20 M’21 J’21 D’19 M’20 J’20 S’20 D’20 M’21 J’21 D’19 M’20 J’20 S’20 D’20 M’21 J’21 D’19 M’20 J’20 S’20 D’20 M’21 J’21
Crude oil Soy bean oil North America truck freight Resin (PE)
H2 inflation high-teens expected
21Underlying earnings per share
Current Underlying EPS (2.0)%
0.8%
1.5% 0.4%
2.9% (1.4)%
(6.3)%
€1.35
Constant Underlying EPS +4.3% €1.33
22Cash flow & balance sheet
Cash Net Debt Pension Surplus
Free Cash Flow Net debt / EBITDA
€2.4bn 2.0x €1.9bn
€(0.4)bn €22.4bn €0.3bn
vs H1 2020 Net debt FY 2020 H1 2021
23Alan Jope Unilever Half Year 2021 Results 22nd July 2021
Summary & outlook

               Summary                                       Outlook

Strong first half underpinned by
operational excellence
                                             Full year USG well within our 3-5% multi-
                                             year framework
Continued progress on portfolio evolution

Pricing stepping up

                                             Full year UOM around flat

Cost inflation accelerating in second half

                                                                                         25
Vision
Our vision
is to be the global leader in
sustainable business. We will
demonstrate how our purpose-led,
future-fit business model
drives superior performance,
consistently delivering financial
results in the top third of our industry.Unilever Half Year 2021 Results Alan Jope & Graeme Pitkethly 22nd July 2021
You can also read