CORE OPERATION IMPROVING - PRESENTATION OF Q1 2019 RESULTS Vilhelm Már Þorsteinsson - Eimskip.com
←
→
Page content transcription
If your browser does not render page correctly, please read the page content below

CORE
      OPERATION
      IMPROVING

PRESENTATION OF Q1 2019 RESULTS
Vilhelm Már Þorsteinsson
THIS IS EIMSKIP
Eimskip is a leading transportation company in the North Atlantic with connections to international
markets and is specialized in worldwide freight forwarding services, with the vision of providing
excellence in transportation solutions and services

ABOUT                                                    KEY FIGURES Q1 2019

       63 OFFICES                 19 VESSELS             REVENUES: EUR 164 m            GEOGRAPHICAL SPLIT
                                                                                        OF REVENUE

       20 COUNTRIES               200 TRUCKS             EBITDA: EUR 15,5 m
                                                         (EUR 10,6 m excl. IFRS16)

                                  29 WAREHOUSES
       1800 EMPLOYEES                                    TOTAL ASSETS: EUR 519 m
                                  16 COLD STORAGES

                                  ACHIEVEMENT
       44 NATIONALITIES           COOPERATION            EQUITY: EUR 233,3 m
                                  TRUST
KEY HIGHLIGHTS FOR Q1
                         IMPROVED OPERATING RESULTS IN NORWAY

    STREAMLINING MEASURES AND ORG. CHANGES STARTING TO PAY OFF

    INCREASED ACTIVITY AND VOLUME IN THE TRANS-ATLANTIC SERVICES

                    POSITIVE DEVELOPMENT IN REEFER FORWARDING

                               OPERATIONS IN ICELAND GOING WELL

3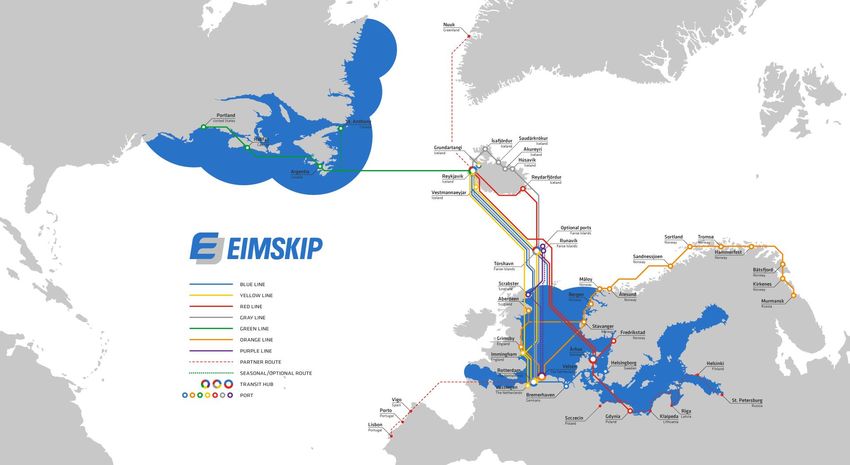
OPERATING
    ACTIVITIES

4
VOLUME IN LINER SERVICES
Container Liner volume up 9.0% but Reefer Liner services down 23.0%
Tons '000
3.000
2.500
Strong growth in container
liner volume in Q1
2.081
1.928 1.998
2.000 1.821
1.500
4.6%
Reefer liner volume in Q1
1.000 2019 was down as was
expected – two fewer
500 vessels in operation
485 507
0
2015 2016 2017 2018 2018 Q1 2019 Q1
5
GEOGRAPHICAL SPLIT OF LINER VOLUME
Increase in container liner services and Trans-Atlantic | Decrease in Norway

VOLUME SPLIT

6
VOLUME IN FORWARDING SERVICES
Reefer forwarding volume up 8.7% but dry forwarding volume down
Good growth in reefer
forwarding volume in Q1
Discontinued client
contract in China explains
drop in dry forwarding
volume but has a limited
effect on results
7
CATEGORY SPLIT OF FORWARDING VOLUME
Dry cargo contract in China discontinued | Increased share of reefer cargo

VOLUME SPLIT

8
EIMSKIP IS ALREADY OPERATING
     IN LOW SOx ZONES IN EUROPE
     AND NORTH AMERICA
     BLUE AREA IS 0,1% SOx FROM 1.1.2015
     WHITE AREA IS 3,5% SOx UNTIL 1.1.2020
     AND 0,5% THERE AFTER

14
FUEL PRICE DEVELOPMENT
Average spread between gas oil and heavy oil has been approx. USD 200
USD/MT
Approx. 53% of total fuel consumption of
the vessel fleet is gas oil and 47% heavy
fuel oil
From 1.1.2020 it is estimated that share
of gas oil will increase to approx. 75%
given comparable sailing system
Eimskip will operate three vessels fitted
with scrubbers in 2020
Fuel consumption is approx. 80,000 tons
on annual basis
Average spread between gas and heavy
oil is USD 200
Estimated cost increase will be approx.
USD 3-4 million depending e.g. on
sailing system, scrubber utilization and
fuel spread
Low sulfur surcharge applied to offset
cost increase
13
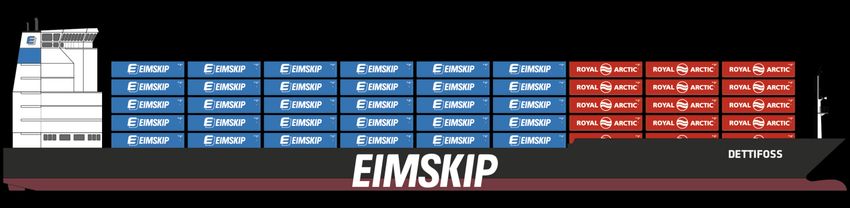
Source: Bunkerworld.comCOOPERTION WITH ROYAL ARCTIC LINE (RAL)
Eimskips’ two new vessels will replace two almost twenty five years old less efficient vessels
Vessel sharing agreement between Eimskip and RAL approved by the ICA in April this year
Three new 2,150 TEU container vessels (2 x Eimskip & 1 x RAL) expected in service late 2019
Weekly services between Greenland, Iceland, Faroe Island and Scandinavia
Larger vessels provide economy of scale and are more environmentally friendly
Eimskip will provide RAL with stevedoring services in Iceland DETTIFOSS
CARGO CAPACITY - EIMSKIP WILL HAVE 2/3 AND RAL 1/3 OF EACH VESSEL
BRÚARFOSS
11FINANCIAL
RESULTS
30INCOME STATEMENT
Operational improvements in Q1
Revenue growth of EUR 8.5 million or
5.4%
EBITDA EUR 10.6 million excluding IFRS
16 an increase of EUR 3.4 million
Considerable increase in EBIT or EUR 2.8
million
One-off tax expense amounting EUR 3.4
million following a ruling of Internal
Revenue Board
13RESULTS BY BUSINESS SEGMENTS Improvements in both Liner and Forwarding Services 14
GEOGRAPHICAL SPLIT OF REVENUE
Increase in Europe and Faroe Islands

REVENUE SPLIT

15
SPLIT OF TOTAL OPERATING EXPENSES
Almost half of operating expenses is volume driven
COST SPLIT
Cost development in global
transportation markets affects cost of
3rd party logistics services
Other expenses include e.g. fuel
expenses, operational cost of vessels
and equipment, IT and general
operating cost
16EBITDA BRIDGE Best first quarter EBITDA since 2009 17
BALANCE SHEET
Balance sheet affected by new accounting standard IFRS 16
EUR thousand 31.3.2019 31.12.2018 Change %
Non-current assets 366,833 335,172 31,661 9.4%
Fixed assets 314,156 313,765 391 0.1%
Approx. EUR 34 million
increase in assets and
Right-of-use assets 33,612 0 33,612 -
liabilities due to IFRS 16
Other non-current assets 19,065 21,407 (2,342) (10.9%) effects
Current assets 152,235 151,124 1,111 0.7%
Assets 519,068 486,296 32,772 6.7%
Equity ratio 44,9% and
48,1% excluding IFRS 16
Equity 233,301 238,926 (5,625) (2.4%)
Non-current liabilities 165,785 140,753 25,032 17.8%
Current liabilities 119,982 106,617 13,365 12.5%
Liabilities 285,767 247,370 38,397 15.5%
Equity and liabilities 519,068 486,296 32,772 6.7%
18FINANCIAL RATIOS FROM 2016 TO 2019
Excluding IFRS 16, leverage ratio decreases from year-end 2018
NET DEBT / EBITDA NET DEBT AND EQUITY RATIO
EUR million
175 100%
Net debt
Equity ratio 90%
150
80%
125 70%
60%
100
50%
75
40%
50 30%
20%
25
10%
41.6 102.8 137.7 167.9 134.3
0 0%
2016 2017 2018 3M 2019 IFRS adj.
18CASH FLOW DEVELOPMENT
Substantial increase in cashflow before debt service
Million EUR Q1 2019 Q1 2018
Positive improvement in
cash generation between
EBITDA 15.5 7.3
periods
Working capital changes & other 3.5 (5.6)
Taxes (0.5) (0.3)
Repayment and interest of lease liabilities (4.7) 0.0 Management has increased
Maintenance CAPEX net of sale (3.4) (5.9) focus on cash generation
Cash flow before debt service 10.3 (4.6) however considerable
investments forecasted in
Debt repayment and interests (3.6) (3.5)
the second half of the year
Cash flow before Investments 6.7 (8.1)
Net investments (6.3) (6.5)
Debt funding 4.2 13.7
Dividend to minority (0.2) (0.4)
Change in Cash 4.3 (1.3)
20OPERATING CAPEX AND INVESTMENTS
A decrease in CAPEX between periods but investments will be heavy in the second half of the year
CAPEX for Q1 2019 EUR 8.6 million
thereof maintenance CAPEX EUR 3.7
million
Substantial investments in long term
assets in 2019
Investment budget EUR 57.5 million
New vessels EUR 41.6 million -
useful life of 25 years
Gantry crane and harbor
investments in Sundahöfn EUR
11.4 million - useful life of 30+
years
Other investments EUR 4.4
million - useful life of 15+ years
21SUMMARY & GUIDANCE
1 STREAMLINING AND INTIGRATION MEASURES NOT FULLY MATERIALIZED
2 OPPORTUNITIES ASSOCIATED WITH COOPERATION WITH ROYAL ARCTIC LINE
3 UNCERTAINTY IN EXTERNAL ENVIRONMENT E.G. ICELANDIC ECONOMY AND TRADE TENSION
4 CONTINUED FOCUS ON OPERATIONAL EFFICIENCY TO IMPROVE CORE OPERATION
5 EBITDA GUIDANCE FOR THE YEAR IN THE RANGE OF EUR 51 – 57 MILLION*
* Excluding the effect of IFRS 16 of approximately EUR 19 millionTHANK
YOU
23DISCLAIMER Information contained in this presentation is based on sources that Eimskipafélag Íslands hf. (“Eimskip“ or the ”Company“) considers reliable at each time. Its accuracy or completeness can however not be guaranteed. Copyright of information contained in this presentation is owned by Eimskip. This presentation, including information contained therein, may not be copied, reproduced or distributed in any manner, neither wholly nor partly. This presentation is solely for information purposes and is not intended to form part of or be the basis of any decision making by its recipients. Nothing in this presentation should be construed as a promise or recommendation. Eimskip is not obliged to provide recipients of this presentation any further information on the Company or to make amendments or changes to this publication should inaccuracies or errors be discovered or opinions or information change. Statements contained in this presentation that refer to the Company’s estimated or anticipated future results or future activities are forward-looking statements which reflect the Company’s current analysis of existing trends, information and plans. These forward-looking statements are subject to a number of risks and uncertainties that could cause actual results to differ materially depending on factors such as the availability of resources, the timing and effect of regulatory actions and other factors. Eimskip undertakes no obligation and does not intend to update these forward-looking statements to reflect events or circumstances occurring after this presentation. You are cautioned not to place undue reliance on these forward-looking statements, which speak only as of the date of this presentation. All forward-looking statements are qualified in their entirety by this cautionary statement. By the receipt of this presentation the recipient acknowledges and accepts the aforesaid disclaimer and restrictions. 31
APPENDIX

     APPENDIX

25
CHINA FORWARDERS FREIGHT INDEX
Average price increased by 10% between Q1 2018 and Q1 2019
+10%
11You can also read