BALKRISHNA INDUSTRIES LTD - Investor Presentation - February, 2018 - BKT Tires
←
→
Page content transcription
If your browser does not render page correctly, please read the page content below
BALKRISHNA INDUSTRIES LTD
    Investor Presentation - February, 2018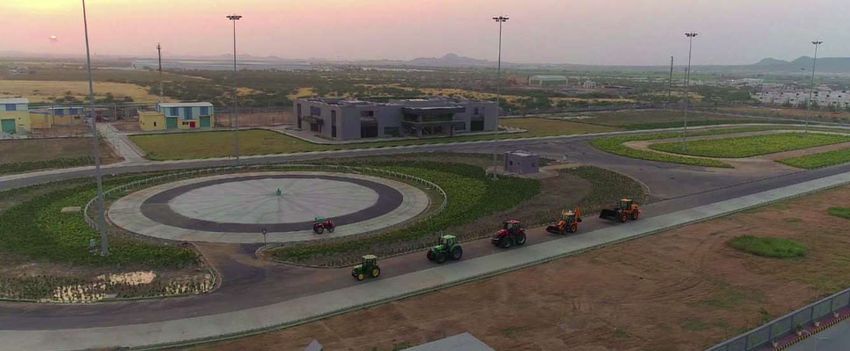
Safe Harbor

This presentation and the accompanying slides (the “Presentation”), which have been prepared by Balkrishna
Industries Limited (the “Company”), have been prepared solely for information purposes and do not constitute any
offer, recommendation or invitation to purchase or subscribe for any securities, and shall not form the basis or be
relied on in connection with any contract or binding commitment whatsoever. No offering of securities of the
Company will be made except by means of a statutory offering document containing detailed information about the
Company.

This Presentation has been prepared by the Company based on information and data which the Company considers
reliable, but the Company makes no representation or warranty, express or implied, whatsoever, and no reliance
shall be placed on, the truth, accuracy, completeness, fairness and reasonableness of the contents of this
Presentation. This Presentation may not be all inclusive and may not contain all of the information that you may
consider material. Any liability in respect of the contents of, or any omission from, this Presentation is expressly
excluded.

Certain matters discussed in this Presentation may contain statements regarding the Company’s market
opportunity and business prospects that are individually and collectively forward-looking statements. Such forward-
looking statements are not guarantees of future performance and are subject to known and unknown risks,
uncertainties and assumptions that are difficult to predict. These risks and uncertainties include, but are not
limited to, the performance of the Indian economy and of the economies of various international markets, the
performance of the tire industry in India and world-wide, competition, the company’s ability to successfully
implement its strategy, the Company’s future levels of growth and expansion, technological implementation,
changes and advancements, changes in revenue, income or cash flows, the Company’s market preferences and its
exposure to market risks, as well as other risks. The Company’s actual results, levels of activity, performance or
achievements could differ materially and adversely from results expressed in or implied by this Presentation. The
Company assumes no obligation to update any forward-looking information contained in this Presentation. Any
forward-looking statements and projections made by third parties included in this Presentation are not adopted by
the Company and the Company is not responsible for such third party statements and projections.

                                                                                                                       2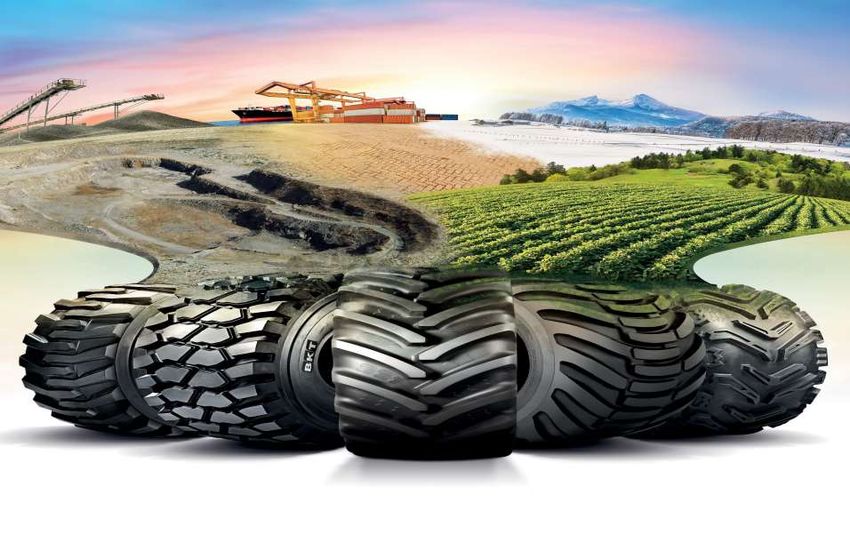
Our Performance

                  3
Performance Snapshot
                                                                                                   Bonus & Dividend
                                                                                                  Allotment of Bonus shares in the
                                                                                                  ratio of 1:1
                                        Profit After Tax

                                        Q3FY18 PAT at Rs 190 Cr                                   Declared 3rd Interim Dividend of

                                        9MFY18 PAT at Rs.546 Cr                                   Rs 1.50 per equity share in
                                                                                                  addition to Rs. 2.50 (Adjusted)
                                                                                                  per equity share declared in
                                                                                                  H1FY18
Revenue
                                                                                  EBITDA
Q3FY18 Revenue at Rs 1,161 Cr a growth of 26% YoY
                                                                                  Q3FY18 EBITDA at Rs.352 Cr with a margin of 30.3%
9MFY18 Revenue at Rs. 3,418 Cr a growth of 20% YoY
                                                                                  9MFY18 EBITDA at Rs. 1,014 Cr with a margin of 29.7%

                                                                  Volume
                                                                  Quarterly Volume at 49,553 MT, a growth of 23% YoY
                                                                  9MFY18 Volume growth at 15% to 145,212 MT

                                      FY18 Volume Guidance at 190,000-195,000 MT

                                                                                                                                      4
Profit & Loss
                                                                     Standalone
 Particulars (Rs.Cr)                       Q3FY18     Q3FY17      YoY %     9MFY18   9MFY17    YoY %

                              Sales (MT)   49,553     40,415      23%      145,212   126,271   15%

 Revenue from Operations                   1,106           896               3,233    2,783
 Realized Gain on Foreign Exchange           55            26                 185      76

                           Total Income    1,161          922     26%        3,418    2,860    20%

 Raw Material                               510            377               1,610    1,132
 (Increase) / Decrease in Stock              -5            -19                -33      -23
 Employee Expenses                           61            56                 180      165
 Other Expenses                             243            200                648      622
                                  EBITDA    352           308     14%        1,104    963       5%

 EBITDA Margin                             30.3%          33.4%             29.7%    33.7%

 Other Income #                              16            33                 50       101
 Interest & Finance Charges                  2              5                 10       16
 Depreciation                                80            79                 233      229
                       Profit Before Tax    286           257     11%        821      819       0%
 Tax                                         96            72                 275      241
                                     PAT    190           186      2%        546      578       -6%
 PAT Margin                                16.3%          20.1%             16.0%    20.2%

# Includes Investment Income and Unrealized Gain/(Loss)
                                                                                                       5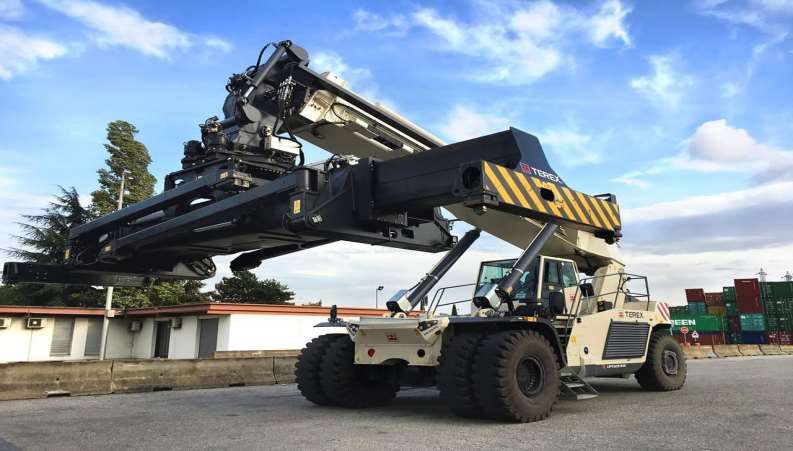
Balance Sheet
Particulars (Rs. Cr.)                        Sept'17   Mar'17     Particulars (Rs. Cr.)               Sept'17   Mar'17
ASSETS                                                           EQUITY AND LIABILITIES
Non-current assets                           3,621     4,044     EQUITY                                3,815    3,549
Property, Plant and Equipment                2,782     2,822
                                                                 Equity Share Capital                   19        19
Capital work-in-progress                       72       110
                                                                 Other Equity                          3,795    3,529
Investment Property                            23       23
Other Tangible Assets                          4         4
Financial Assets                               -                 Non-Current Liabilities               363       599
                                                         -
 (i) Investments                              536       888      Financial Liabilities
 (ii) Other Financial Assets                   8        40        (i)   Borrowings                      3        219
Income Tax Assets (Net)                        65       72        (i)   Other Financial Liabilities     3         0
Other non-current assets                      131       85       Provisions                             13        13
Current assets                               2,000     1,709     Deferred Tax Liabilities (Net)        332       353
Inventories                                   535       460      Other Non-Current Liabilities          12        15
Financial Assets
                                                                 Current liabilities                  1,444     1,605
 (i)   Investments                            509       459
                                                                 Financial Liabilities
 (ii) Trade Receivables                       459       412
                                                                  (i) Borrowings                       700       548
 (iii) Cash and cash equivalents               17       11
                                                                  (ii) Trade Payables                  324       363
 (iv) Bank Balances other than (iii) above     4         2        (iii) Other Financial Liabilities    239       641

 (v) Loans                                                       Other Current Liabilities             174        47
                                               21       24
 (vi) Others                                  149       175      Provisions                             6         6
Other Current Assets                          306       166
TOTAL                                        5,621       5,753   TOTAL                                5,621       5,753
                                                                                                                         6
Other Income and Net Forex Gain/(Loss)

                                                                 Standalone
Particulars (Rs. Cr)                             Q3FY18   Q3FY17        9MFY18     9MFY17
Exchange Difference Gain (Realized)                62       30            203        87

Exchange Difference Gain (Un-Realized)             11       5                 -5     -7

Others                                             5        28            55        108

Total Other Income                                 78       63            253       187

                                                                 Standalone
Particulars (Rs. Cr)                             Q3FY18   Q3FY17        9MFY18     9MFY17
Foreign Exchange Fluctuation on Sales              55       26            185        76

Foreign Exchange Fluctuation on Others             7        4             17         11

Total Realised Gain/(Loss) – A                     62       30            203        87
Foreign Exchange Fluctuation on Non Derivative
                                                   18       11            16         1
Items
Foreign Exchange Fluctuation on Derivate Item      -7       -6            -21        -8

Total Unrealized Gain/(Loss) - B                   11       5                 -5     -7

Net Forex Gain/(Loss) = A + B                     73       35             198        80
                                                                                            7
Long Term Debt Profile
1,440 Rs. Cr
Long Term Debt
-607 -23
-376
213
-217 -4
Mar-16 H1FY17 H2FY17 Q1FY18 Q2FY18 Q3FY18 Current Long
Term Debt
1,131 32 1,098
Cash Holdings
-211
-118 -333 -69
Mar-16 H1FY17 H2FY17 Q1FY18 Q2FY18 Q3FY18 Current Cash
Holdings
8Sales Profile
In MT FY18 Volume Guidance at
190,000MT – 195,000 MT
+17%
172,419
154,156
147,535 145,212
142,810
FY14 FY15 FY16 FY17 9MFY18
9Strategy at BKT
10Our Focus Area
Market Reach New
Expand reach within
existing Sales
Geographies
Channels as well Develop New Geographies
increase footprint and increase presence of
within replacement Brand BKT
segment and OEMs
Indian Markets Utilization
Strengthen our Increase Production from
distribution channels Bhuj and other plants so as
within Indian Markets to attain higher Utilization
levels and faster return on
Investments
11New R&D Center at Bhuj
12Carbon Black Plant at Bhuj
Setting up 60,000 MT p.a. Carbon Black Plant at Bhuj in
Gujarat
Plant to be Commence operations in FY 2019
Greater security of critical raw material ensuring smooth scale up to 100% utilization of
Tire Manufacturing Capacity
13To Serve Global OEMs…
14With India Production and Global Sales
Aurangabad,
Maharashtra
Bhiwadi,
Rajasthan
Chopanki,
Rajasthan
Our India – Our
Bhuj, Tire plants
Gujarat
Manufacturing base
15BKT – A Strong Indian Brand
16Balkrishna Industries – A snapshot
Leading ‘Off-Highway Tire” Exporter
BKT is India’s Leading player in the Global
‘Off Highway Tire (OHT)’ Market
Wide and comprehensive product portfolio
Deep understanding of OHT market has led to capabilities to
manufacture over 2,400 SKU
Capacities
Achievable capacities of ~300,000 M.T.P.A
Global Reach
Sales to over 130 countries through Distribution network in
Americas, Europe, India and Rest of the World
Experienced Management Team
Experienced Management Teams across business divisions and
verticals
Strong OEM Presence
Strong Partnerships with Global OEM’s a testimony of our
Brand Acceptance & Performance
17Our Strong Evolution
2009
Crossed
Rs.1,000cr
Turnover
India’s Largest
Off-Highway Tire
Manufacturer
18Application of our Tires
Agriculture Tires
Cotton Pick Harvester Tractor Vineyard Tractor Pivot Irrigator
Industrial Tires
Loader Telehandler Mobile Crane
OTR Tires
Load Haul Dump Underground Mining Container Handler
19For further information, please contact:
Company : Investor Relations Advisors :
Balkrishna Industries Ltd. Strategic Growth Advisors Pvt. Ltd.
CIN - L99999MH1961PLC012185 CIN - U74140MH2010PTC204285
Mr. B K Bansal, Director - Finance Mr. Shogun Jain / Ms. Payal Dave
bkbansal@bkt-tires.com shogun.jain@sgapl.net / payal.dave@sgapl.net
+91 77383 77756 / +91 98199 16314
www.bkt-tires.com www.sgapl.net
20You can also read