The Single-Family Outlook and its Impact on Multifamily - Svenja Gudell, Ph.D. Zillow Chief Economist @SvenjaGudell - NMHC
←
→
Page content transcription
If your browser does not render page correctly, please read the page content below
The Single-Family Outlook and its Impact
on Multifamily

2016 NMHC Research Forum        Svenja Gudell, Ph.D.
April 6-7, 2016              Zillow Chief Economist
                                 svenjag@zillow.com
                                     @SvenjaGudell
HOME VALUES, INVENTORY AND SALES
US HOME VALUES CONTINUE STEADY RECOVERY

    Zillow Home Value Index

                              Peak-to-   Peak-to-   Trough-to-
                              Trough     Current     Current
                              -22.5%      -6.8%      20.7%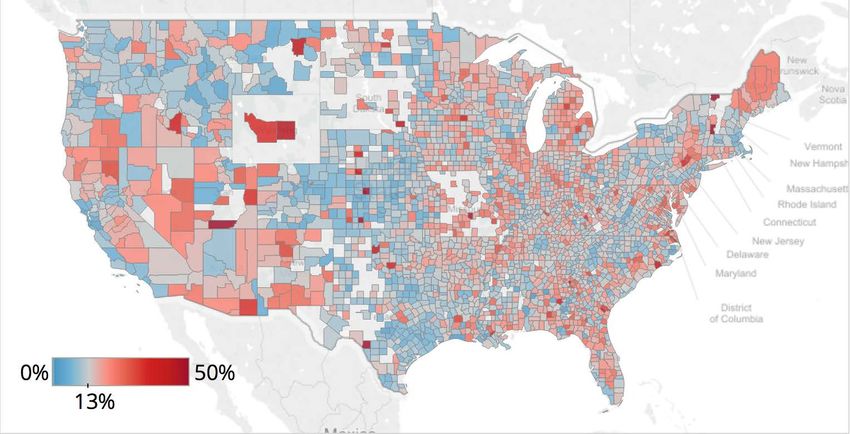
BUT RATE OF APPRECIATION HAS BEEN SLOWING

                                        Source: Zillow (February 2016)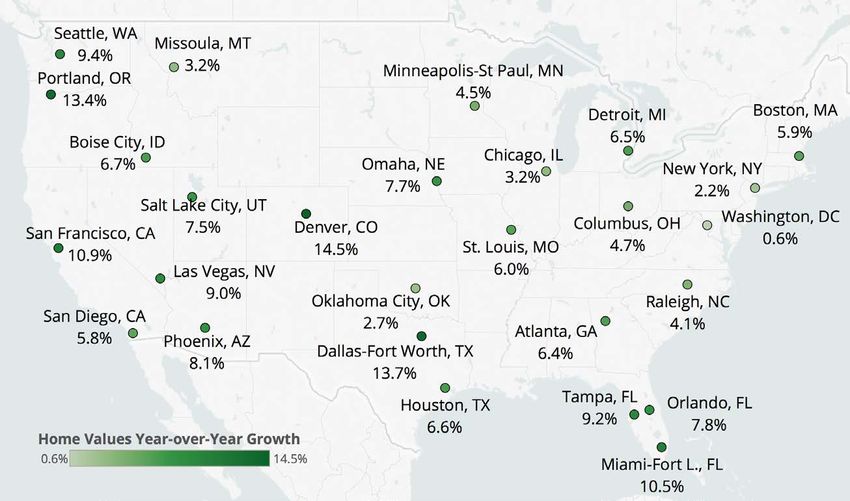
DENVER, DALLAS, PORTLAND & SF HAVE SEEN BIGGEST
ANNUAL GAINS IN HOME VALUES…

                                         Source: Zillow (February 2016)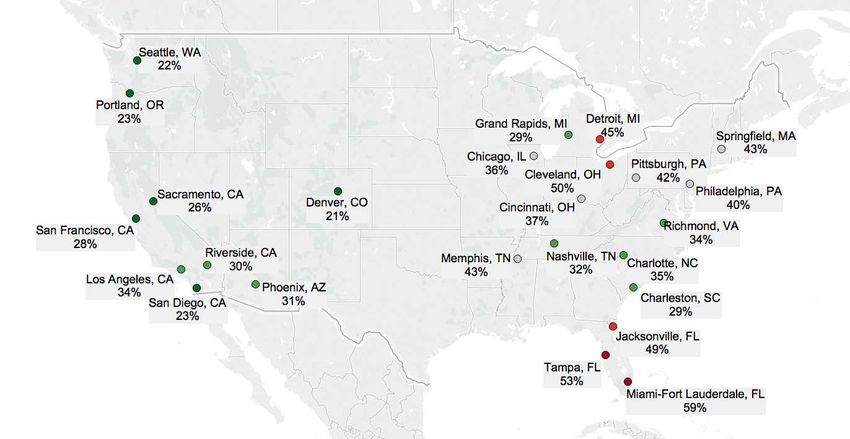
…DRIVEN BY DEMAND: JOB GROWTH BY INDUSTRY

                                       Source: Zillow (December 2015)
…AND SUPPLY: NATIONAL INVENTORY CONTINUES TO
DECREASE
                              Peak-to-   Year-over-
                              current      Year
                               -39%        -7.8%

                                                      Source: Zillow (February 2016)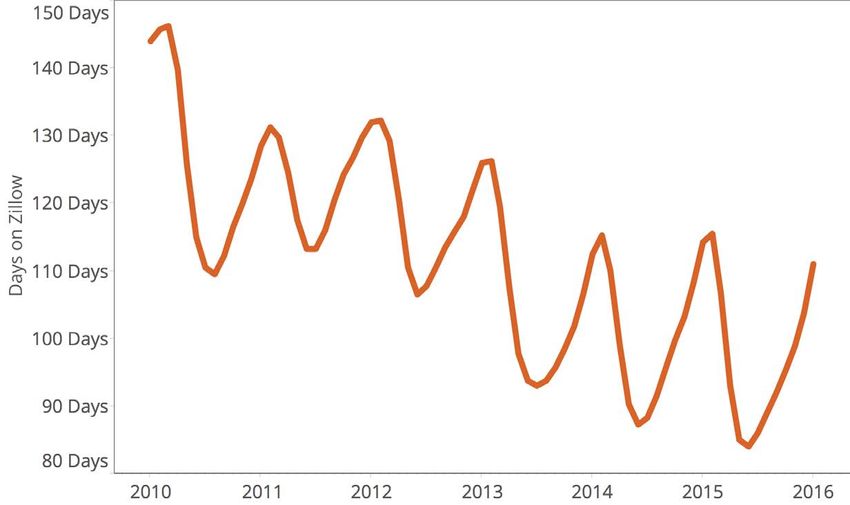
MORE TOP TIER HOMES AVAILABLE FOR SALE

                                             Seasonally Adjusted Data
                                         Source: Zillow (February 2016)
HOMES LISTED FOR SALE ARE SELLING MORE QUICKLY
THAN IN THE PAST FEW YEARS

                                   111 Days

                                              Source: Zillow (February 2016)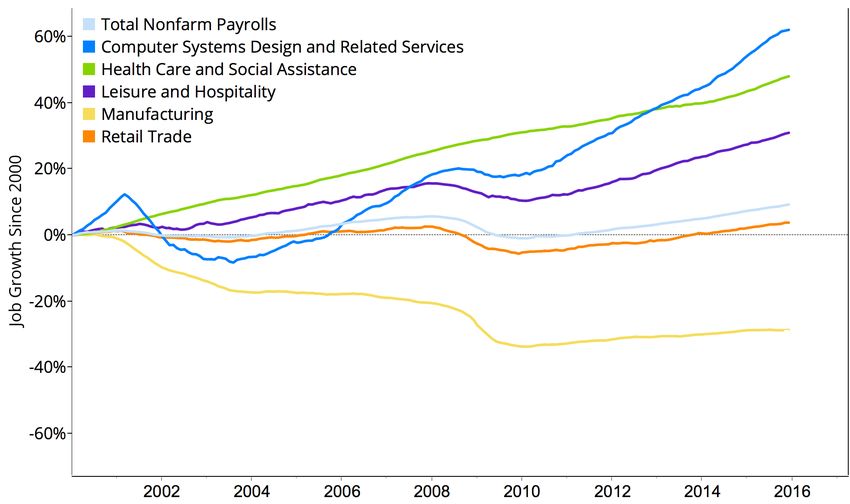
NEW HOME SALES STILL LAGGING
TOP 5 CAUSES OF SLOWER THAN EXPECTED PACE OF
NEW HOME CONSTRUCTION

1. High land costs/lack of parcels to develop in desirable locations

2. High labor costs/skilled construction labor shortages

3. Demand for single family homes is overstated in the news

4. Low builder profit margins for entry-level homes

5. High regulatory costs

                                                            Source: Zillow Home Price Expectations
                                                                                           Survey
BIGGER HOME, SMALLER LOTS
Percent Change in Median Home Size and Median Lot Size Since June 1999NEGATIVE EQUITY
NEGATIVE EQUITY IS STEADILY DECLINING

                                        Source: Zillow (2015 Q4)
THE U.S. NEGATIVE EQUITY RATE HAS FALLEN TO 13.1%,
BUT REMAINS MUCH HIGHER IN SOME AREAS
Source: Zillow (2015 Q4)MORTGAGE RATES AND FINANCING
MORTGAGE RATES ARE HOVERING NEAR ALL TIME LOWS
ALL-CASH PURCHASES MAKE UP A LARGE PART OF THE
MARKET IN FLORIDA, OHIO AND DETROIT
MORTGAGE AND RENTAL
AFFORDABILITY
NATIONWIDE, THE SHARE OF INCOME SPENT ON A
MORTGAGE PAYMENT IS WELL BELOW HISTORIC
NORMS

               24%          15%

            1985-1999
             Average       2015 Q4

                                             Source: Zillow (2015 Q4)
MORTGAGE AFFORDABILITY IN THE LARGEST METROS
Average
Mortgage Mortgage Forecasted at 5% Forecasted at 6% Forecasted at 7%
Region
Affordability Affordability Rates Rates Rates
1985 - 2000
United States 15% 21% 18% 20% 22%
Chicago, IL 14% 23% 16% 18% 20%
Los Angeles, CA 40% 35% 46% 51% 57%
New York, NY 25% 31% 29% 32% 35%
San Francisco, CA 41% 37% 48% 54% 59%
Washington, DC 17% 23% 19% 22% 24%
Source: Zillow (2015 Q4)NATIONWIDE, THE SHARE OF INCOME SPENT ON A
RENTAL PAYMENT IS WELL ABOVE HISTORIC NORMS
24% 30%
1985-1999
Average 2015 Q4
Source: Zillow (2015 Q3)RENTAL AFFORDABILITY IS LOWER THAN IT HAS EVER
BEEN IN MANY MARKETS
Source: Zillow (2015 Q3)RENTS CONTINUE TO GROW, ALBEIT AT A SLOWER
PACE
Source: Zillow (February 2016)SAN FRANCISCO IS STILL SEEING DOUBLE DIGIT
ANNUAL RENT GAINS
Source: Zillow (February 2016)SHARE OF SINGLE-FAMILY RESIDENCES THAT ARE
RENTALS
Rental Share of Single-Family ResidencesINCOME BY TIER
All
Top Tier
Bottom TierDEMOGRAPHIC TRENDS
MILLENNIALS HAVE POSITIVE VIEWS OF
HOMEOWNERSHIP
          Owning a home is            Owning a home is
                                                                                       Buying a home is the best
     necessary to live the good       necessary to be a     Owning provides a person
       life and the American                                     more freedom           long term investment a
                                    respected member of
                                                                                           person can make
                Dream                      society

                                                            75%

                                                                                                            69%
     67%                   66%                                                  67%
                                                                                       65%
                                                                   64%                               64%
                                                                                              62%
                                                                         60%
            57%
                   56%

                                  46%

                                        40%

                                               33%
                                                      31%

     18-34 35-49 50-64     65+    18-34 35-49 50-64   65+   18-34 35-49 50-64   65+    18-34 35-49 50-64    65+    Source: Zillow Housing
                                                                                                                        Confidence Index
DOUBLING UP IS A COMMON STRATEGY TO COPE
WITH INCREASINGLY EXPENSIVE HOUSING COSTS
Source: Zillow analysis of U.S. Census Bureau
Decennial Census and ACS data, IPUMSSINCE 2005, NEWLY FORMED HOUSEHOLDS HAVE
TENDED TO RENT
25%
20%
15%
10%
5%
Cum
0%
Total Owner Renter
1995 2000 2005 2010 2015
Source: Zillow analysis of U.S. Census Bureau
CPS Survey data 1995-2014, IPUMSCOMPARING FIRST-TIME BUYERS NOW AND THEN
(EARLY 1970S)
1970-1974 2010-2013
• Rented on average for 2.6 years before • Rent on average for 6 years before
buying buying
• Were 30.6 years of age • Are 32.5 years of age
• Households included 3 people • Households include just 2 people, so no
children yet
• Purchased a home worth $87k in today’s • Purchased a home worth $140k in
dollars today’s dollars
• Income was $53k in today’s dollars • Income is $54k in today’s dollars
Source: Zillow analysis of University of
Michigan Panel Survey of Income DynamicsCONDOS MAKE UP MORE THAN 40% OF FIRST-TIME
HOME PURCHASES, COMPARED TO 28% IN 2001
Source: Zillow analysis of Fannie Mae Single-
Family Loan performance credit dataURBAN, SUBURBAN, AND RURAL HOME VALUES OVER
TIME
Home Values Annual Home Value AppreciationHOMEOWNERSHIP RATE
EXPERTS EXPECT HOMEOWNERSHIP RATE TO RISE
SLIGHTLY
                               The national homeownership
                               rate had been falling steadily
                               over the past several years.
           63.8%
                               On average, experts polled by
                               Zillow say they expect the
                               homeownership rate to rise to
  Current homeownership rate
                               63.7% by 2020
THE BREAKEVEN HORIZON
Metros with the Metros with the
Longest Breakevens Shortest Breakevens
1. Honolulu, HI: 6 years 1. Memphis, TN: 1.1 years
2. Washington, DC: 4.5 years 2. Syracuse, NY: 1.2 years
3. Los Angeles, CA: 4.1 years 3. Dallas, Texas: 1.3 years
4. Stamford, CT: 4.1 years 4. Jackson, MS: 1.3 years
5. Lancaster, PA: 4 years 5. Columbia, SC: 1.3 yearsWHEN ZILLOW ASKED HUNDREDS OF CURRENT RENTERS WHY THEY DON’T OWN, THEY SAID… Income affordability (53%): • Because I can’t afford the maintenance, taxes and monthly payments of homeownership (18%) • Because I can’t qualify for a home loan (16%) • Because I don’t have a down payment saved for a home (13%) • Because I receive government assistance with my rent (6%) Lifestyle/preferences (26%): • I simply prefer to rent (20%) • I could afford to buy a home, but not the size or style or location that I would want (4%) • I like the amenities in my rental community/complex (2%) Uncertainty (15%): • I’m not certain how long I will live here, and/or I’m only living here for a short time (14%) • I recently sold my home and have not yet found another to buy (1%)
OUTLOOK
HOME VALUE GROWTH IS EXPECTED TO SLOW
FURTHER OVER THE NEXT YEAR

                                        Source: Zillow (February 2016)
RENTAL GROWTH IS ALSO EXPECTED TO SLOW
Source: Zillow (February 2016)FIND MORE ON WWW.ZILLOW.COM/RESEARCH
Local market reports
Real estate trends
Housing affordability
Forecasting
…and moreALL ABOUT ZILLOW
ZILLOW PUBLIC STATS

Zillow Group Traffic & Usage

•   In Q4, nearly 124 million average monthly unique users visited Zillow Group’s consumer brands.
•   30 million rental visitors come to Zillow Group’s rental sites and apps each month.

Mobile Facts

•   Most of Zillow Group’s traffic comes from mobile. For example, 2/3 of Zillow’s usage occurs on a
    mobile device; on weekends it’s more than 70%. In January, more than half a billion homes were
    viewed on Zillow Mobile – that’s 238 homes per second.

Data & User Generated Content

•   4 out of 5 U.S. homes have been viewed on Zillow.
•   Zillow has data on more than 110 million U.S. homes, with Zestimates and Rent Zestimates on
    more than 100 million U.S. homes.
•   More than 61 million homes on Zillow have been updated by our community of users.
THE BASICS OF VALUING HOMES Identifying only valid, arms-
length transactions
CLEANING
Physical attributes
Data from
multiple Tax assessments
sources
Prior sale prices SCORING
TRAINING
Models trained with Models applied to all
recently sold data homes every dayYou can also read