2019 New Mexico Substance Use Epidemiology Profile - Alisha Campbell, MPH Substance Abuse Epidemiologist Substance Abuse Epidemiology Section ...
←
→
Page content transcription
If your browser does not render page correctly, please read the page content below
2019 New Mexico Substance Use Epidemiology Profile

                         Alisha Campbell, MPH

                     Substance Abuse Epidemiologist
                  Substance Abuse Epidemiology Section

                   Epidemiology and Response Division

                    New Mexico Department of Health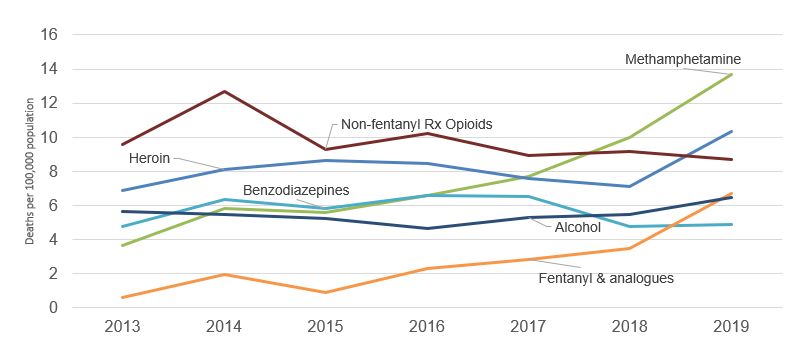
Indicator Sections
 § Consequences
     § Alcohol-Related Deaths and Hospital Discharges
     § Smoking-Related Deaths
     § Drug Overdose Deaths and Opioid Overdose Related ED Visits
     § Suicide Deaths

 § Mental Health
    § Adult and Youth Mental Health

 § Consumption
     § Alcohol
     § Illicit Drugs
     § Tobacco

Sections not updated
    § Depression – Last updated 2016

    § Adult Drinking and Driving – Next update 2020

Updates or Changes in Reporting
§ Alcohol Sections - ARDI – v2 to v3

§ Youth use of pain medication question updated
Using This Report:
§ A combined 5-year period (2015-2019) is used when presenting deaths, ED visits,
and hospital discharges.
§ More stable rates
§ Number of deaths, ED visits, or hospital discharges
§ Rates per 100,000
§ Survey-based measures –
§ BRFSS
§ Estimated number of persons & Percentages
§ YRRS
§ Percentages
§Maps
§4 categories
§White – Missing/insufficient data
§Lightest color – Lower than the state rate
§Middle color – Rates at or slightly above the state rate
§Darkest color – Rates substantially higher than the state rate
§For Consequences Indicators:
§Substantially higher = rates are at least 50% higher than the state rate
§For Survey Data:
§Substantially higher = rates are at least 25% higher than the state rateConsequences
Mortality Indicators, New Mexico, 2019

 New Mexico has increased rates of death across the majority of mortality
 indicators with the exception of smoking and alcohol-related motor vehicle
 crash deaths.

Data Source: February 2021 Substance Use Epidemiology Profile
Alcohol-Related Death Rates

             • New Mexico’s total alcohol-related death rate was more than twice the national rate.

             • Chronic and acute rates were higher than the national rate.

             • All Alcohol-Related death rates in McKinley and Rio Arriba counties were 2 to 3 times more
               than the state rate.

             • American Indian males and females had the largest burden across all alcohol related
               deaths in New Mexico.

             • Males had higher rates than women across all racial/ethnic groups

*Rate per 100,000, age-adjusted to the 2000 US standard population
Data Source: February 2021 Substance Use Epidemiology Profile
Alcohol-Related Deaths, NM 2015-2019:
Chronic and Acute Causes
Chronic Disease NM rate 39.1 US rate 16.3
Acute Injury NM rate 34.7 US rate 18.8
§ Rates for men were more than 2 times higher than women, (chronic: 52.1 v 23.5;
acute: 44.2 v 15.6).
§ The prevalence of chronic death was 4 times greater for American Indian men
(156.6 v 37.3) and more than 3 times greater for acute injury deaths (98.1 v 29.9).
§ Chronic death rates were more prevalent among ages 65+ (63.0), where acute injury
was ages 25-64 (43.3).
§ McKinley and Rio Arriba counties rates were more than twice the state rates, while
Bernalillo county accounts for more than 30% of the overall alcohol-related deaths
for both chronic and acute causes.
* Rates reflect only alcohol-attributable portion of deaths from cause
** Rates are rolling 5-year average per 100,000, age-adjusted to the 2000 US standard population
Data Source: February 2021 Substance Use Epidemiology ProfileDrug Overdose Death Rates, NM
2015-2019:
§ In 2019, New Mexico had the 12th highest total drug overdose death rate* in the
US.
§ NM Drug OD death rate = 26.4
§ US Drug OD death rate = 21.6
§ Men overdose death rates were approximately 2 times more than women overall.
• Hispanic men ages 25-64 had the highest rate (67.5) among men.
• Black and White women had similar rates (35.0 v 34.1).
• Rio Arriba had the highest death rate (83.6), at more than 3 times the state rate
and nearly 4 times the US rate. Bernalillo County accounted for 38% of overdose
deaths.
• Roughly 25% of the counties in New Mexico had rates 1.5 times higher than the
US Rate.
• Unintentional drug overdose deaths accounted for 86% of overdose deaths during
2015-2019.
Ø 42% involved illicit Ø 45% Rx opioids
Ø 32% involved Rx drugs Ø 33% heroin
Ø 26% involved both Ø 44% methamphetamine
Ø 17% benzodiazepines
Ø 13% cocaine
(not mutually exclusive)
*Rate per 100,000, age-adjusted to the 2000 US standard population
Data Source: February 2021 Substance Use Epidemiology ProfileMethamphetamine Drug Overdose
Rates*, NM 2015-2019
§ Methamphetamine was the substance identified most frequently in overdose deaths.
§ Males are more likely to experience an overdose death related to Methamphetamine
than females (10.2 v 4.1).
§ Methamphetamines with opioids (3.6) had the highest rate when compared to
methamphetamine alone (2.9) or with other substances (0.6).
§ Bernalillo county had the greatest burden with 39% of the state total including:
methamphetamine alone, with opioids, or with other substances.
Methamphetamine Overdose Hospital Discharges
§ Decreased 7% from 2018 – 2019
§ Males, ages 25-64 in Bernalillo County, have the highest rate of hospital discharge
for methamphetamine overdose.
*Rate per 100,000, age-adjusted to the 2000 US standard population
Data Source: February 2021 Substance Use Epidemiology ProfileOpioid Overdose, NM 2015-2019
§ Rx opioids contribute to 45% of unintentional overdose deaths*.
§ Heroin contributed to 33% of unintentional overdose deaths.
§ Deaths involving fentanyl increased substantially from 2018.
§ Highest incidence of Rx opioid overdose death occurred in males in Bernalillo
County.
Opioid Overdose Hospital Discharges
§ Increased 18% from 2018 – 2019
§ Males, ages 25-64 have the highest rate of hospital discharge for opioid
overdose.
§ Bernalillo County accounted for 40% of the states total opioid overdose
emergency discharges.
Opioid Overdose Related Emergency Department Visit Rates**, New Mexico, 2015-2019
*Each substance identified in a fatality is recorded and reported
**Rate per 100,000, age-adjusted to the 2000 US standard population
Data Source: February 2021 Substance Use Epidemiology ProfileSuicide Death Rates
Suicide Rates* by Age, Sex, and Race/Ethnicity, NM 2015-2019
§ The suicide rate in New Mexico has remained consistently higher than the US.
In 2019, the New Mexico rate (23.5) was more than 1.5 times the US rate
(13.9).
§ Non-Hispanic White males age 65 and older had the highest rates overall
(67.5).
§ Hidalgo and Catron counties had the highest rates in New Mexico, each at
least twice as much as the state rate and roughly 4 times the US rate.
* Age-specific rates per 100,000 to the 2000 US standard population
Data Source: February 2021 Substance Use Epidemiology ProfileMental Health
BRFSS Mental Health
       Indicator                                                      2015-2017   2017-2019     US 2019
       Frequent Mental Distress                                        12.5%*      14.3%          13.8%
                (past 30 days)

    § Frequent Mental Distress (FMD) is based on the single question, "How many
      days during the past 30 days was your mental health not good?" Respondents
      who report that they experienced 14 or more days when their mental health was
      "not good" are classified as experiencing FMD.

    § New Mexico residents are slightly higher than the US (13.8%) for FMD

                Frequent Mental Distress by Selected Characteristics, Adults Aged 18+, New Mexico, 2019

     § The prevalence of FMD was reported by people with selected characteristics, the highest
       risk being persons with past year suicidal ideation with (60.9) or without (48.7) a previous
       suicide attempt.

* Age-specific rates per 100,000 to the 2000 US standard population
Data Source: February 2021 Substance Use Epidemiology Profile
YRRS –
Feelings of Sadness or Hopelessness
US vs. NM, 2003-2019
NM by Gender, Grade Level, and Race/Ethnicity, 2019
§ Feelings of Sadness or Hopelessness defined:
§ Felt so sad or hopeless nearly every day for a period of 2 weeks that they stopped some normal
activities, within the past 12 months
§ NM (40.4%) has steadily increased since 2011 and is higher than the US (36.7%).
§ NM girls (50.7%) were nearly twice as likely to report feelings of sadness or hopelessness than boys (30.3%)
§ No variations by grade level or by race/ethnicity.
Data Source: February 2021 Substance Use Epidemiology ProfileYRRS - Seriously Considered Suicide
US vs. NM, 2003-2019
year
NM by gender, grade level, and race/ethnicity, 2019
§ Seriously Considered Suicide defined:
§ Seriously considered suicide within the past 12 months.
§ NM (18.8) was slightly higher than the US in 2017, however, in 2019 they are the same.
§ NM girls (24.8.%) were nearly twice as likely to report seriously considered suicide than boys (12.8%)
§ No variations by grade level or by race/ethnicity.
Data Source: February 2021 Substance Use Epidemiology ProfileYRRS - Attempted Suicide
US vs. NM , 2003-2019
NM by gender, grade level, and race/ethnicity, 2019
§ Attempted Suicide defined:
§ Attempted suicide at least one time in the past 12 months
§ NM (10.5%) for students reporting attempted suicide has remained higher than the US (8.9%).
§ The prevalence of NM girls (12.6.%) to report suicide attempts was statistically higher than boys
(8.4%).
§ Black students responded as having he highest prevalence of suicide attempts when compared to
other race/ethnicity, and there is no variations by grade level
Data Source: February 2021 Substance Use Epidemiology ProfileConsumption
BRFSS – Alcohol Use
      Indicator                                  2015-2017       2017-2019       US
      Adult Binge Drinking                           14.1%        14.7%         16.8%
      Adult Heavy Drinking                            5.2%         5.6%         6.5%

      § Adult Binge Drinking definition:
         § 1998-2005 - drinking 5 or more drinks on a single occasion at least once in the
             past 30 days
         § 2006-present - drinking 5 or more drinks (for men) or 4 or more drinks (for
             women) on a single occasion at least once in the past 30 days

      § Heavy Drinking definition: drinking more than 2 drinks/day on average (for men) or
        more than 1 drink/day (for women)

       Indicator                                          2016       2018         US
       Adult Drink and Driving                            1.4%       1.0%        1.7%
       Not updated 2019, next update 2020

         § Adult Drink and Drive definition:
            § Drove after “perhaps too much to drink” at least once in past 30 days

         § Binge drinkers are much more likely to report drinking and driving

         § The BRFSS reports show there has been a decline in adult drinking and driving
           since 2006 in NM
Data Source: February 2021 Substance Use Epidemiology Profile
Adult Binge Drinking
24.2
22.8
§ Ages 18-24 (22.8%) reported the largest occurrence of binge drinking.
§ Men reported binge drinking more than women across all age groups.
§ Across all race/ethnic groups Hispanics (16.8%) have the greatest prevalence of
binge drinking.
§ Bernalillo county has the largest burden of binge drinking, at 33.5% of the NM total.
Data Source: February 2021 Substance Use Epidemiology ProfileAdult Heavy Drinking
Adult Heavy Drinking Past 30 Days, Age 18+, NM, 1998-2019
§ Prevalence has remained relatively stable since 2000.
§ New Mexico responses to heavy drinking were higher than the US (6.5%).
§ Men reported more heavy drinking ages 25-64 (7.6%) , where women reported
more heavy drinking ages 18-24 (6.3%). Overall, men were more likely to
report heavy drinking.
§ Adult heavy drinking rates were highest among American Indian males (7.4%),
non-Hispanic White males (6.9%), and non-Hispanic White females (6.3%).
Data Source: February 2021 Substance Use Epidemiology ProfileYRRS Alcohol Use
Alcohol consumption is a major risk factor for the three leading causes of death among
youth (motor vehicle crashes, suicide, and homicide), as well as being associated with
poor academic performance and risk behaviors such as impaired driving, riding with a
drinking driver, physical fighting, increased number of sexual partners, and other
substance use.
Indicator 2017 2019 US 2019
Youth Current Drinking 26.2% 28.2% 29.2%
(Consumed any alcohol)
Youth Binge Drinking 10.9% 12.1% 13.7%
(boys:5 drinks/girls: 4 drinks)
Youth 10plus Drinks 4.5% 3.6% 3.1%
(drinks in a row/within a could
hours)
Youth Drink and Drive 6.5% 6.8% 5.4%
(drive a car after drinking)
§ Youth 10plus is the only youth alcohol indicator that decreased overall in
NM from the last survey
§ Youth 10plus and Youth Drink and Drive above the US
Data Source: February 2021 Substance Use Epidemiology ProfileYouth Alcohol Use
% by Gender, Grades 9-12, NM, 2019
Indicator Total Boys Girls
Youth Current Drinking 28.6 25.8 31.4
Youth Binge Drinking 12.1 11.0 13.2
Youth 10plus Drinks 3.6 4.4 2.8
Youth Drink and Drive 6.8 7.4 6.1
§ By gender: girls had a higher percent in current and binge drinking, boys were higher for
10plus drinks and driving after drinking
% by Grade Level, Grades 9-12, NM, 2019
Indicator 9th 10th 11th 12th
Youth Current Drinking 19.6 26.5 32.4 38.4
Youth Binge Drinking 6.8 9.5 15.0 19.2
Youth 10plus Drinks 1.8 3.1 4.7 5.4
Youth Drink and Drive 4.1 6.1 8.0 8.0
§ By grade level: as grade level increases, the percent of student reporting increases.
% by Race/Ethnicity, Grades 9-12, NM, 2019
Indicator AI A/PI Black Hispanic White
Youth Current Drinking 20.8 25.0 29.4 32.0 26.6
Youth Binge Drinking 8.6 8.4 14.3 13.7 11.0
Youth 10plus Drinks 11.6 4.7 4.9 4.1 3.5
Youth Drink and Drive 6.0 10.6 9.4 7.1 5.9
§ By race/ethnicity: no racial/ethnic differences across all indicators for alcohol.
Data Source: February 2021 Substance Use Epidemiology ProfileYouth Substance Use
§ Marijuana remained the highest reported of these substances, the prevalence has increased slightly
from 2017 to 2019. (NM is lower than the US (21.7%).
§ A change was made in the pain medication question, so this comparison is not exact
§ Slight increases in heroin, methamphetamines, and inhalants. While cocaine slightly declined.
§ Note: Prevalence of current alcohol (29.2%) use was greater than marijuana use (27.7%).
Data Source: February 2021 Substance Use Epidemiology ProfileYouth Substance Use (Continued) % By Gender, Grades 9-12, NM, 2019 Indicator Total Boys Girls Current Marijuana Use 27.7 27.4 28.1 Current Cocaine Use 4.8 6.3 3.0 Current Painkiller Use 11.3 11.2 11.3 Current Inhalant Use 5.5 6.0 5.0 Methamphetamine Current Use 3.3 4.9 1.7 Current Heroin Use 3.3 4.8 1.7 % By Grade Level, Grades 9-12, NM, 2019 Indicator 9th 10th 11th 12th Current Marijuana Use 21.7 26.7 31.0 33.0 Current Cocaine Use 3.1 5.2 5.9 4.6 Current Painkiller Use 10.7 12.8 11.5 9.3 Current Inhalant Use 6.4 5.7 6.3 3.0 Methamphetamine Current Use 2.3 3.9 4.7 2.2 Current Heroin Use 2.3 3.9 4.3 2.2 % By Race/Ethnicity, Grades 9-12, NM, 2019 Indicator AI A/PI Black Hispanic White Current Marijuana Use 33.1 25.6 30.5 29.5 22.4 Current Cocaine Use 5.7 8.0 11.0 5.0 3.0 Current Painkiller Use 13.1 12.3 18.1 12 8.4 Current Inhalant Use 6.7 12.9 11.6 5.3 4.2 Methamphetamine Current Use 4.1 8.8 9.6 3.1 2.2 Current Heroin Use 3.7 6.2 8.8 3.3 2.2 Data Source: February 2021 Substance Use Epidemiology Profile
Adult Smoking

             §     Adult Cigarette Smoking definition:
                     § BRFSS question – smoked 100 or more cigarettes in lifetime and smoked cigarettes
                         in the past 30 days
             • Adult smoking prevalence has steadily decreased since 2000
             • Current US Rate: 16.0

                                Smoking-Related Deaths

         §       Death rates from smoking increase with age, Age 65+ at a rate of 524.1* per 100,000.

         §       Rates are 2 times as high for men (128.7) compared to women (64.5) across all age groups.

         §       NM rate (93.4) is slightly lower than the US Rate (97.3)

* Rate per 100,000, age-adjusted to the 2000 US standard population.
Data Source: February 2021 Substance Use Epidemiology Profile
Youth Smoking
Youth Current Cigarette Smoking* by year, Grades 9-12, NM and US 2003-2019
Youth Current Cigarette Smoking by Grade Level, Gender, and Race/Ethnicity, Grades 9-12, NM 2019
§ NM rate (8.9) has steadily declined since 2003 and remained higher than the US rate (6.0)
consistently.
§ Boys (10.4) are more likely to smoke cigarettes when compared to girls (7.4)
§ Smoking cigarettes prevalence increased significantly with grade level.
§ Cigarette smoking is a leading cause of preventable death in the US and more than 80% of adult
smokers first smoke before age 18.**
* YRRS tobacco questions do not distinguish between ceremonial/traditional and commercial tobacco use.
** Youth and Tobacco Use. Centers for Disease Control and Prevention.
https://www.cdc.gov/tobacco/data_statistics/fact_sheets/youth_data/tobacco_use/index.htm
Data Source: February 2021 Substance Use Epidemiology ProfileYouth E-Cigarette Use
Current E-Cigarette Use by Year, Grades 9-12, New Mexico 2019
Current E-Cigarette Use, by Grade Level, Gender, and Race/Ethnicity, 9-12, New Mexico, 2019
§ The prevalence of current e-cigarette (34.0%) use was higher than the US (32.7).
§ There is little difference between girls and boys (34.0 v 34.1).
§ Prevalence of E-Cigarette use increases with grade level.
§ Hispanic students reported a higher rate of E-cigarette use over all other race/ethnicity.
§ While there has been significant decreases in cigarette smoking among youth, e-cigarettes
and other tobacco products have essentially erased that change.
100,000, age-adjusted to the 2000 US standard population.
Data Source: February 2021 Substance Use Epidemiology ProfileYou can also read