Employment and Social Developments in Europe - February 2018 Quarterly Review - European ...
←
→
Page content transcription
If your browser does not render page correctly, please read the page content below
Employment and
Social Developments
    in Europe

      Quarterly Review
      February 2018

      Social Europe
Employment, Social Affairs & Inclusion
ESDE Quarterly Review

                                                       February 2018

With regularly updated data and charts downloadable here

                                                           February 2018 I 1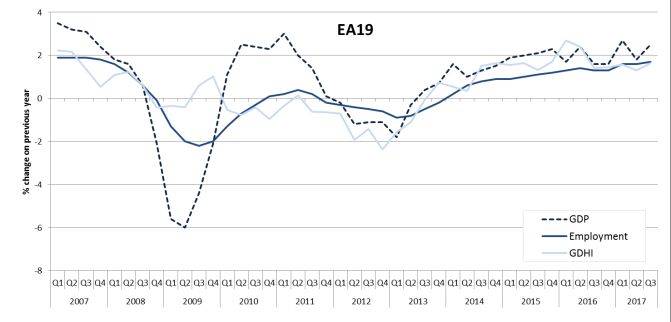
Employment, Social Affairs & Inclusion
ESDE Quarterly Review

The Employment and Social Developments Quarterly Review provides in-depth description of
recent labour market and social developments. It has been prepared by the Analysis Unit of the
Directorate-General for Employment, Social Affairs and Inclusion. This review was prepared
under the supervision of B. Kauffmann (Director) and L. Stemitsiotis (Head of Unit). The main
contributors were: D. Arranz and M. Grzegorzewska. Indicators on job findings and separation
rates were provided by A. Kowalski. The editor of this Review was D. Waterschoot, K. Jaksic and
A. Pisiotis.
A wide range of information sources have been used to produce this report, including Eurostat
statistics1, reports and survey data from the Commission’s Directorate-General for Economic
and Financial Affairs.
Regular updates of these data and charts are available at:
http://ec.europa.eu/employment_social/employment_analysis/quarterly/quaterly_updated_char
ts.xlsx
More reports are available on the employment and social analysis portal:
http://ec.europa.eu/social/main.jsp?catId=113&langId=en
Please send comments and questions to: empl-analysis@ec.europa.eu
Neither the European Commission nor any person acting on behalf of the Commission may be
held responsible for the use that may be made of the information contained in this publication.

More information on the European Union is available on the Internet (http://europa.eu).

Cataloguing data as well as an abstract can be found at the end of this publication.

Luxembourg: Publications Office of the European Union, 2018

ISSN 1977-8317

© European Union, 2018
Reproduction is authorised provided the source is acknowledged.

1
    To access them, see [codes] mentioned under the charts, to be used with the Eurostat data search engine:
    http://epp.eurostat.ec.europa.eu/portal/page/portal/statistics/search_database

                                                                                                  February 2018 I 2
Employment, Social Affairs & Inclusion
ESDE Quarterly Review
"I am pleased to present once again a positive quarterly report confirming that Europe is back
to solid growth. Over the latest quarters, employment in the EU has reached the highest levels
ever recorded with more than 236 million people in jobs. This Commission is fighting precarious
working conditions so the rise of permanent jobs and full-time employment is also very good
news. Even though large differences remain between EU countries, unemployment decreased in
all Member States. Youth unemployment in particular is falling steadily. These positive results
confirm that now is the moment to continue putting social at the heart of our political agenda.
Not all EU citizens have benefited from the economic recovery to the same extent. With the
adoption of the European Pillar of Social Rights, the European Commission, Member States and
social partners have built a compass towards better living and working conditions in the EU."
Marianne Thyssen
Commissioner for Employment, Social Affairs, Skills and Labour Mobility
February 2018 I 3Employment, Social Affairs & Inclusion
ESDE Quarterly Review
Table of Contents
1. Macroeconomic and employment developments and outlook ............................................ 11
Outlook ........................................................................................................................ 14
2. Employment in the EU and in Member States................................................................. 16
Employment rates in the EU and in Member States ............................................................ 20
3. Unemployment in the EU and in Member States ............................................................. 23
4. Long-term unemployment and additional potential labour force ....................................... 23
5. Income and financial situation of households ................................................................. 36
6. Productivity, labour costs and hours worked .................................................................. 39
7. Labour demand: vacancies, labour shortages and hiring activity ...................................... 45
Annex........................................................................................................................... 47
February 2018 I 4Employment, Social Affairs & Inclusion
ESDE Quarterly Review
List of country codes
EU Member States
AT: Austria
BE: Belgium
BG: Bulgaria
CY: Cyprus
CZ: Czech Republic
DE: Germany
DK: Denmark
EE: Estonia
EL: Greece
ES: Spain
FI: Finland
FR: France
HR: Croatia
HU: Hungary
IE: Ireland
IT: Italy
LT: Lithuania
LU: Luxembourg
LV: Latvia
MT: Malta
NL: The Netherlands
PL: Poland
PT: Portugal
RO: Romania
SE: Sweden
SI: Slovenia
SK: Slovakia
UK: United Kingdom
Further afield:
US: United States of America
JP: Japan
February 2018 I 5Employment, Social Affairs & Inclusion
ESDE Quarterly Review
Executive summary
Economic conditions
The EU's economy continued its expansion at a robust and higher than expected pace.
In the third vs. the second quarter of 2017 real GDP increased by 0.7 % both in the EU and the
euro area, matching the pace of the previous quarter. Year-on-year growth improved further to
2.8 % in both areas. Most Member States reported an increasing output. Quarterly GDP
growth broadly ranged from 0.1 % in Lithuania to 2.6 % in Romania, with Denmark (-0.5 %)
and Ireland (4.2 %) being the bottom and top outliers respectively. Year-on-year growth was
positive in all Member States, accelerating to 7 % in Malta, Romania and Ireland.
Employment
Employment in the EU continued its expansion surpassing expectations. It increased by
0.3 % in the EU and 0.4 % in the euro area in the third vs. the second quarter of 2017.
Compared to the third quarter of 2016, employment gained 1.7 % in both the EU and the euro
area, which amounts to an additional 4 million and 2.7 million people employed, respectively.
This evolution shows acceleration in employment growth despite earlier projections announcing
a slowdown in 2017.
The number of employed reached 236.3 million in the EU and 156.3 million in the euro
area, the highest levels ever recorded. Employment has now been growing for four and a half
years in a row. Since its lowest level in mid-2013, it has increased by 12 million people in the
EU, of which 7.4 million in the euro area.
Employment expanded in most Member States. In the third quarter of 2017, it grew
notably in Croatia (1.4 %) and Estonia (1.1 %), with only Lithuania recording a decrease in
employment (0.5 %). On a yearly basis, Lithuania was again the only Member State with a
negative evolution, while the increase in Romania's employment was strong (5.2 %) in the year
to third quarter of 2017.
Service sectors continued to drive employment growth in the EU, while improvements
were smaller in industry and construction. Nearly all service sectors contributed to the
employment increase seen in the third quarter of 2017, especially the scientific and technical
sector. Over the year to the third quarter of 2017, employment increased in all sectors except
for the financial sector, which recorded a slight decrease.
Permanent jobs and full-time employment were the main contributors to employment
expansion. In the year to the third quarter of 2017, the number of employees with permanent
contracts grew by 1.7 %, confirming the trend of rising confidence, bolstering the demand for
labour. This represents an increase of 2.8 million employees, which is three times more than the
increase in temporary contracts (900.000, 3.2 % yearly growth). Full-time workers saw their
numbers increase by about 3 million, up to 181 million, and part-time workers increased by
about 300.000 up to 42.7 million. It is worth to notice that part-time employment has never
contracted since 2008, and now stands at nearly 5 million jobs above its 2008 level. However,
full time employment still underperforms its pre-crisis, 2008 level by 1.5 million.
The EU employment rate has increased consistently over the past three years. In the
third quarter of 2017, the employment rate of 20-64 years old stood at 72.3 %, the highest
ever reached, but still 2.7 pps below the Europe 2020 target of 75 %. Nonetheless, large
disparities in employment rates remain among Member States. They ranged from 58 %
in Greece to 82 % in Sweden. In around half of the Member States, employment rates are still
lower than in 2008.
Unemployment
The unemployment rates in the EU and euro area are approaching their pre-crisis
values at a steady pace. In December 2017, they stood at 7.3 % in the EU and to 8.7 % in
the euro area, a yearly reduction of 0.9 pps and 1 pp respectively. The unemployment rate for
the whole 2017 averaged to 7.7 % for the EU, 0.9 pps less than in 2016, and 9.1 for the euro
area, 0.9 pps less than in 2016. This has been the fourth consecutive year with reductions in
the unemployment rate, and 2017 registered the highest annual decrease since the start of the
recovery.
February 2018 I 6Employment, Social Affairs & Inclusion
ESDE Quarterly Review
Unemployment was below 18 million, the lowest level since November 2008, including
14.2 million in the euro area. The reduction in unemployment between December 2016 and
December 2017 represented about 2 million fewer unemployed in the EU, including 1.5 million
in the euro area. Unemployment has receded by around 8.6 million people since its
peak recorded in April 2013. There were still around 1.9 million more unemployed in
December 2017 than in March 2008, when unemployment was at its lowest.
Unemployment rates decreased in all Member States in the year to December 2017.
The largest reductions were registered in Greece (by 2.7 pps down to 20.7 % in October 2017)
and Portugal (by 2.4 pps down to 7.8 %). Large differences remain among Member States: the
Czech Republic (2.3 %) and Germany (3.6 %) display very low rates, while Greece2 (20.7 %)
and Spain (16.4 %) continue to register high rates despite the strong decreasing trend.
In the year to December 2017, the unemployment rate in the EU declined for both
men and women. It did so by 0.9 pps for both, men and women, reaching 7.1 % and 7.5 %
respectively. In the euro area, the unemployment rate receded by 0.9 pps to 8.4 % for men and
1 pp to 9 % for women.
In the same period, the youth unemployment rate (those aged 15-24) continued to
decrease steadily in the EU and in the euro area. The rate declined in the EU by 1.9 pps to
16.1 % and by 2.4 pps to 17.9 % in the euro area. The youth unemployment rate decreased in
all Member States except in the United Kingdom where it remained stable 3. It fell strongly in
Italy (6.9 pps) and Croatia (5.9 pps). Greece was still the country with the highest youth
unemployment rate in the EU (40.8 %)4.
The long-term unemployment rate decreased at a steady pace. It declined by 0.5 pps in
the year to the third quarter of 2017. However, the share of long-term unemployment in total
unemployment remained high at around 45 %. The reduction was significant among those in
very long-term unemployment (those unemployed for at least two consecutive years), lowering
their rate by 0.4 pps. In almost all Member States long-term unemployment is declining.
However, Greece (15.3 %) and Spain (7.1 %) still register high long-term unemployment rates.
The activity rate continued growing steadily. In the year to the third quarter of 2017, most
of the Member States exhibited increased activity rates. Some Member States had experienced
strong annual increases, like Bulgaria (3.5 pps) and Slovenia (3.3 pps), while Ireland and
Denmark showed relevant decreases since 2008.
In the majority of countries, the underutilisation of labour force (including 'underemployment' or
the 'available but not seeking'), were declining consistently with the evolution in unemployment.
This evolution was moderate in most of the countries but constant since the start of the
recovery. Nevertheless, there were countries with high rates of people available to work but not
seeking, as Italy (11.4 %), or underemployed as in Cyprus (6.7 %)
Productivity
Labour productivity in the EU improved. Productivity growth year-on-year improved to
0.8 % both in the EU and in the euro area in the third quarter of 2017, after a weak previous
quarter. Growth in labour productivity differed across Member States, but generally remained
modest. Latvia, Lithuania, Poland and Romania recorded by far the strongest increase in labour
productivity (3 % or more year-on-year).
Labour costs
Compensation per employee and unit labour cost grew in the EU and most Member
States. The EU saw a more notable year-on-year growth in compensation per employee
(1.2 %) in the third quarter of 2017. Consequently, nominal unit labour cost (which measures
cost-push inflationary pressures) increased by 0.4 %. In the euro area, the growth in
2
Data from October 2017
3
Data from October 2017
4
Data from October 2017
February 2018 I 7Employment, Social Affairs & Inclusion
ESDE Quarterly Review
compensation per employee remained at a solid 1.7 %, but due to a pick-up in productivity, the
unit labour cost returned to 0.9 % yearly growth, down from 1.4 % in the previous quarter.
Bulgaria, Lithuania and Romania showed the strongest increases in the unit labour cost.
Real unit labour cost growth (RULC), which reflects the change in the labour income
share, changed slightly in the EU. The real unit labour cost decreased by 0.1 % in the EU
and by 0.3 % in the euro area in a year to the third quarter of 2017. Bulgaria and Romania saw
the strongest increases in RULC, as real compensation per employee rose sharply overtaking
productivity growth. On the contrary, in Estonia and Latvia, real unit labour cost decreased, as
faster productivity growth offset a strong increase in real compensation per employee.
Household situation
The financial situation of EU households continued to improve, mainly driven by an
increase in income from work. The growth in real gross disposable household income (GDHI)
in the EU continued, but moderated to around 1.5 % year-on-year. It continued to result from
an increase in income from work, while the prior increase in social benefits came to a halt.
Nearly all Member States continued to see growth in household income in the year to the first
half of 2017, except Austria, Greece, Spain and the UK.
Fewer EU households needed to draw on savings or run into debt to cover current
expenditures (financial distress), also among low-income households. Financial
distress, as observed by mid-2017, affected around 14 % of the population. It was down from a
peak of nearly 17 % at the end of 2013. Among people living in the poorest households (lowest
quartile), 23 % are in financial distress, down from the peak of 28 % at the end of 2013; 9 %
run into debt and a further 14 % draw on savings to cover current expenditure.
Labour demand
Labour demand and labour shortages continued to increase. The overall job vacancy rate
in the EU has reached 2 % in the third quarter of 2017 and it was 0.3 pp above the rate a year
before. The job vacancy rate was higher in services than in industry and construction. Labour
shortages increased, and hiring activity recovered (up 3.7 % in a year to the second quarter of
2017). The separation rates declined well below pre-crisis levels, while the job finding rate has
accelerated its recovery over the last quarters and approached its pre-crisis rate.
Outlook
Survey data and economic forecasts suggest a positive economic and labour market
outlook, with unemployment approaching its lowest level (2008). The euro area
economy gained momentum and solid job creation should have continued in the fourth quarter
of 2017, according to the Purchasing Managers Index. The economic sentiment and employment
expectations have headed up since mid-2016, and unemployment expectations are very low.
The latest Commission Winter Forecast of February 2018 confirmed that growth beat
expectations last year, as the transition from economic recovery to expansion continues and the
solid performance will last in 2018-2019.
February 2018 I 8Employment, Social Affairs & Inclusion
ESDE Quarterly Review
Latest labour market and social trends in the EU28 and euro area (in red)
2016Q2 2016Q3 2016Q4 2017Q1 2017Q2 2017Q3
EU EA EU EA EU EA EU EA EU EA EU EA
Real GDP
% change on previous quarter (SA) 0.4 0.4 0.4 0.4 0.7 0.7 0.6 0.6 0.7 0.7 0.7 0.7
% change on previous year (SA) 1.9 1.8 1.9 1.7 2.0 1.9 2.2 2.1 2.5 2.4 2.8 2.8
Employment growth
% change on previous quarter (SA) 0.3 0.4 0.2 0.3 0.4 0.4 0.5 0.5 0.5 0.4 0.3 0.4
% change on previous year 1.4 1.4 1.1 1.3 1.1 1.3 1.5 1.6 1.7 1.6 1.8 1.7
Employment rate (15-64)
% of working-age population 66.6 65.5 67.2 66.0 67.0 65.9 66.8 65.5 67.8 66.4 68.2 66.9
change on previous year (percentage point) 1.1 1.0 1.0 1.0 0.9 1.0 1.0 0.8 1.2 0.9 1.0 0.9
Employment rate (20-64)
% of working-age population 71.1 70.0 71.5 70.4 71.4 70.3 71.2 70.0 72.3 71.0 72.7 71.4
change on previous year (percentage point) 1.1 1.0 0.9 1.0 0.9 0.9 1.0 0.8 1.2 1.0 1.2 1.0
Gross disposable households income
% change on previous year 2.7 2.4 1.7 1.4 1.8 1.4 0.8 1.6 : 1.3 : 1.7
Labour productivity
% change on previous year 1.1 1.0 0.5 0.3 0.8 0.2 1.1 1.1 0.4 0.2 0.8 0.8
Nominal unit labour cost
% change on previous year -1.2 0.1 -1.7 1.0 -1.9 1.1 -1.1 0.5 0.0 1.4 0.4 0.9
Long-term unemployment rate
% labour force 4.0 5.0 3.8 4.8 3.8 4.8 3.7 4.7 3.4 4.4 3.3 4.2
change on previous year (percentage point) -0.6 -0.7 -0.5 -0.4 -0.5 -0.6 -0.5 -0.5 -0.6 -0.6 -0.5 -0.6
2016 Oct 2016 Nov 2016 Dec 2017 Oct 2017 Nov 2017 Dec
EU EA EU EA EU EA EU EA EU EA EU EA
Unemployment rate
Total (% of labour force) 8.3 9.8 8.3 9.8 8.2 9.7 7.4 8.8 7.3 8.8 7.3 8.7
Men 8.2 9.5 8.1 9.5 8.0 9.3 7.2 8.5 7.1 8.4 7.1 8.4
Women 8.5 10.1 8.4 10.1 8.4 10.1 7.7 9.2 7.6 9.2 7.5 9.0
Youth (% of labour force 15-24) 18.1 20.3 18.2 20.6 18.0 20.3 16.4 18.4 16.2 18.1 16.1 18.0
Source: Eurostat, National Accounts, Labour Force Statistics and series on unemployment.
Note: Data not seasonally adjusted (except where indicated SA). ':' not available. GDHI: EA18 instead
EU19, DG EMPL calculations.
Click here to download table.
Regularly updated underlying data, charts and tables are available online as a file in Excel format. Data are
refreshed shortly after their release by Eurostat - for instance unemployment is updated at the beginning of
each month, figures based on National Accounts (NA) are updated in the beginning and mid- March, June,
September and December, figures based on the Labour Force Survey (LFS) are updated in mid- April, July,
October and January. Latest available data are accessible at:
http://ec.europa.eu/employment_social/employment_analysis/quarterly/quaterly_updated_charts.xlsx
February 2018 I 9Employment, Social Affairs & Inclusion
ESDE Quarterly Review
List of charts and tables
Table 1: Recent forecasts – EU and euro area ...................................................................... 16
Table 2: Youth unemployment rates - February 2016 ........................................................... 27
Chart 1: Real GDP growth - EU, euro area and US ................................................................ 11
Chart 2: Real GDP growth - EU, euro area and Member States .............................................. 12
Chart 3: Real GDP, GDHI and employment growth – EU........................................................ 12
Chart 4: Unemployment rate - EU, euro area and US............................................................ 13
Chart 5: Activity rate - EU, euro area and US ...................................................................... 14
Chart 6: Unemployment rate versus unemployment expectations - EU ................................... 15
Chart 7: Employment expectations by sectors – EU .............................................................. 15
Chart 8: Employment level - EU and euro area .................................................................... 17
Chart 9: Employment growth - EU, euro area and Member States .......................................... 18
Chart 10: Employment growth by sector - EU ..................................................................... 19
Chart 11: Employment growth by sector - EU ..................................................................... 19
Chart 12: Change in permanent and temporary employment and self-employment - EU .......... 20
Chart 13: Change in part-time and full-time employment - EU .............................................. 20
Chart 14: Employment rate - EU, euro area and Member States ................................................ 21
Chart 15: Change in employment rate - EU, euro area and Member States ............................ 22
Chart 16: Employment rate by population groups – EU ........................................................ 23
Chart 17: Unemployment rate and youth unemployment rate - EU and euro area ................... 24
Chart 18: Unemployment rates - EU, euro area and Member States ...................................... 25
Chart 19: Unemployment rates - EU, euro area and Member States ...................................... 25
Chart 20: Change in unemployment rate by population groups - EU ...................................... 26
Chart 21: Youth unemployment rates - EU, euro area and Member States, August 2016 and
highest and lowest rate since 2008......................................................................................... 28
Chart 22: Unemployment and long-term unemployment rates and share - EU ........................ 29
Chart 23: Unemployment level by duration of unemployment – EU ....................................... 30
Chart 24: Long-term unemployment rate - EU, euro area and Member States, level and change
over the year to 2016Q3 ....................................................................................................... 31
Chart 25: Activity rate - EU and Member States .................................................................. 32
Chart 26: Activity rate by by population groups – EU ........................................................... 33
Chart 27: Unemployment, potential labour force and underemployment - EU ......................... 33
Chart 28: Unemployment vs. supplementary indicators to unemployment (SIU) - EU Member
States, changes 2016Q1-2017Q1 ........................................................................................... 35
Chart 29: Labour underutilisation - EU and Member States, 2017Q1 ...................................... 35
Chart 30: Real GDP growth, real GDHI growth and its main components – EU ........................ 37
Chart 31: Reported financial distress by income quartile - EU ............................................... 38
Chart 32: Reported financial distress in lowest income quartile - Member States ..................... 39
Chart 33: Real labour productivity growth - EU, euro area, US and JP .................................... 40
Chart 34: Employment, GDP and labour productivity growth - EU, euro area and Member States
41
Chart 35: Productivity growth per person and per hour - EU, euro area and Member States ..... 41
Chart 36: Growth in nominal unit labour cost and its components – EU, euro area and Member
States 42
Chart 37: Growth in real unit labour cost - EU and Member States ........................................ 43
Chart 38: Industry – growth in nominal unit labour cost and its components – EU, euro area and
Member States .................................................................................................................... 44
Chart 39: Wholesale and retail trade, transport, accommodation and food service activities -
Nominal unit labour cost and its components – EU, euro area and Member States ........................ 44
Chart 42: Job vacancy rates - EU, euro area and Member States .......................................... 45
Chart 43: Beveridge curve 2008-2017 - EU ........................................................................ 46
Chart 44: Changes in employees in new jobs by sector - EU ................................................. 46
Chart 45: Unemployment, finding and separation rates - EU and euro area ............................ 47
February 2018 I 10Employment, Social Affairs & Inclusion
ESDE Quarterly Review
1. Macroeconomic and employment developments and
outlook
The EU economy continues its expansion at robust pace
Real GDP increased by 0.7 % both in the EU and in the euro area in the third quarter of 2017, which
matched the pace of the previous quarter. Private consumption and investment were the main
drivers of this output growth in both areas, while contribution of external balance was neutral for the
EU and slightly positive for the euro area. Year-on-year growth improved further to 2.8 % both in
the EU and in the euro area. The US economy continued expansion at a similar pace, with real GDP
increasing by 0.8 % in the third quarter, bringing year-on-year growth to 2.3 %.
The real GDP in the EU and the euro area started to exceed its previous peak in 2014, and is now
8.3 % and 6.1 %, respectively, above 2008 levels. In comparison, as the US economy began to
recover faster, its real GDP level is now 15.5 % higher than in 2008 (Chart 1).
Chart 1: Real GDP growth - EU, euro area and US
Source: Eurostat, National Accounts, data seasonally adjusted [naidq_10_gdp]
Click here to download chart.
Member States report increases in economic output
The economy continued to expand in all Member States, but Denmark in the third quarter of 2017.
The dispersion of GDP growth in the EU widened, as Denmark lost 0.5 % (driven by cuts in private
consumption), while Ireland gained a substantial 4.2 % (with a notably improved external balance).
Apart from those two outliers, quarterly GDP growth ranged from 0.1 % in Lithuania to 2.6 % in
Romania. Year-on-year growth was positive in all Member States, exceeding 7 % in Malta, Romania
and Ireland (Chart 2).
February 2018 I 11Employment, Social Affairs & Inclusion
ESDE Quarterly Review
Chart 2: Real GDP growth - EU, euro area and Member States
Source: Eurostat, National Accounts, data seasonally adjusted [namq_10_gdp]
Click here to download chart.
Employment and household incomes respond promptly to economic growth
Employment increased by 0.3 % in the EU and 0.4 % in the euro area in the third quarter of 2017,
which marked a slowdown by 0.1 percentage point from the previous quarter. In the year to the
third quarter of 2017 employment recorded a 1.8 % increase in the EU and 1.7 % in the euro area.
Accompanying the economic and labour market recovery, gross disposable household income (GDHI)
in the EU5 and euro area registered a further year-on-year increase in real terms (1.6 % for the euro
area in the third quarter of 2017) (Chart 3).
Chart 3: Real GDP, GDHI and employment growth – EU and euro area
Source: Eurostat, National Accounts, data not seasonally adjusted [namq_10_gdp, namq_10_pe, nasq_10_nf_tr]
(DG EMPL calculations for GDHI)
Note: GDHI EU aggregate for Member States for which data are available, GDP for EU28
Click here to download chart.
Unemployment continues to recede
In December 2017, the EU and euro area unemployment rates were 7.3 % and 8.7 %, down from
8.2 % and 9.7 % in December 2016. By comparison, the unemployment rate in the US was 4.1 % in
December 2017, down from 4.7 % in December 2016.
5
The real GDHI growth for the EU is an estimation by DG EMPL, and it includes Member States for which quarterly data are
available (19 Member States: AT, BE, CZ, DE, DK, EL, ES, FI, FR, HR, IE, IT, NL, PL, PT, RO, SE, SI, UK, which account for at
least 90 % of EU GDHI). The nominal GDHI is converted into real GDHI by deflating with the deflator (price index) of household
final consumption expenditure. The real GDHI growth for the EU is a weighted average of real GDHI growth in Member States.
February 2018 I 12Employment, Social Affairs & Inclusion
ESDE Quarterly Review
In the EU and euro area, unemployment has declined gradually from its 2013 peak, and has only
now approached the end-2008 levels. By contrast, unemployment in the US declined much faster
initially while the pace of declines has slowed down recently, and the unemployment has returned to
2008 level already last spring (Chart 4).
Chart 4: Unemployment rate - EU, euro area and US
Source: Eurostat, series on unemployment, data seasonally adjusted [une_rt_m]
Click here to download chart.
Labour market participation heads up
The faster decline in the unemployment rate in the US compared to the EU can be partially linked to
trends in labour market participation (those in employment and in unemployment are considered to
participate in the labour market). The sharp decrease in unemployment in the US was accompanied
at the beginning by an important decline in labour market participation, which was especially sharp
in 2008-2011. Consequently, the large gap between the US and the EU in the activity rate observed
before 2008 has disappeared by 2015-2016 (Chart 5).
February 2018 I 13Employment, Social Affairs & Inclusion
ESDE Quarterly Review
Chart 5: Activity rate - EU, euro area and US
Source: Eurostat, LFS [lfsi_act_q], and US Bureau of Labour Statistics, LFS from Current Population Survey
(CPS), data seasonally adjusted
Note: Working age population 15-64 for EU, euro area and 16-64 for US.
Click here to download chart.
Outlook
The euro area economy expands and job creation accelerates in the second half of 2017
The Purchasing Managers Index (PMI)6 for the euro area, derived as a composite index for euro area
output, has reached the highest level since early-2011. The PMI suggested that growth in euro area
gathered a further momentum in the fourth quarter (0.8 %), driven by a notable expansion in
manufacturing and an even steeper increase in the service sector activity. The PMI also suggested
that employment increased in the fourth quarter at the highest rate observed during the past 17
years, with hiring remaining firm in services and at a record high in manufacturing.
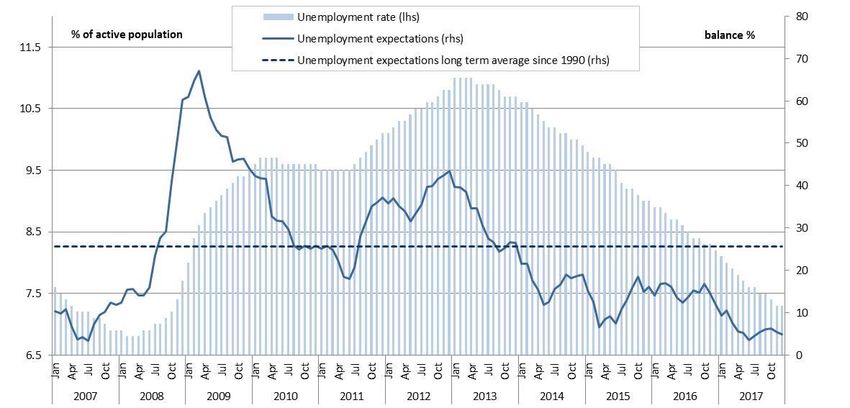
Economic sentiment and employment prospects improve
The Commission's economic sentiment indicator (ESI), derived from the EU Business and Consumer
Surveys, has been heading up since mid-2016. Confidence has consistently grown in construction
where it reached a positive balance, and it has notably improved since mid-2016 in industry. After
some stagnation, confidence improved in late 2017 in services (remaining the highest among all
sectors) and in retail. On the household side, expectations about unemployment for the next 12
months are at the level of mid-2007 (Chart 6). Underlying the improvements in confidence,
employment prospects over the next few months showed signs of improvement in all sectors, except
for retail (Chart 7).
6
The Eurozone Manufacturing Purchasing Managers’ Index (PMI) is a weighted indicator calculated from indices of output, new
orders, employment, suppliers’ delivery times and stocks of purchases.
February 2018 I 14Employment, Social Affairs & Inclusion
ESDE Quarterly Review
Chart 6: Unemployment rate versus unemployment expectations - EU
Source: European Commission, Business and Consumer Surveys and Eurostat, LFS, data seasonally adjusted
[ei_bsco_m, une_rt_m]
Click here to download chart.
Chart 7: Employment expectations by sectors – EU
Source: European Commission, Business and Consumer Surveys [ei_bsrt_m_r2, ei_bsse_m_r2, ei_bsin_m_r2,
ei_bsbu_m_r2], data seasonally adjusted, moving averages
Click here to download chart.
Medium-term outlook for growth and jobs in the EU remains positive
The latest Commission Winter Interim Forecast of February 2018 confirmed the November forecast
that EU economic growth beat expectations in 2017 and the solid growth will continue. The transition
from economic recovery to expansion continues, as recent labour market gains are robust, private
consumption is rising and investment is picking up Labour market conditions are set to benefit from
the domestic-demand driven expansion, moderate wage growth, and structural reforms
implemented in some Member States.
February 2018 I 15Employment, Social Affairs & Inclusion
ESDE Quarterly Review
The Commission upgraded the forecast of GDP growth in the EU to 2.4 % in 2017, 2.3 % in 2018
and 2.0 % in 2019. Regarding the labour market, in November the Commission expected
employment to moderate its growth to 1.4 % in 2017, 1.0 % in 2018 and 0.8 % in 2019, as
temporary fiscal incentives fade in some countries and skill shortages emerged in others.
Unemployment was predicted to fall to 7.8 % in 2017, 7.3 % in 2018 and 7.0 % in 2019. The
forecasted unemployment rate seems quite conservative as in December 2017 unemployment rate
has already decreased to 7.3 %, bringing the average EU unemployment rate for 2017 down to
7.7 %. Forecasts from OECD, IMF and ECB confirms a similar outlook for the euro area (Table 1).
Table 1: Recent forecasts – EU and euro area
GDP growth Unemployment rate Employment growth
2017 2018 2019 2017 2018 2019 2017 2018 2019
euro area
C ommission Nov-17 2.2 2.1 1.9 9.1 8.5 7.9 1.5 1.2 1.0
Feb-18 2.4 2.3 2.0 : : : : : :
OEC D Nov-17 2.4 2.1 1.9 9.1 8.5 8.0 1.4 1.3 1.1
EC B Dec-17 2.4 2.3 1.9 9.1 8.4 7.8 1.7 1.3 1.0
IMF Oct-17 2.1 1.9 1.7 9.2 8.7 8.3 : : :
EU
C ommission Nov-17 2.3 2.1 1.9 7.8 7.3 7.0 1.4 1.0 0.8
Feb-18 2.4 2.3 2.0 : : : : : :
IMF Oct-17 2.3 2.1 1.8 : : : : : :
Source: European Commission November 2017 and February 2018, OECD November 2017, ECB December 2017,
IMF October 2017.
Note: ':' information not available.
Click here to download table.
2. Employment in the EU and in Member States
Employment in the EU continues its expansion surpassing forecasts
Employment continued its increase in the third quarter of 2017: by 0.3 % in the EU and 0.4 % in the
euro area. It was up by 1.7 % in both, EU and the euro area compared to the third quarter of 2016.
The year-on-year increase represents 4 million more employed people in the EU, including 2.7
million in the euro area (Chart 3). The forecasts for 2017 were pointing to a slowdown in the
employment growth. However, after three quarters the pace has accelerated.
Employment has already been growing for four and a half consecutive years in the EU. The lowest
level since 2008 was recorded at the beginning of 2013. Since then, and up to the third quarter of
2017, employment has increased by more than 12 million (including 7.4 million in the euro area).
Consequently, in the third quarter of 2017, employment in the EU reached a new record level with
more than 236 million people in employment, 156 of those in the euro area (Chart 8).
February 2018 I 16Employment, Social Affairs & Inclusion
ESDE Quarterly Review
Chart 8: Employment level - EU and euro area
Source: Eurostat, National Accounts, data seasonally adjusted [namq_10_pe]
Click here to download chart.
Employment expands in most Member States
In the third quarter of 2017, employment continued to increase in almost all Member States.
Lithuania registered a decrease in employment of 0.5 % this quarter, while Romania and the United
Kingdom were stable. Employment grew significantly in Croatia (1.4 %) and Estonia (1.1 %)7, see
Chart 9.
Employment in the third quarter of 2017 was higher than in the third quarter of 2016 in all Member
States except Lithuania. That growth was especially strong in Romania (5.2 %) and Cyprus (3.4 %).
7
Last data available for IE, from the second quarter of 2017 showed growth at 1.1 % on a quarterly basis
February 2018 I 17Employment, Social Affairs & Inclusion
ESDE Quarterly Review
Chart 9: Employment growth - EU, euro area and Member States
Source: Eurostat, National Accounts, data seasonally adjusted (q-o-q) and not seasonally adjusted (y-o-y)
[namq_10_pe]
Note: IE data from 2017Q2
Click here to download chart.
Service sectors drive employment growth
In the year to the third quarter of 2017, EU employment increased in all sectors, namely in the
service sectors and to a smaller extent in industry and construction. Employment in non-tradable8
services has increased, even during the crisis, except for the stagnation observed in 2009. Tradable
services have started to support job creation since the beginning of 2014. Employment in industry
has regained some ground from the second half of 2014, while employment in construction has
slightly increased since the beginning of 2015. Employment in agriculture that has been falling since
2008 increased slightly over the last two quarters (Chart 10 and Chart 11).
Looking at the third quarter of 2017 alone, employment increased in nearly all service sectors,
especially the scientific and technical sector, while it declined in agriculture (Chart 11). The
Statistical Annex presents in detail the changes in employment for 10 NACE branches.
8
Tradable sectors include: Agriculture (A), Industry (B-E) - Mining and quarrying (B), Manufacturing (C), Electricity, gas, steam
and air conditioning supply (D), Water supply, sewerage, waste management and remediation activities (E) and tradable services
- Wholesale and retail trade (G), Transport (H), Accommodation and food service activities (I). Non-tradable sectors include:
Construction (F) and other non-tradable services - Information and communication (J), Financial and insurance activities (K), Real
estate activities (L), Professional, scientific and technical activities (M), Administrative and support service activities (N), Public
administration and defence (O), Education (P), Human health and social work activities (Q), Arts, entertainment and recreation
(R), Other service activities (S), Activities of household (R), Activities of extra-territorial organizations and bodies (U).
February 2018 I 18Employment, Social Affairs & Inclusion
ESDE Quarterly Review
Chart 10: Employment growth by sector - EU
Source: Eurostat, National Accounts, data not seasonally adjusted [namq_10_a10_e]
Note: Figures in the legend in brackets indicate the share of sector's employment.
Click here to download chart.
Chart 11: Employment growth by sector - EU
Source: Eurostat, National Accounts, data seasonally adjusted (q-o-q) and not seasonally adjusted (y-o-y)
[namq_nace10_e]
Top chart: Employment growth (%). Bottom chart: Employment level (million).
Click here to download chart.
Permanent jobs contribute notably to employment expansion
In the year to the third quarter of 2017, the increase in the number of permanent employees was
strong, 2.8 million (a 1.7 % increase). This has been the greater expansion since the start of the
recovery at the end of 2013. The growth of temporary employees was even stronger, an increase of
900.000 (3.2 % more). By contrast, the number of self-employed fell significantly by almost
400.000 (Chart 12). Self-employment has been decreasing during the crisis and the recovery, except
by small punctual improvements. There are 2.7 million fewer self-employed than in the third quarter
of 2008.
February 2018 I 19Employment, Social Affairs & Inclusion
ESDE Quarterly Review
Chart 12: Change in permanent and temporary employment and self-employment - EU
Source: Eurostat, LFS, data not seasonally adjusted [lfsq_egaps, lfsq_etgaed]
Click here to download chart.
Full-time employment continues to drive employment growth but is still below 2008 level
In the year to the third quarter of 2017, full-time employment grew faster than part-time
employment. In the year to the third quarter of 2017, the number of full-time workers increased by
3 million (1.7 % more), while the number of part-time workers increased by 300 thousands (0.1 %).
There are now around 181 million employed full-time, 1.6 million fewer than in the third quarter of
2008. Part-time employment was 12 % higher than in 2008, 4.6 million more employed)
(Chart 13).
Chart 13: Change in part-time and full-time employment - EU
Source: Eurostat, LFS, data not seasonally adjusted [lfsq_eftpt]
Click here to download chart.
Employment rates in the EU and in Member States
Employment rate continues its rise and the Europe2020 target may be within reach
The employment rate for 20-64 year-olds has increased consistently for the last four years. At
72.3 % in the third quarter of 2017, it exceeded by 2 pps the 2008 rate and by 4 pps its low in
2013. The rate increased by 1.1 pps in the year to the first quarter of 2017. At this pace the Europe
February 2018 I 20Employment, Social Affairs & Inclusion
ESDE Quarterly Review
2020 target of 75 % may be reached. For the euro area, the employment rate increased by 0.9 pps
in the year to the third quarter of 2017, to reach 71 %, 0.7 pps above the rate in 2008 (Chart 15,
and Chart 14 ).
Chart 14: Employment rate - EU, euro area and Member States
Source: Eurostat, LFS, data seasonally adjusted [lfsi_emp_q]
Click here to download chart.
Employment rates increase in most Member States, but half are below their 2008 rates
In the year to the third quarter of 2017, the employment rate for 20-64 year-olds increased in all
Member States, except in Denmark, which recorded a minor decrease, 0.1 pps. The largest annual
increases were recorded in Bulgaria (4.3 pps) and Slovenia (3.6 pps), see Chart 15.
The effects of the recovery start to be visible in the majority of Member States. In the third quarter
of 2017, only eight Member States had lower employment rates than in 2008. Compared with 2008,
rates are significantly below in Greece (8.1) and Cyprus (4.9 pps) and (by 6 pps or more), while
Hungary and Malta showed the greatest increases, of around 12 pps.
In the third quarter of 2017, there was about 25 pps difference between the highest employment
rate, almost 82 % in Sweden, and the lowest, 58 % in Greece.
February 2018 I 21Employment, Social Affairs & Inclusion
ESDE Quarterly Review
Chart 15: Change in employment rate - EU, euro area and Member States
Source: Eurostat, LFS, data seasonally adjusted [lfsi_emp_q]
Click here to download chart.
Employment rates improve across all population groups and particularly for older workers
In the year to the third quarter of 2017, the EU employment rate increased for all population groups
and most noticeably for people aged 60-64 (2.3 pps) and those aged 20-24 (1.7 pps). This evolution
reinforces the trend observed over the past few years where older workers, especially those above
60 years have increased their attachment to work. For the youth the evolution among those above
and below 20 years is different but in both cases below their 2008 rates.
The increase in the employment rate in the year to the third quarter of 2017 was similar for both
men and women, 1.1 pps. When compared to 2008, the employment rate in the third quarter of
2017 is significantly higher for women (by 3.6 pps), while men have finally reached the 2008 rate)
(Chart 16).
The employment rate increased for all education levels, especially among those low-skilled, 1.4 pps.
However, the low-skilled is the only group still below its 2008 rate.
February 2018 I 22Employment, Social Affairs & Inclusion
ESDE Quarterly Review
Chart 16: Employment rate by population groups – EU
Source: Eurostat, LFS, data non-seasonally adjusted [lfsq_ergaed]
Top chart: Employment rate (% of respective population). Bottom chart: Change in employment rate (pp).
Click here to download chart.
3. Unemployment in the EU and in Member States
The decrease in unemployment remains stable
In December 2017, the unemployment rate in the EU and euro area continued the decline started in
mid-2013. It dropped to 7.3 % in the EU and to 8.7 % in the euro area. These changes represent a
reduction of 0.9 pp and 1 pps respectively when compared to December 2016. The unemployment
rate in the EU is approaching its low of 6.8 % registered in April 2008 (Chart 17). Nevertheless, this
is the lowest rate recorded in the EU since October 2008. Four and a half years after the start of the
recovery, the unemployment is still decreasing at a relevant pace. Forecasts for 2017 were
announcing a slowdown in the reduction pace that has not occurred. The 2017 annual rate decreased
to 7.7 %, an annual decrease of 0.9 pps, the faster since the start of the recovery. The latest
Commission's forecast9 projects an unemployment rate of 7.3 % for 2018, a rate already reached in
the last two months of 2017.
The decline in the unemployment rate between December 2016 and December 2017 represents
about 2 million fewer unemployed people in the EU, including 1.5 million in the euro area.
Unemployment has receded by around 8.6 million people since its peak observed in April 2013.
However, with around 18 million unemployed people, including 14.2 million in the euro area, there
were still 2.1 million more unemployed people in December 2017 than in March 2008, when
unemployment was at its lowest at 16.1 million people.
9
European Commission Forecast November 2017
February 2018 I 23Employment, Social Affairs & Inclusion
ESDE Quarterly Review
Chart 17: Unemployment rate and youth unemployment rate - EU and euro area
Source: Eurostat, series on unemployment, data seasonally adjusted [une_rt_m]
Click here to download chart.
Unemployment rate declines in most Member States …
In December 2017, compared with a year ago, unemployment rates decreased in all Member States
except Finland where it remained stable. The largest reductions were registered in Greece (by
2.7 pps down to 20.7 %)10 and Portugal (by 2.4 pps down to 7.8 %), see Chart 18 and Chart 19.
Large differences in unemployment rates remain among Member States. In December 2017, the
lowest rates were recorded in the Czech Republic (2.3 %, yearly decrease of 1.2 pps), Germany and
Malta (both at 3.6 %). By comparison, Greece11 (at 20.7 %) is the only Member State with an
unemployment rate over 20 %, followed by Spain (16.7 %), see Chart 18.
More than half of the decrease in unemployment seen in the EU was achieved thanks to the
decreases in four countries: Spain (460 ths.), Italy (270 ths.), France (200 ths.) and Poland (190
ths.).
10
Change between December 2016 and October 2017, latest data available
11
October 2017
February 2018 I 24Employment, Social Affairs & Inclusion
ESDE Quarterly Review
Chart 18: Unemployment rates - EU, euro area and Member States
Source: Eurostat, series on unemployment, data seasonally adjusted [une_rt_m]
Note: HU and EE data from November 2017, EL and UK data from October 2017
Click here to download chart.
Chart 19: Unemployment rates - EU, euro area and Member States
Source: Eurostat, series on unemployment, data seasonally adjusted [une_rt_m]
Note: HU and EE data from November 2017, EL and UK data from October 2017
Click here to download chart.
… and also continues to decline for all population groups
In the year to December 2017, the unemployment rate in the EU decreased for all age groups and
for both men and women. It fell by 0.9 pps for both men and women, down to 7.1 % and 7.5 %
respectively. In the euro area, the unemployment rate declined by 0.9 pps for men and 1 pp for
women to reach 8.4 % and 9 % respectively.
In the year to December 2017 a decline of 1.9 pps was observed for those aged 15-24, down to a
rate of 16.1 % (Chart 20). For those aged 25-74, the unemployment rate in the EU declined by
0.8 pps down to 6.4 %. The youth unemployment rate is already below its value of December 2008,
but still above the minimum reached in February 2008 (%).
February 2018 I 25Employment, Social Affairs & Inclusion
ESDE Quarterly Review
Chart 20: Change in unemployment rate by population groups - EU
Source: Eurostat, series on unemployment and LFS [une_rt_m]
Click here to download chart.
February 2018 I 26Employment, Social Affairs & Inclusion
ESDE Quarterly Review
Table 2: Youth unemployment rates - December 2017
Year-on-year
Youth
change
unemployment
(percentage
rate
points)
IT 32.2 -6.9
EE 6.8 -6.8
HR 24.5 -5.9
CY 25.0 -5.7
CZ 4.9 -5.6
ES 36.8 -5.4
PT 22.1 -4.1
EL 40.8 -3.6
LU 14.8 -3.6
RO 16.8 -3.5
BE 16.2 -3.3
LV 14.2 -2.8
SK 17.0 -2.8
DK 10.0 -2.7
BG 12.3 -2.6
EA19 17.9 -2.4
LT 13.1 -2.3
MT 10.1 -2.2
NL 8.0 -2.2
EU28 16.1 -1.9
PL 13.5 -1.8
HU 10.3 -1.5
SI 12.5 -1.5
IE 13.7 -1.5
SE 17.6 -1.4
AT 9.3 -1.2
FR 22.3 -1.1
FI 19.9 -0.4
UK 12.2 -0.4
DE 6.6 -0.2
Source: Eurostat, series on unemployment, data seasonally adjusted [une_rt_m]
Note: EE, HU from November 2017, UK and EL from October 2017 and CY, and RO from September 2017
Click here to download chart.
EU youth unemployment show declines in the EU and most Member States
In the year to December 2017, the youth unemployment rate (for those aged 15-24) for the EU
declined by 1.9 pps and reached 16.1 %. It declined in the euro area by 2.4 pps and reached
17.9 %. These declines represent nearly 500.000 fewer unemployed people aged 15-24 in the EU,
including 300.000 in the euro area. In December 2017 there were 3.7 million young people
unemployed, including nearly 2.6 million in the euro area. Compared to 2008, and despite a higher
youth unemployment rate, the level of youth unemployment is lower. This is the result of smaller
cohorts combined with lower activity rates, as education enrolment increases.
In the year to December 2017, the unemployment rate among young people aged 15-24 fell in most
Member States. It remained stable in the United Kingdom. The youth unemployment rate fell
considerably in Italy (6.9 pps) and Croatia (5.9 pps). Greece12, the country with the highest youth
unemployment rate (40.8 %), has also registered an important decline (5.8 pps). The youth
unemployment rate is also high in Spain (36.8 %) and Italy (32.2 %). By contrast, youth
12
October 2017
February 2018 I 27Employment, Social Affairs & Inclusion
ESDE Quarterly Review
unemployment rates are the lowest in the Czech Republic (4.9 %) and Germany (6.6 %)(Table 2
and Chart 21).
Chart 21: Youth unemployment rates - EU, euro area and Member States, August 2017 and
highest and lowest rate since 2008
Source: Eurostat, LFS, data seasonally adjusted [une_rt_m]
Note: EE, HU from November 2017, UK and EL from October 2017 and CY, and RO from September 2017
Click here to download chart.
4. Long-term unemployment and additional potential
labour force
Long and very long-term unemployment decrease at a steady pace
The long-term unemployment rate (those unemployed for a year or longer) decreased by 0.5 pps in
the year to the third quarter of 2017. The rate went down to 3.3 % of the labour force (Chart 22).
The long-term unemployment rate has been decreasing over the last three and a half years. The
pace of the reduction has remained rather stable in the last two years. The very long-term
unemployment rate (those unemployed for at least two years) decreased by 0.4 pps down to 2 % of
the labour force.
In the third quarter of 2017, compared to the third quarter of 2016, there were around 1.2 million
fewer people in long-term unemployment. In the EU there were around 8.2 million people in
unemployment for more than a year, including 5.1 million for more than two years. The share of
long-term unemployed in total unemployment is still high, around 44 %, but decreasing for the last
two years.
February 2018 I 28Employment, Social Affairs & Inclusion
ESDE Quarterly Review
Chart 22: Unemployment and long-term unemployment rates and share - EU
Source: Eurostat, LFS, data not seasonally adjusted [une_rt_q, une_ltu_q]
Left axis: Unemployment rates (% of labour force). Right axis: Unemployment share (% of unemployed)
Click here to download chart.
The share of long-term unemployment in total unemployment falls slowly
The year-on-year reduction in the long-term unemployment rate has been the same than the
reduction in the short-term unemployment rate (0.5 pps). The share of very long-term unemployed
has decreased over the last year (Chart 23). The chart also shows that the changes in the shares of
the different groups of unemployed have evolved slowly since the beginning of the recovery in
contrast with the fast developments seen between 2008 and 2011.
February 2018 I 29Employment, Social Affairs & Inclusion
ESDE Quarterly Review
Chart 23: Unemployment level by duration of unemployment – EU
Source: Eurostat, LFS, data not seasonally adjusted [lfsq_ugad]
Note: Data for first quarter of each year
Click here to download chart
Long-term unemployment decreases in most Member States
In the year to the third quarter of 2017, long-term unemployment declined across the majority of
Member States. Only four Member States saw their long-term unemployment rates increase slightly,
0.1 pps in all four cases. The largest reduction occurred in Spain (2 pps) and Portugal (1.9 pps), see
Chart 24.
In the third quarter of 2017, Greece held the highest rate: 15.3 % of the labour force was long-term
unemployed. Spain (7.1 %) and Italy (6.2 %) are the other two countries with the highest rates.
Greece's rate of very long-term unemployment remained the highest in the EU at 11 %, although it
decreased by 0.4 pps in the year to the third quarter of 2017. There were important annual
reductions in very long-term unemployment rates in Spain (1.5 pps) and Croatia (1.5 pp). In fact, in
Croatia, the full long-term unemployment reduction was focused on the very long-term unemployed.
In the third quarter of 2017 Greece also held the highest share of long-term unemployment, 73.4 %
of its total unemployment, followed by Slovakia 61.8 %.
Compared to 2008, already ten countries have lower long-term unemployment rates, notably
Germany (by 2.2 pps) and Hungary (by 2.1 pps).
February 2018 I 30Employment, Social Affairs & Inclusion
ESDE Quarterly Review
Chart 24: Long-term unemployment rate - EU, euro area and Member States, level and
change over the year to 2017Q3
Source: Eurostat, LFS, data not seasonally adjusted [une_ltu_q]
Click here to download chart.
The active population in the EU is above 240 million people
The activity rate in the EU, for the 15 to 64 age group, reached 73.5 % of the EU population in the
third quarter of 2017 (Chart 25). This is 0.1 pps higher than in the second quarter of 2017 and
0.5 pps more than in the first quarter of 2016. In the third quarter of 2017, the active population of
the EU between 15 and 64 years was around 240.3 million people, almost 4.3 million more than in
the third quarter of 2008.
In the year to the third quarter of 2017, most of the Member States registered an increase in their
activity rates (Chart 25). The Member States that experienced the strongest increases were Bulgaria
(3.5 pps) and Slovenia (3.3 pps). The largest decrease in activity rate took place in
Denmark (0.9 pps).
The activity rate has been growing at a constant pace during the crisis years. Only three countries
had lower activity rates in the third quarter of 2017 than in 2008: Ireland (2.5 pps), Denmark
(1.9 pps) and Croatia (0.1 pps). At the same time Malta (11.2 pps), Lithuania (6.8 pps) and the
Czech Republic (6.6 pps) have seen very important increases in their activity rate.
February 2018 I 31Employment, Social Affairs & Inclusion
ESDE Quarterly Review
Chart 25: Activity rate - EU and Member States
Source: Eurostat, LFS, data seasonally adjusted [lfsi_act_q]
Click here to download chart.
Increases in the activity rate of those 55-64 are still important but slowing down
The increase in the activity rate of older workers, those aged between 55 and 64 years, is the main
driver of the global activity rise across the EU. In the year to the third quarter of 2017 the activity
rate of older workers increased by 1.6 pps. There was a stronger increase for women than for men in
that age group, 1.8 pps for women and 1.3 pps for men. Older workers have increased their activity
rates in 12.8 pps since 2008.
During the last year, the activity rate for youths increased slightly stable but it is still 2.8 pps lower
than in the third quarter of 2008 (Chart 26). The low skilled (25-64 years) increased their
participation rate by 0.7 pps in the year to the third quarter of 2017.
The gender gap in activity rates is getting narrower slowly for the majority of demographic groups.
However it is still very high among the low skilled, almost 24 pps.
February 2018 I 32Employment, Social Affairs & Inclusion
ESDE Quarterly Review
Chart 26: Activity rate by by population groups – EU
Source: Eurostat, LFS, data seasonally adjusted [lfsq_argaed]
Click here to download chart.
The number of those 'Available to work but not seeking' and 'underemployed' in the EU
decreases
Three supplementary indicators to unemployment are used to monitor the evolution of
underemployment and the potential additional labour force. These three indicators are: 'Available for
work but not seeking', 'underemployed' and 'seeking but not available for work'. These indicators are
measured as a percentage of the labour force, i.e. the active population. They are also called
supplementary indicators to unemployment (SIU) 13.
The proportion of workers in the EU who are 'available but not seeking' (for example the
'discouraged') was 3.3 % of the labour force in the third quarter of 2017. This rate decreased by
0.3 pps compared to the third quarter of 2016. 'Underemployment', i.e. the proportion of those who
would like to work additional hours and are available to do so, decreased by 0.2 pps in the year to
the third quarter of 2017 and represented 3.6 % of the labour force.
The rate of those 'seeking but not available for work' stood at 0.9 % of the labour force over the
year to the first quarter of 2017.
The sum of the reductions in these three indicators, accounts for 0.5 % of the labour force, adds to
the positive developments in unemployment and long-term unemployment (Chart 27).
13
See:
http://epp.eurostat.ec.europa.eu/statistics_explained/index.php/Underemployment_and_potential_additional_labour_force_statis
tics
February 2018 I 33You can also read


