Determining room usage through a multi-sensor system and machine learning
←
→
Page content transcription
If your browser does not render page correctly, please read the page content below

R. Zender, U. Lucke, J. Haase, M. von der Heyde, G. Leitner und W. Meyer (Hrsg.):
                  Proceedings des Workshops "Lernen und Arbeiten im Wandel", Potsdam, 2018 59

Determining room usage through a multi-sensor system
and machine learning

Philipp Viertel1, Mattis Küper1, Joshua Wiegmann1, Matthias König1

Abstract: In this paper, we present an approach to deduce room usage through a multi-sensor
system and an analytical and machine learning component. Various sensor data from a system
called sensor cube was recorded within a building of the FH Bielefeld Campus Minden. The
sensor data, e.g. temperature, humidity, illuminance, CO2 concentration, indoor air quality, are
used to detect human activity in a room. Ideally, this unlabeled data can be processed in such a
way that, with the help of machine learning algorithms, predictions can be made on future room
usage. The analysis and predictions are based solely on environmental data, without the use of a
tracking system or any other sensor which counts or tracks human presence.
Keywords: Smart Home, Multi-Sensor Agent, Machine Learning

1        Introduction
As [MDT14] describe, 85\% of energy consumption in a building is spent on cooling,
heating, and lighting in Europe (UK). This remains a very high value, although the
development of smart home systems continues to make great progress. To further reduce
energy consumption, the utilization of machine learning techniques promises additional
value to smart home concepts, as described in [Mo14]. Such a combined system,
comprised of smart sensors and agents, as well as processing machine learning models,
can be used to learn and, therefore, predict when and how frequently rooms are used, to
make actuators in a heating, ventilation, and air conditioning (HVAC) system as energy
efficient as possible.
In addition to energy efficiency, it is also possible to increase the comfort of users in a
smart environment, e.g. in an office setting. Comfortable working areas also increase
productivity. For example, ideal working temperature is between 21 and 22°C, and
influences concentration and productivity as described in [Le06] and [Sc16]. Another
important aspect is the lighting in a room. Lighting influences productivity, employee
morale, tiredness, performance, and vitality, as seen in [Fi00]. With this in mind, the
actuators could be predictively adjusted to the personal preferences of the users, from the
previously collected data.
In order to set up such as system, it is necessary to implement a multi-sensor system, to
collect data, and feed the data to an appropriate machine learning model. Ideally, this
1
    Fachhochschule Bielefeld, Campus Minden, Artilleriestr. 9, 32427 Minden, [Firstname].[Lastname]@fh-
    bielefeld.de
60   Philipp Viertel, Mattis Küper, Joshua Wiegmann, Matthias König

model can extract information from the data to properly create a timetable, which
indicates the usage of a specific environment, predict the possible future timetable and
room usage, and also control the HVAC system accordingly.
In this paper, we present an approach for a multi-sensor system, which, in the following
sections, is referred to as sensor cube, and an analysis of the sensor data with machine
learning techniques. This paper focuses only on learning the usage of rooms in a
building, and not on the optimal control of the actuators in its system. Furthermore, we
will not include the data of the actuators (ventilation, open windows, etc.), but only the
raw data collected by the sensors.
Since the data is comprised only of raw sensor inputs, it is unlabeled and, therefore,
requires adequate treatment for use with machine learning. After the necessary
preprocessing of the data, a clustering method is applied to extract information
concerning the inner structure of the data as well as its relations. Using clustering,
synthetic labels can be produced and attached to the data. Using proper visualization
methods, the labeling process can be verified by a user to check the correct labeling via
actual room usage times and working hours. Furthermore, the features and labels can be
used to make predictions on new raw sensor data. This makes it possible to predict the
future usage of rooms according to their history, and ideally, prepare rooms in advance
in regard to e.g. lighting and heating.

2    Related Work
In [WWY12], the authors describe a smart building multi-agent system that aims to
increase the energy efficiency of a building without reducing the comfort of people
working and living in it. Case studies were held in which users of a building entered
their preferred indoor climate in a graphical user interface. The data collected from the
users was then linked to the multi-agent system to balance energy efficiency and
comfort. While [WWY12] focuses on energy efficiency without the loss of comfort, the
presented solution only factors in saving energy by predicting when a room is in use. In
the future, the sensor cube system could be extended to factor in user comfort as well.
[MCM12] describes a sensor system that predicts how many people are in a room, using
machine learning and data from different sensors. In addition, the actual number of
people is captured by a tablet application to validate the results and train the artificial
intelligence with correct data. In contrast to the solutions presented in [MCM12], the
work of this paper attempts to determine the room usage without input or interaction of
the people in the room. Only sensors from the sensor cube, which measure
environmental factors, are used.
In terms of well-being, the authors of [Sc16] have already described the theoretical
foundations for a system, that takes into account various aspects of the indoor climate
that ensures a pleasant working environment for the user. The connection between a
Determining room usage through a multi-sensor system and machine learning 61

comfortable working environment and productivity is analyzed in [Va15]. The author
collected environmental, physical, and mental data of the users and correlated it with
personal surveys on productivity.
In [JV12], the authors present a general smart building system model with an
implementation which detects a user's intention to enter a room. Most systems have a
slight delay, since the user has to have entered the room in order to activate the light e.g.
via a sensor. The anticipation is carried out using the mixed-reality space eXperience
Induction Machine (XIM), which functions as a multi-person tracking system, as well as
Linear Discriminant Analysis (LDA) to predict if the user is about to enter or not. This
linear classifier was trained with around 150 data samples, with features, such as the
angle of the user and turning magnitude. The LDA manages to remove the delay of 1
second, which occurs when running without the anticipation model. [RJD05] deployed a
multi-agent framework in a building including sensors and effectors. An unsupervised
real-time learning algorithm constructs a fuzzy rule system, based on the environmental
data. That neural networks can be utilized as well, was demonstrated as early as 1998 in
[Mo98] with a neural network handling heating and lighting among others, in a system
called ACHE.

3        Method

3.1        Description of the multi-sensor system

The sensor cube is a multi-sensor system that collects data from several sensors and
sends it over the network to a central point. The current version features eight sensors:
ambient temperature, temperature, object temperature; air pressure; illuminance, color;
dust density; humidity; CO2 concentration; indoor air quality index; (IAQ) and sound
intensity. For the implementation of the sensors and the processing of the sensor data,
building blocks of the company Tinkerforge2 were used. These building blocks are quite
small and modular, so a user can easily assemble these elements into a compact design.
The sensor cube is 10x11x11cm in dimensions and has a 3D printed case. Due to its
compact size, the sensor cube can be easily placed in various locations within a room.
The sensor cube consists of a front side, which features the energy input and a LAN
input, as shown in Figure 1a. The left side has two slots for air circulation and is used to
hold the CO2 sensor, which is shown in Figure 1b. On the right side, which can be seen
in Figure 1c, are two more slots for air circulation and an opening that is in line with the
opening of the dust sensor, that is secured on that side. The back side, which is shown in
Figure 1d, is used to secure all the other sensors, some of them are placed outside the
sensor (sound, humidity, color, temperature) and some inside (ambient temperature, air
pressure, indoor air quality). The back side also features a slot for the cables of the
2
    Tinkerforge website: https://www.tinkerforge.com/de/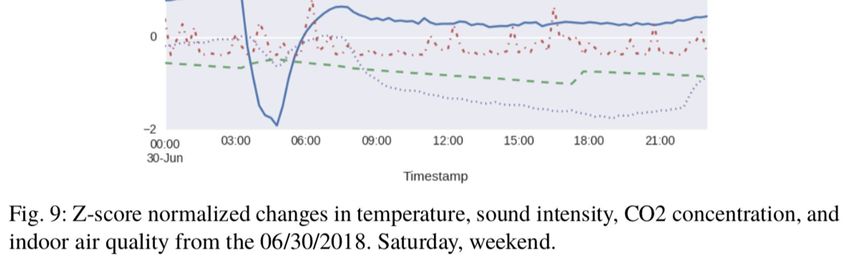
62   Philipp Viertel, Mattis Küper, Joshua Wiegmann, Matthias König

outside sensors.

Each of these sensors are mounted on the so called “bricklets.” These bricklets are
modules, that can be connected to special “master bricks,” which can communicate with
the sensor modules. The master bricks have four interfaces, where sensor modules can
be connected to. To manage multiple master bricks and all the incoming signals, a
Determining room usage through a multi-sensor system and machine learning 63

special module is needed. This so called “red brick” is a small module, that has a Linux
distribution installed on it. With the red brick, processing and communication of the
sensor data is possible. A user can upload self-written programs to the red brick that can
be used to manipulate data and send it through a network in the desired format.
The master bricks and the red brick are installed inside the case of the sensor cube. The
entire sensor cube, with all the attached sensors, is shown in Figure 2.

3.2    Data and evaluation tools

The incoming data from the single sensors is processed with the red brick. The red brick
transforms the data to a comma-separated-value (CSV) format and pushes the data in a
one-minute interval via the MQTT protocol to a server. The one-minute interval was
chosen to not flood the database with nearly identical data, but to still notice slight
differences. Shorter and longer intervals would also be possible.
The MQTT protocol is a producer/consumer architecture, in which a node in a network
can publish (or consume) data under a specific topic. These topics are similar to a
directory path and therefore are easy to remember for the user. Additionally, every node
that publishes data in a MQTT broker, can have its own topic with a specific identifier.
Wildcards for single and multiple characters are allowed as well. The MQTT
architecture allows multiple sensor cubes to remain modular, due to the fact that they can
push the data to a central point under their own topics. The server receives the incoming
messages from the sensor cube and stores them in an Apache Hadoop file system.
The Hadoop file system (HDFS) is commonly used to store big data in a network. The
Hadoop architecture is well-suited for big data applications, as it is designed to connect
to other Apache products, making it easy to further process the data. The entire data
flow, from the data collection to machine learning, is shown in Figure 3.
64 Philipp Viertel, Mattis Küper, Joshua Wiegmann, Matthias König
3.3 List of sensors and their applications
In the following section, the sensors, which are connected to the sensor cube, and their
applications are described. It is elaborated how the data can be used in order to deduce
the presence of people, but also which disruptive factors influence the sensors.
Air pressure (MS5611-01BA01)
− The air pressure changes when doors are opened
Object temperature (MLX90614ESF-BAA)
− The object temperature is needed to detect possible overheating of the
sensor cube.
Temperature (TMP102)
− The temperature can slightly change when people are in the room, due to the
release of body heat.
Illuminance/Color (TCS34725)
− The lighting conditions indirectly influence the energy costs in a room, since
one could set the actuators for the light in such a manner, that they can be
set to the minimum amount of light required to save energy.
− Furthermore, the illuminance is a good factor to recognize the usage of a
room, because people require light when working indoors.
CO2 Concentration (SensAir K30)
− The CO2 concentration increases as soon as people are present in a room
due to the release of CO2 when breathing.
− The quantitative change in the amount of CO2 in a room may also
determine how many people are in the room.
− A problem in determining the CO2 concentration in a room may be that
open windows, doors, or ventilation inadvertently affect the CO2
concentration and thus falsify the data. In order to identify these factors, the
data of the actuators would be necessary.
Indoor Air Quality Index (BME680)
− The indoor air quality index is measured from a volatile organic compounds
(VOC) sensor3. This index ranges from 0 to 500 in increments of 50,
ranging from “good” air quality to “very bad” air quality.
3
Data-sheet of the VOC sensor: https://ae-bst.resource.bosch.com/media/_tech/media/datasheets/BST-
BME680-DS001-00.pdf
Determining room usage through a multi-sensor system and machine learning 65
− This sensor can be used as a support to the CO2 sensor to detect the
presence of people in a room, since the human body derives specific gases
as described in [Ka13].
Humidity (HDC1080)
− The humidity in the room changes due to the presence of people due to
respiration and sweating.
Sound
− Through the volume in a room, it can be seen whether people are in the
room and whether it is a smaller or larger group of people.
− One problem with detecting volume is that people behave differently in the
room. Some groups of people are talking loudly, others are working quietly.
Dust density (GP2Y1010AU)
− The dust value can be used to figure out when the sensor cube needs to be
cleaned. However, it is not helpful for determining the number of people in
a room.
Through the combination of the sensor data, conclusions can be drawn on the usage of a
room and the number of people in it. This can be validated by machine learning.
3.4 Experimental setup
In order to collect data that can be analyzed via machine learning, the sensor cube was
placed on a table in an occupied room. It is a good practice to place the sensor cube far
away from doors, so disruptive factors such as incoming air does not affect the data. It is
also necessary to place the cube at a socket, since it is not battery powered.
For this purpose, a room was chosen that is used by small to large groups of people.
These groups use the space for studies and work. The dimensions of the room are 6.54 x
8.37 meters, as shown in Figure 4. If the sensor cube is placed in bigger rooms, it should
be placed in the middle of the room, otherwise changes of conditions in one area of the
room might not get measured.
Although the room has windows, these cannot be opened and remain closed. The only
air supply is through the door or the ventilation system. In general, this room is well
suited for the experimental setup, since disruptive factors, such as open windows, direct
daylight, and permanent background noise, are not present.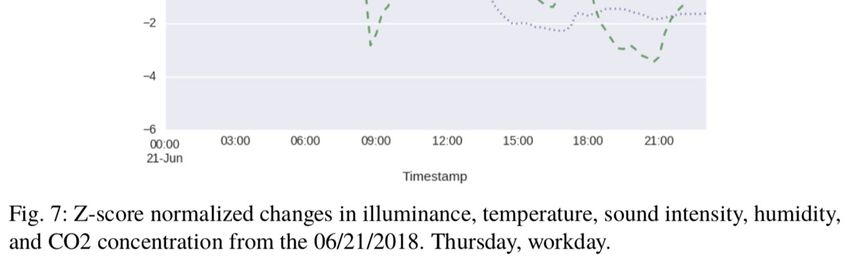
66      Philipp Viertel, Mattis Küper, Joshua Wiegmann, Matthias König

4        Data Analysis and Machine Learning
Literature offers various approaches to incorporate machine learning techniques in the
field of smart systems, ranging from simple or complex rule definitions to complex
trained models, which utilize multi-class classification, clustering, or regression. The
data gathered from the sensor cube contains raw sensor data input with no further
explanation or assessment. To detect the inner structure of the data and create artificial
labels, a clustering method is necessary.
The gathered data from the sensor cube is saved in a raw CSV file format without a
header. The data requires adequate preparation in the form of multiple alterations and
cleaning steps. The timestamps are converted to US format and also made sure to be
.NET compatible for further handling by Azure Machine Learning Studio4. Apart from
the timestamps, the data columns containing the sensor values have the data type floating
point.
The measurements began on 05/28/2018, at 07:50:44 and ended on 06/10/2018 at
23:58:44, which results in 14 days. A measurement is recorded every one minute. In
total, there are 17,877 measurements for 13 different features.
The prepared data is then further analyzed. For this process, the sensor measurements are
aggregated in 15 minute and one-hour intervals. For the intervals, the mean, sum,
standard derivation, as well as minimal and maximal values, are generated. In order to
yield a more meaningful insight into the data, the values are normalized via the z-score
normalization method. A z-score normalization method was preferred over min-max
normalization due to its better handling of outliers.
A smaller set of data was recorded and processed in the same manner from 06/16/2018
to 06/22/2018, encompassing 6,249 measurements. An additional set utilizing the VOC
4
    Microsoft Azure Machine Learning Studio: https://studio.azureml.net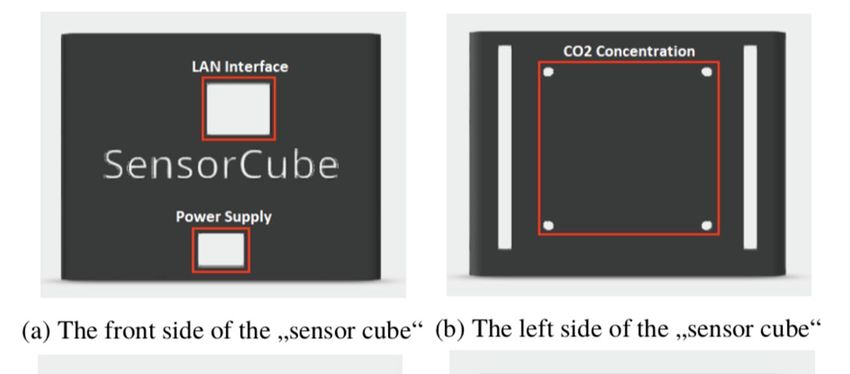
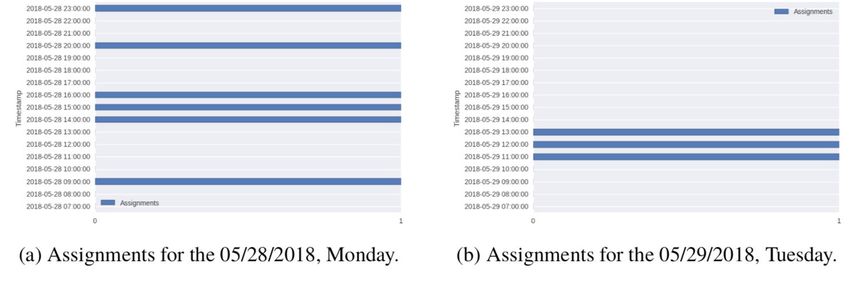
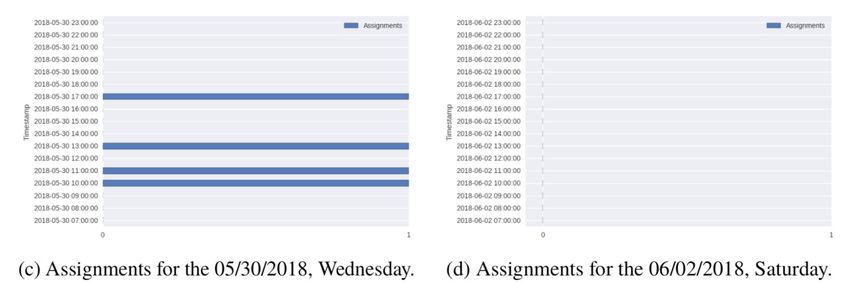
Determining room usage through a multi-sensor system and machine learning 67

sensor was collected between 06/25/2018 and 07/06/2018.
To create synthetic labels for the data, the K-means++ clustering method was selected,
using Euclidean distance. Due to the nature of this method, normalization is advisable to
increase the clustering results. A selection of possible centroids was done, ranging from
2 to 10, with 500 iterations. The Davies-Bouldin Index was selected as a metric to
measure clustering results. Although a higher score for more than 2 clusters was found, 2
clusters were ultimately selected, due to a proper interpretation of the results and
ignoring outliers. The purpose is to identify assignments, which indicate human presence
(e.g. due to a higher level of CO2, sound intensity, temperature, or air quality (VOC)).
Even though CO2 is better suited to detect human presence (usually higher amounts of
CO2 concentration is related to larger numbers of people inside a room) than VOC, we
measured the air quality via the VOC sensor as well, to identify possible correlations and
to find stronger evidence of human presence.
68   Philipp Viertel, Mattis Küper, Joshua Wiegmann, Matthias König

Clustering was applied on the larger dataset (05/28/2018 until 06/10/2018) and to test the
quality of the selected method and the data, only sound intensity was selected as a
feature. The results of these experiments are shown in Figure 5.

5    Results
The analysis of the data brought up a series of considerations. In Figures 6 to 9, two
working days (06/21/2018, 06/27/2018) and two weekend days (06/17/2018,
06/30/2018) are compared to each other. In the building, and especially the room in
which the sensor cube was stationed, no human activities occur during the weekends.
Therefore, the data looks different compared to a regular working day. Under the pretext
that the aim is to identify human activity and, therefore, a form of 'room usage'
prediction, the data from these examples should identify features which most likely
indicate human activity and which most likely do not. The most promising indicators are
illuminance (people need adequate lighting when they work in a room), temperature
(body temperature increases average temperature), humidity (due to breathing), CO2
(due to exhalation), and sound intensity, when you consider that people in groups usually
talk or produce some kind of noise while working. More data needs to be gathered and
analyzed to make a final statement concerning the VOC sensor.
The plots in Figure 6 and Figure 7 show that a difference in sound intensity is clear on a
weekend and working day. Due to the normalization, a visible relation between the
different measurement units becomes clear. The sound intensity is significantly lower
during the weekend, which can be used as an indicator of reduced or a lack of human
activity, while it is generally higher on a working day. Furthermore, CO2 is a good
indicator of room usage, as expected.
The factor, illuminance, is stable during both dates. Although it should be less during the
weekend, the impact of the daily hours of sunshine distorts the results in such a fashion,
that the indoor lights play only an underpart.
Temperature behaves in the same manner as it showed in the un-normalized analysis and
is mainly a product of the ambient temperature. The same applies to the factor humidity.
Determining room usage through a multi-sensor system and machine learning 69
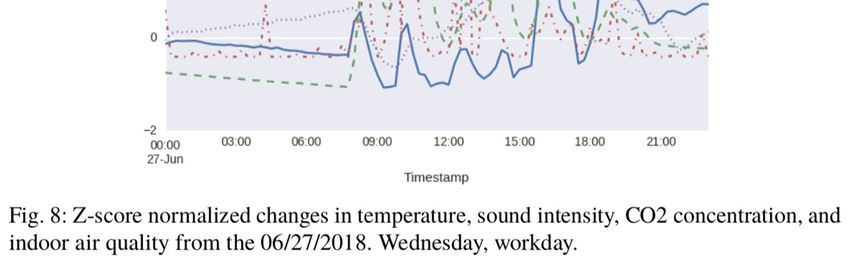
70   Philipp Viertel, Mattis Küper, Joshua Wiegmann, Matthias König

Figure 8 and 9 show examples of the measurements which utilize the VOC sensor. The
data shows a typical working day and a weekend day. The focus is mainly on the indoor
air quality index, and how it correlates together with CO2 and the temperature. The data
was treated and processed in the same manner as the other data. An air conditioner,
which could be a possible candidate for the origin of the sound source, creates a spike in
Determining room usage through a multi-sensor system and machine learning 71

sound between 3 AM and 6 AM, has a significant impact on the indoor air quality during
the weekend, and to a lesser, smoother degree on the working day.
The clustering of the data was of mixed quality and required manual correction for
specific holidays which fell into the measurement time series, as well as weekends. The
data is not large enough to find a proper generalization for model training.

6    Conclusion
The experimental setup worked successfully and a functioning work-flow was
established. The data is successfully broadcasted from the sensor cube, and the
developed multi-sensor system can be used efficiently for further research and
developments. Furthermore, trends, issues, and correlations in the sensor data were
found. The indicators that showed the largest likelihood of human activity were CO2
concentration, as well as sound intensity. This becomes especially visible when
comparing working days to weekends. As mentioned earlier, more data must be gathered
to evaluate the VOC sensor properly. Several issues occurred during the experiments: in
order to establish a meaningful correlation between human activity and sensor data,
more data is necessary. Most of the illuminance, as well as temperature values e.g., can
be traced back to the sun-hours of the respective days and their average temperatures. In
an ideal scenario, data from multiple months up to a year are needed to encompass the
entire temperature range, so that seasonal implications become comprehensible. Real-
time outdoor temperature data would allow for a more precise calculation of the indoor
temperature. These calculated values could show the implications of the other factors
(especially the people) in a room.

7    Future Work
Our work can be used as a basis to not only deduct human activity, but also to estimate
the intensity of human activity, such as group size. With the used features, a clustering
method can be applied on a larger set of data, and ultimately, a model can be trained to
predict room usage in the future, from which conclusions can be drawn concerning
energy saving and comfort, e.g. determining if a specific room is a good choice for a
specific use or if a different room is more suitable. A possible solution would be multi-
class classification, rather than a binary model, which only classifies general human
activity or no human activity. The risk of labeling a time stamp with no human activity
by missing out a single individual who is working quietly and therefore hard to detect
could be a problem as well.
To tackle the problems which occurred during the experiments, a series of solutions were
identified which should be realized in the future:
72   Philipp Viertel, Mattis Küper, Joshua Wiegmann, Matthias König

1.    In order to create a model that can predict future room usage, significantly more
      data is necessary. Therefore, measurements must continue. This will allow the
      tackling of seasonal changes better, as well as holidays or events that occur out of
      the ordinary, to allow a wider generalization effect. An increase in data and
      analysis will also benefit the modeling process and allow several improvements
      for future works:
      a)     Clustering is used to create artificial labels. Currently, these labels are faulty
             due to a very low level of generalization. E.g. it is necessary to manually
             correct the labels for certain times and dates (e.g. holidays). More data
             should make such implications more obvious and create better clustering
             results and therefore a better model.
      b)     A better dataset with generally more correct labels allows the re-thinking of
             the modeling process. Binary classification (human activity, i.e. room usage
             true or no human activity, i.e. room usage false) or a regression task (how
             likely it is, that a room is occupied or used at time X) are possible methods
             that require proper evaluation.
2.    Correlations between features require a more detailed approach, which will also
      benefit from more data.
3.    The idea to incorporate weather information to remove the distortion of the
      temperature sensor by the ambient temperature should be considered. This would
      allow the identification of the changes in the rooms without the effect of the
      weather. An increase in data will also generalize the seasonal effects in general.

The majority of these issues and ideas can be tackled by utilizing more data, which
requires longer periods of sensor measurement. The time tables for rooms for an entire
semester can also be used to verify the data or use it as hand-made labels. Although the
danger of incorrect labeling still exists, due to short-term room changes.
Another case could be the labeling of the data while recording. In this scenario, a person
in a room can use a tablet or some other form of interactive device, to rate the current
temperature, lighting level, and other factors. Depending on the person, the recorded
values in that range receive a specific label, such as comfortable or uncomfortable. Done
by multiple people, such a system aims to recommend an acceptable compromise to
please more than a single person. A similar experimental set-up has been described in
[MCM12], where the authors use the input of the number of persons through a tablet to
label the data.
Determining room usage through a multi-sensor system and machine learning 73
References
[Fi00] Fisk, William J: REVIEW OF HEALTH AND PRODUCTIVITY GAINS FROM
BETTER IEQ. In: Proceedings of Healthy Buildings. volume 4. Citeseer, p. 23, 2000.
[JV12] Järvinen, H.; Vuorimaa, P.: Anticipatory lighting in smart building. In: 2012 IEEE
Consumer Communications and Networking Conference (CCNC). pp. 390–394, Jan
2012.
[Ka13] Kanou, S.; Nagaoka, T.; Kobayashi, N.; Kurahashi, M.; Takeda, S.; Aoki, T.; Tsuji, T.;
Urano, T.; Abe, T.; Magatani, K.: Development of a new measurement system to
detect selectively volatile organic compounds derived from the human body. In: 2013
35th Annual International Conference of the IEEE Engineering in Medicine and
Biology Society (EMBC). pp. 3837–3840, July 2013.
[Le06] Lei, Quanhong, ed. Effect of temperature on task performance in office environment,
Moscow, Russia, 2006.
[MCM12] Mamidi, Sunil; Chang, Yu-Han; Maheswaran, Rajiv: Improving Building Energy Effi-
ciency with a Network of Sensing, Learning and Prediction Agents. In: Proceedings of
the 11th International Conference on Autonomous Agents and Multiagent Systems -
Volume 1. AAMAS ’12, International Foundation for Autonomous Agents and
Multiagent Systems, Richland, SC, pp. 45–52, 2012.
[MDT14] McKenna, E.; Doylend, N.; Thomson, M.: End-use demand in commercial office
buildings: case-study and modelling recommendations. In: 5th BauSim International
Building Performance Simulation Association Conference - Human-centred
building(s). pp. 67 – 74, Sep 2014.
[Mo98] Mozer, Michael C.: The neural network house: An environment that adapts to its
inhabitants. In: Proc. AAAI Spring Symp. Intelligent Environments. pp. 110–114,
1998.
[Mo14] Mocanu, E.; Nguyen, P. H.; Gibescu, M.; Kling, W. L.: Comparison of machine
learning methods for estimating energy consumption in buildings. In: 2014
International Conference on Probabilistic Methods Applied to Power Systems
(PMAPS). pp. 1–6, July 2014.
[RJD05] Rutishauser, U.; Joller, J.; Douglas, R.: Control and learning of ambience by an
intelligent building. IEEE Transactions on Systems, Man, and Cybernetics - Part A:
Systems and Humans, 35(1):121–132, Jan 2005.
[Sc16] Schröder, L.; König, M.; Hoffmann, M.; Pörtner, A.: Überlegungen zu Multi-Sensor-
Aktor-Systemen und Kontrolle in intelligenten Arbeitsumgebungen. In: Informatics
(LNI), Gesellschaft für Informatik. 2016.
[Va15] van der Valk, S.; Myers, T.; Atkinson, I.; Mohring, K.: Sensor networks in
workplaces: Correlating comfort and productivity. In: 2015 IEEE Tenth International
Conference on Intelligent Sensors, Sensor Networks and Information Processing
(ISSNIP). pp. 1–6, April 2015.
[WWY12] Wang, L.; Wang, Z.; Yang, R.: Intelligent Multiagent Control System for Energy and
Comfort Management in Smart and Sustainable Buildings. IEEE Transactions on
Smart Grid, 3(2):605–617, June 2012.You can also read


