A Novel Deep Learning Stack for APT Detection - MDPI
←
→
Page content transcription
If your browser does not render page correctly, please read the page content below
applied
           sciences
Article
A Novel Deep Learning Stack for APT Detection
Tero Bodström * and Timo Hämäläinen
 Faculty of Information Technology, University of Jyväskylä, 40014 Jyväskylä, Finland; timo.t.hamalainen@jyu.fi
 * Correspondence: tero.t.bodstrom@student.jyu.fi

 Received: 11 February 2019; Accepted: 8 March 2019; Published: 13 March 2019

 Abstract: We present a novel Deep Learning (DL) stack for detecting Advanced Persistent threat
 (APT) attacks. This model is based on a theoretical approach where an APT is observed as a
 multi-vector multi-stage attack with a continuous strategic campaign. To capture these attacks,
 the entire network flow and particularly raw data must be used as an input for the detection process.
 By combining different types of tailored DL-methods, it is possible to capture certain types of
 anomalies and behaviour. Our method essentially breaks down a bigger problem into smaller tasks,
 tries to solve these sequentially and finally returns a conclusive result. This concept paper outlines,
 for example, the problems and possible solutions for the tasks. Additionally, we describe how we
 will be developing, implementing and testing the method in the near future.

 Keywords: Advanced Persistent Thread (APT); Deep Learning (DL); network anomaly detection

1. Introduction
       Due to the complexity and dynamical behaviour of APT attacks, we propose a system architecture
for a novel prototype that takes into account the behaviour of these sophisticated attacks while
detecting anomalies. Thus, we need to consider following issues: (i) outliers; (ii) data dimensions;
(iii) non-linear historical events; (iv) underlying hidden interconnections; and (v) previously unknown
attacks. To capture outliers caused by APT, the system must deal with the above-mentioned issues
effectively. Therefore, we need to develop a stack of Deep Learning (DL) methods where each layer
has its own purpose instead of having one single method. Finally, the system requires a data fusion
function where all detected hostile outliers are collected and combined. The system architecture must
be carefully planned, empirically tested and optimised as well as the correct data representation for
the input must be selected.
       APT attack is a sophisticated network attack, with the purpose of long-term espionage or maximal
destruction for target systems and networks. It has multiple functionalities, which are developed to
avoid detection for as long as possible. Some of those functionalities include multiple simultaneous
attack vectors with different phases, masquerading as communication data, random changes in
execution time intervals, horizontal and vertical connections and mimicking legitimate traffic [1].
A common way to execute APT is via spear-fishing email spoofing attack but, if there exists an insider
threat, it can be executed even inside the target network [2,3].
       To the best of our knowledge, this type of system architecture has not been presented yet in
academic research, even though APT attack detection methods have been proposed.
       Next, in Section 2, current detection problems are briefly discussed. Then, in Section 3, data
properties and how they relate to detection process are presented. Section 4 describes the DL detection
stack with details and preliminary complexity evaluation is included in Section 5. The paper concludes
with Sections 6 and 7 is reserved to suggestions for future works.

Appl. Sci. 2019, 9, 1055; doi:10.3390/app9061055                                 www.mdpi.com/journal/applsci
Appl. Sci. 2019, 9, 1055 2 of 10
2. Current Detection Problems
In our previous paper [1], we proposed a novel method for detecting (APT) attacks by using
OODA loop and Black Swan theory. The purpose of the method is to take into account current detection
problems and improve detection rate for earlier unknown attacks, which is currently quite low. In
our method, the intention is not to manipulate network data flow before it is passed to the detection
process. That is, instead of, for example, reducing dimensions or standardising input data, we pass the
data directly to the detection process. This way, one does not reduce overall complexity or randomness
of the data.
Current anomaly detection research [4,5] relies on similar methods, where outdated and heavily
manipulated datasets, such as KDD98, KDDCUP99 and NSLKDD [6], are used for benchmarking
proposed methods. Another issue is that complex problems are solved in a simple manner, that is,
one type of method is used for handling the entire problem, such as one type or Machine Learning
(ML) or Deep Learning (DL) algorithm. Additionally, Albanese [7] et al. pointed out in their research
that current intrusion detection systems rely heavily on attack fingerprints, which are data sequences
to identify an attack, or attack profiles, which are behaviour models of an attack. Both mentioned
methods require prior knowledge of an attack, thus cannot be used for detecting earlier unknown
attacks. The authors proposed a framework that identifies sequence of events, separates unexplained
cases based on prior models and estimates the probability of an attack. Moreover, Au [8] et al. stated
that the number of smartphones is increasing and they are somewhat vulnerable, which increases
the probability for being a victim of an APT. These devices are connected to cloud services all the
time, increasing personal data transmission, as well as the probability for espionage. Considering
mentioned issues, we can state that the overall complexity in a network increases due to growing
number of devices and data transmissions, which also adds more randomness to data.
Nicho [9] et al. stated in their study that the academic community has neglected research related
to APT attacks, and, while research exists, it is too focused on detecting attacks afterwards. Therefore,
their approach focused on preventing human error, which commonly is the reason that a campaign
gets started in the first place. In addition, human error cannot be eliminated completely, thus more
research on sophisticated detection methods are also required. As mentioned above, “...[APT attack]
real-time detection might not be possible nor necessary. Instead, the focus is to drop the detection time from years
or months to an acceptable one, that is, days” [1].
3. Data Properties
This section describes briefly different properties that data have as well as the purpose of the
proposed anomaly detection process. In this paper, the data are considered a combination of network
packet headers and payload.
3.1. Outliers
Outlier detection has some serious problems. One can think that a tiny outlier is not significant
for the detection process. However, in the case of APT and due to its level of sophistication, it might
be the only way to detect such an attack. For mentioned issues, one has to select a data processing
method such that the processing does not modify the data structure.
For these reasons, in our proposed approach, the network data are not manipulated in any way.
The detection system input is raw binary data.
3.2. Data Dimensions
In many proposed detection methods, data dimensions are reduced for gaining speed and more
computational power. This type of approach however can cause important outliers to vanish, thus
reducing detection rate.Appl. Sci. 2019, 9, 1055 3 of 10
In our proposed method, data dimensions are left as they are. For example, TCP/IP packet
header and data fields have a maximum length of 1500 bytes in Ethernet network and spread over 27
dimensions. As was stated in our earlier paper [1], we implemented the DL stack in a way that it takes
the data input in binary form. Dimensionality is high, as 1500 bytes represent 12,000 dimensions in
binary, however each dimension has the value of 0 or 1, thus data standardisation is not needed in
input layer. An alternative option is to present data field values as integers and use dataframe fields as
a dimensionality, for example 27 dimensions in TCP/IP packet. With the latter approach, data values
are higher, but, as minimum and maximum values are known, standardisation might not be needed. It
is worth testing both approaches and comparing which performs better, if any difference exists. With
this approach, the original dimensionality is kept in data.
3.3. Non-Linear Historical Events
For non-linear historical events, there exists two known problems: (i) “duration blindness”; and
(ii) “curse of learning”. These issues may be solved with multiple sequential neural networks. That is,
neural networks are trained in a certain period of time, for example every 24 h, and a stack is built with
these neural networks. In this manner, detected outliers are passed through various neural networks
and are checked for earlier existence to avoid the duration blindness. This also reduces the curse of
learning as neural networks are trained with fewer data, thus reducing the possibility of overfitting.
Lu et al. stated that even the transmission time interval during the APT communication is not
regular. The data flow may also consist of more than one data packet. Moreover, even though the flow
duration can be shorter than 5 s [10], we can state that communication patterns can be detected from
historical outliers.
3.4. Underlying Hidden Interconnections
After the execution, an APT tends to seek another vulnerable hosts and spread itself through a
local network, thus creating hidden interconnections. By identifying these unusual internal host-to-host
connections, it is possible to detect unexpected anomalies. Let us assume that PCs in a local network
should not communicate with each other, except for example with instant messaging application.
However, system detects Remote Desktop Protocol (RDP) communicating within several PCs, which
should raise a warning. On the other hand, RDP can also be used for legit tasks, thus, by using it, an
attack can communicate undetected for a long time, in the case the detection system falsely identifies it
as false negative.
3.5. Previously Unknown Attacks
Previously unknown attacks are a common problem for traditional detectors, such as intrusion
detection systems (IDS), which are based on attack signatures [11]. In the case of an APT, the problem
is even worse, as the attack uses sophisticated stealth methods and mimics normal traffic and thus can
hide undetected for a long periods of time [1,9].
Deep learning methods have shown significant potential to detect this type of
anomalies [5,11–22]. Albeit studied methods vary from image processing to signal processing and so
forth, basic functionalities can be converted to another type of detection process.
4. Deep Learning Detection Stack
For resolving the above-mentioned problems, we propose a Deep Learning stack that uses
sequential neural networks for detection and classification. Our approach also takes into account
detection differences between algorithms, instead of using a single algorithm. With this method,
the stack extracts previously known data, detects anomalies, classifies and does comparisons with
historical outliers as well as seeks their interconnections from network traffic flow.Appl. Sci. 2019, 9, 1055 4 of 10
4.1. Known Attacks
The purpose of the first layer is to detect known attacks from data flow, save them to database
with timestamp and finally remove the detected data from the flow. The rest of the data flow is pushed
to the second detection layer, according to Figure 1. The detection accuracy is not 100 percent, thus
even when the known attacks are removed, there is a possibility for existing traces of known attacks in
the rest of the data.
The first layer includes multiple neural networks, which are trained regularly. That is, instead of
using one neural network that is re-trained and updated, we add new neural networks to the stack,
which are trained with new outlier detections. This method is used to avoid overfitting.
For testing and optimisation purposes, we execute tests with semi-supervised (SDL) and
unsupervised (UDL) Deep Learning methods in this layer. Neural networks are trained with data from
known attacks and, in the case the DL detects a known attack, it drops data from flow. For example, an
Autoencoder (AE) that consists of deep layers can be trained only with known attacks, thus, when it
detects a known attack, it reconstructs the observation correctly. In other words, all data that cause
enough reconstruction error are passed to the next layer.
Here is a more detailed example how the first and second detection layers are re-trained and
kept up to date. We use the following syntax: xNy, where x represents the assigned AE (1 for known
attacks and 2 for normal traffic) and y is the interval number that increases from 1 to n. To clarify, when
considering the first and second layers, there are count of y unique AEs with their own input and
output layers. That is, the first and second detection layers, as described in Figure 1, do not include
only one AE.
First, the training interval is set, 24 h in this example. That is, a new neural network is trained
every 24 h. The neural network in the first layer 1N1 is trained with available data of known attacks
and the second layer’s neural network 2N1 with available normal traffic data. The data input from
the first day is tested with 1N1 and 2N1 for anomalies. The first and second layer networks for the
second day are trained with the data processed on the first day, including the identified attacks and
updated normal traffic. The data input from the second day is processed by 1N1 and 1N2 for known
attacks as well as 2N1 and 2N2 for normal traffic. The networks for the third day are constructed in
the same fashion resulting in three networks in the first layer and three networks in the second layer
for detecting known attacks and normal traffic, respectively. In other words, each layer after the first
one is trained with the detections only from the previous layer.
With this architecture, the number of neural networks increases depending on the training interval.
It can be set for a day, week, month or some suitable value. For example, when limiting the maximum
time of operation of the whole system to one year and the training interval is one day, the number
of neural networks would be 365 in the first and second layers. For time complexity, this means that
there would be 365 standard time operations in each layer, which could exclude real-time detection.
However, it can be assumed that detection process would not take too long time. With the described
architecture, we can minimise the possibility for overfitting, which is important for neural networks to
be able to detect anomalies.
4.2. Normal Traffic
The second layer detects normal network traffic and removes it from the flow. As the known
attacks and normal network traffic are discarded from the data flow, there can still exist traces of
previously unknown observations in the rest of the data, which can be malicious.
The second layer also contains multiple neural networks. However, when a new service or
application is installed to a network, the second layer should be updated accordingly. These highly
dynamical functionalities in a network cause new types of data, which increases the number of
legit outliers.
As in the earlier layer, both SDL and UDL methods are tested for optimal performance. While the
detection process stays the same, the neural networks are trained only with normal traffic data. WhenAppl. Sci. 2019, 9, 1055 5 of 10
considering the AE, the outliers that are causing reconstruction error are passed to the next layer and
the data that are successfully reconstructed are dropped from the flow.
4.3. Historical Appearance
The purpose of the third layer is to detect if an outlier has appeared earlier in the network.
Since APT can stay in inertia-state for a long period of time to avoid detection, historical appearance
verification is important for the process. The third layer is kept up to date by re-training the neural
network with the outliers that have passed through the detection process.
The third layer detects using Recurrent Neural Network—Long Short-Term Memory (RNN-LSTM)
units whether an outlier has appeared before. While RNN can learn temporal patterns and values that
are estimated from current and past values, its memory function is short. RNN-LSTM adds a cell to
RNN enabling longer memory that has the ability to learn these patterns from longer sequences of
data, thus improving performance and allowing better time-series estimation [20].
IP/TCP packet is constructed from 27 unique fields, thus each field is treated as a unique feature
and all 27 features are passed through neural network, while comparing to earlier features. The neural
network is trained with earlier outliers, which allows the neural network to compare 27 features
simultaneously and predict earlier appearance.
We can think features as signal fragments, that is previously found outliers create some type
of continuous signals and these signals can be visualised afterwards. One approach to identify new
outliers in signals is to detect change points in signals [13]. However, we cannot assume that a new
outlier, in any of the 27 signals, creates a detectable change point, as signals do not necessarily behave
regularly in our case.
Vinayakumar et al. stated that anomalous events do not have patterns and they occur frequently
in a network intentionally or unintentionally [20]. From this perspective, we can consider known
outliers as normal and new outliers as anomalies, while seeking those from outlier data flow. Qin et al.
tested RNN-LSTM for anomaly detection in IP bearer network by gathering data from 31,000 ports
with higher than 1Gb/s traffic. After training the system for one week, they managed to get good
anomaly detection rates in a test environment of 824 ports. They considered three types of anomalies:
(i) warning, one anomaly dot; (ii) issue, two continuous anomaly dots; and (iii) alarm, more continuous
anomaly dots. However, they stated that fixed the one-week monitoring period caused many false
positives, as traffic in port level is not so periodical. Another concern was computing usage while
using RNN-LSTM in each port of test environment, as it uses a lot of computing power [16], thus we
have to consider one or more sequential RNN-LSTMs, not parallel.
4.4. Outlier Classification
The fourth layer classifies outliers to different categories, which include at least the following:
(i) known attacks; (ii) predicted attacks; (iii) unknown outliers; and (iv) normal traffic. After the
classification process, unnecessary outliers can be removed from data, that is Catagories (i) and (iv).
There are different methods for classifying outliers. Zolotukhin et al. proposed [11] a method
utilising Growing Hierarchical Self-Organising Map (GHSOM) for detecting anomalies in dynamical
web requests to web-server. The purpose is to identify anomalies caused by misuse that do not have
signatures. Test results show high detection rate with very low false positive rate, thus a similar
approach is used as a part of our method. Unsupervised GHSOM allows the self-organising map to
grow horizontally and vertically by using multiple layers. This way it creates higher variance and
detects smaller differences among outliers. To support the usage of GHSOM in our method, Chiu et
al. stated that 2D Self-Organising Map (SOM) has two disadvantages: (i) map size has to be defined
before training process; and (ii) there are no hierarchical relations between clusters. Their test results
also show low false positive and negative rates [12]. Therefore, we do not limit the cluster expansions
or the GHSOM size, as there does not exist any information on how many clusters should be chosen or
how high or wide the GHSOM should grow. However, Shi et al. stated that “the hierarchical growingAppl. Sci. 2019, 9, 1055 6 of 10
mechanism of GHSOM is faulty” and proposed sGHSOM with minor additional functionality to solve
this issue. They added a new parameter to calculate similarity of classes by using a distance metric
between layers, which is missing from GHSOM. Their benchmarking tests show increased classification
accuracy compared to GHSOM [19], thus sGHSOM has to be evaluated as well.
4.5. Anomaly Mapping
The final phase of the detection process is mapping anomalies, where their interconnections are
analysed with a graph algorithm. The purpose of this layer is to map outliers and reveal their hidden
connections, which may remain invisible otherwise. There are two possible solutions for this phase,
either using Graph Database (GDB) or Graph-based Neural Network (GNN) implementation that
finds spatial, temporal and semantic relationships between data points.
Zhang [22] proposed GDB for knowledge management in his research. GDB is used to reveal
connections among user created documents and how they are used. Data from relational database
are easily converted to GDB and connections made visible. The author stated three benefits for using
GDB: (i) they are ideal for modelling scenarios in a network; (ii) many-to-many relationships are easy
to implement; and (iii) quick access to data with simple queries. Hurlburt [14] stated that, as GDBs
deals with properties and connections, they represent a lot of information, which stays hidden without
research. It is also pointed out that GDB supports describing all kinds of complex modern networks.
Moreover, Yisong [21] et al. stated that data integrated via GDB can store network topology directly,
thus it supports highly complex network presentations.
GNN, as presented by Scarselli et al., is a general class neural network for graphs, which is
proposed to seek underlying relationships among data [18]. Qi et al. stated that GNN “is a dynamic
model where the hidden representation of all nodes evolve over time” [15]. Quek et al. used GNN to study
structural image presentation and classification. They stated that GNN is capable of processing both
positional and non-positional graphs. Their experimental tests show that GNN has great potential
for classifying data [17]. In GNNs, edges represent relationships, while nodes represent objects or
concepts [15,17,18]. Thus, we can state that, for our purposes, nodes represent devices and their
properties in a network and edges connections between the nodes.
5. Detection Engine
The purpose of the proposed method is to process outliers as well as to detect and identify APT
attacks. For this purpose, we define data flow as follows:
F = data flow
K = known attacks
N = normal traffic
O1 = unknown legitimate outliers
O2 = unknown attack outliers
KT = traces of known attacks
NT = traces of normal traffic
F = {K, N, O1 , O2 }
The first and second layers remove known data. However, as mentioned the Sections 4.1 and 4.2,
outlier data can still contain traces of known attacks and normal traffic.
After the first layer, the data flow is:
F1 = {KT , N, O1 , O2 }Appl. Sci. 2019, 9, 1055 7 of 10
After the second layer, it is:
F2 = {KT , NT , O1 , O2 }
Historical events are tested with RNN-LSTM where outlier features flow through it. If there is
no earlier detection, it is a new outlier. When an outlier is detected in this phase, it is added to the
database. Then, this information becomes available for the classifier.
The classifier organises outliers to the clusters in GHSOM, based on data packets. As GHSOM
does not limit the growth, wecan detect slight differences in outliers. It can identify new types of
clusters if they appear in data, since it is an unsupervised method.
Afterwards, outliers are mapped with a graph method, which reveals their hidden
interconnections. These hidden connections can reveal how widely the APT has spread and which are
the communication protocols and ports. In the case an attack uses internal routing communication
channel, it can also be tracked.
The last phase is data fusion, where outlier data are mapped in such that they can be visualised
for investigation and analysis purposes.
For the final tests, there are four different stack models as described in Table 1.
Table 1. Stack models for final tests.
1st layer SDL SDL UDL UDL
2nd layer SDL UDL SDL UDL
3rd layer RNN-LSTM RNN-LSTM RNN-LSTM RNN-LSTM
4th layer GHSOM GHSOM GHSOM GHSOM
5th layer GNN/GDB GNN/GDB GNN/GDB GNN/GDB
6. Complexity Evaluation
The method’s complexity is discussed in this section. It is necessary to evaluate the complexity
from two points of view, system and time complexities. As these complexities have significant impact
on computational requirements, they have to be evaluated in order to assess whether the system
performs in reasonable time. By evaluations, we can estimate minimum hardware requirements and
expected maximum time for data packet to pass entire detection process.
The system has a main function, which is anomaly detection and supporting functions, such
as regular updates, visualisation, writing to database and so forth. To keep in mind the purpose
of the research, we focus on anomaly detection complexity. Supporting functions can be executed
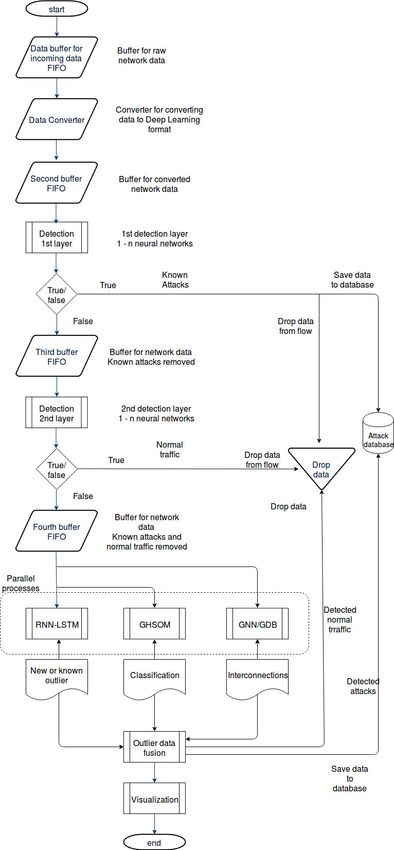
in separated cores, thus they do not interfere with the detection process. Figure 1 shows data flow
through the DL detection stack in a general level.
6.1. System Complexity
From the flow chart in Figure 1, we can identify that the complexity of the system is increasing
towards the end of the stack. The first two layers are simple and linear while removing known data
from a flow; even though there can exist 1–n neural networks, the operation remains similar in every
neural network. The final layers increase the complexity as outliers are pushed to three different types
of neural networks, each having a special purpose, as described above. After outliers are processed in
each neural network, data fusion is executed to arrange data in such manner that they can be presented
or visualised.
The source code is required for detailed Cyclomatic complexity evaluation, thus it can be executed
when the complete prototype is developed.Appl. Sci. 2019, 9, 1055 8 of 10
Figure 1. Data flow through the detection process.Appl. Sci. 2019, 9, 1055 9 of 10
6.2. Time Complexity
The method’s disadvantages necessitate various comparisons. Observing time complexity from
the flow chart, it is obvious that the following functions require detailed analysis: (i) data conversion;
(ii) first detection layer; (iii) second detection layer; (iv) RNN-LSTM; (v) GHSOM; (vi) GNN/GDB;
and (vii) data fusion. However, as the prototype is under development, complete pseudo code or
actual code is not available, thus the time complexity evaluation is left to future works.
7. Conclusions
Ideally, the proposed architecture for the detection system captures the sophisticated dynamical
behaviour of APT attacks directly from network flow. However, since the system is complex,
many empirical tests are required for evaluating detection performance, including the complexity
analysis discussed.
The method is highly modular, which allows, for example, for comparison tests with different
and less complex DL algorithms as well as variations in architectural design. In other words, it is
possible to make a variety of modifications, while seeking the best detection accuracy with optimal
performance
8. Future Works
As future works, in addition to continuing with the topic, we will: (i) analyse the network data
and which format supports well our proposed method; and (ii) study categorising as there exist
some concerns that unknown outliers can contain legitimate data as well as earlier unknown attacks.
Additionally, our research will concentrate on creating altered network anomalies from known attacks
and testing their effect on detection rate and categorisation. The prototype time complexity will be
estimated later.
Author Contributions: Conceptualisation, T.B. and T.H.; Methodology, T.B.; Investigation, T.B. and T.H.;
Writing—Original Draft Preparation, T.B.; and Writing—Review and Editing, T.B. and T.H.
Funding: This research received no external funding.
Conflicts of Interest: The authors declare no conflict of interest.
References
1. Bodström, T.; Hämäläinen, T. A Novel Method for Detecting APT Attacks by Using OODA Loop and Black
Swan Theory. In Computational Data and Social Networks; Chen, X., Sen, A., Li, W., Thai, M., Eds.; CSoNet
2018, Lecture Notes in Computer Science; Springer: Cham, Switzerland, 2018; Volume 11280. [CrossRef]
2. Eidle, D.; Ni, S.Y.; DeCusatis, C.; Sager, A. Autonomic security for zero trust networks. In Proceedings
of the 2017 IEEE 8th Annual Ubiquitous Computing, Electronics and Mobile Communication Conference
(UEMCON), New York, NY, USA, 19–21 October 2017; pp. 288–293. [CrossRef]
3. Hu, P.; Li, H.; Fu, H.; Cansever, D.; Mohapatra, P. Dynamic defense strategy against advanced persistent
threat with insiders. In Proceedings of the 2015 IEEE Conference on Computer Communications (INFOCOM),
Kowloon, Hong Kong, China, 26 April–1 May 2015; pp. 747–755. [CrossRef]
4. Bodström, T.; Hämäläinen, T. State of the Art Literature Review on Network Anomaly Detection. In Internet
of Things, Smart Spaces, and Next Generation Networks and Systems; Galinina, O., Andreev, S., Balandin, S.,
Koucheryavy, Y., Eds.; NEW2AN 2018, ruSMART 2018, Lecture Notes in Computer Science; Springer: Cham,
Switzerland, 2018; Volume 11118. [CrossRef]
5. Bodström, T.; Hämäläinen, T. State of the Art Literature Review on Network Anomaly Detection with
Deep Learning. In Internet of Things, Smart Spaces, and Next Generation Networks and Systems; Galinina, O.,
Andreev, S., Balandin, S., Koucheryavy, Y., Eds.; NEW2AN 2018, ruSMART 2018, Lecture Notes in Computer
Science; Springer: Cham, Switzerland, 2018; Volume 11118. [CrossRef]Appl. Sci. 2019, 9, 1055 10 of 10
6. Moustafa, N.; Slay, J. UNSW-NB15: A comprehensive data set for network intrusion detection systems
(UNSW-NB15 network data set). In Proceedings of the 2015 Military Communications and Information
Systems Conference (MilCIS), Canberra, ACT, Australia, 10–12 November 2015; pp. 1–6. [CrossRef]
7. Albanese, M.; Erbacher, R.; Jajodia, S.; Molinaro, C.; Persia, F.; Picariello, A.; Sperli, G.; Subrahmanian,
V.S. Recognizing Unexplained Behavior in Network Traffic; Pino, R., Ed.; Network Science and Cybersecurity,
Advances in Information Security; Springer: New York, NY, USA, 2014; Volume 55. [CrossRef]
8. Au, M.H.; Liang, K.; Liu, J.K.; Lu, R.; Ning, J. Privacy-preserving personal data operation on mobile
cloud—Chances and challenges over advanced persistent threat. Future Gener. Comput. Syst. 2018, 79,
337–349. [CrossRef]
9. Nicho, M.; Khan, S.N. A decision matrix model to identify and evaluate APT vulnerabilities at the user plane.
In Proceedings of the 2018 41st International Convention on Information and Communication Technology,
Electronics and Microelectronics (MIPRO), Opatija, Croatia, 21–25 May 2018; pp. 1155–1160. [CrossRef]
10. Lu, J.; Zhang, X.; Wang, J.; Ying, L. APT Traffic Detection Based on Time Transform. In Proceedings of the
2016 International Conference on Intelligent Transportation, Big Data & Smart City (ICITBS), Changsha,
China, 17–18 December 2016; pp. 9–13. [CrossRef]
11. Zolotukhin, M.; Hämäläinen, T.; Juvonen, A. Online anomaly detection by using N-gram model and growing
hierarchical self-organizing maps. In Proceedings of the 2012 8th International Wireless Communications
and Mobile Computing Conference (IWCMC), Limassol, Cyprus, 27–31 August 2012; pp. 47–52. [CrossRef]
12. Chiu, C.; Chen, J.; Yu, F. An Effective Distributed GHSOM Algorithm for Unsupervised Clustering on Big
Data. In Proceedings of the 2017 IEEE International Congress on Big Data (BigData Congress), Honolulu, HI,
USA, 25–30 June 2017; pp. 297–304. [CrossRef]
13. Gavrin, S.; Murzagulov, D.; Zamyatin, A. Detection of Change Point in Process Signals by Cascade
Classification. In Proceedings of the 2018 International Russian Automation Conference (RusAutoCon),
Sochi, Russia, 9–16 September 2018; pp. 1–4. [CrossRef]
14. Hurlburt, G. High Tech, High Sec.: Security Concerns in Graph Databases. IT Prof. 2015, 17, 58–61. [CrossRef]
15. Qi, X.; Liao, R.; Jia, J.; Fidler, S.; Urtasun, R. 3D Graph Neural Networks for RGBD Semantic Segmentation.
In Proceedings of the 2017 IEEE International Conference on Computer Vision (ICCV), Venice, Italy,
22–29 October 2017; pp. 5209–5218. [CrossRef]
16. Qin, G.; Chen, Y.; Lin, Y. Anomaly Detection Using LSTM in IP Networks. In Proceedings of the 2018 Sixth
International Conference on Advanced Cloud and Big Data (CBD), Lanzhou, China, 12–15 August 2018;
pp. 334–337. [CrossRef]
17. Quek, A.; Wang, Z.; Zhang, J.; Feng, D. Structural Image Classification with Graph Neural Networks. In
Proceedings of the 2011 International Conference on Digital Image Computing: Techniques and Applications,
Noosa, QLD, Australia, 6–8 December 2011; pp. 416–421. [CrossRef]
18. Scarselli, F.; Gori, M.; Tsoi, A.C.; Hagenbuchner, M.; Monfardini, G. The Graph Neural Network Model.
IEEE Trans. Neural Netw. 2009, 20, 61–80. [CrossRef] [PubMed]
19. Shi, H.; Xu, H. An enhanced GHSOM for the intrusion detection. In Proceedings of the 11th International
Conference on Wireless Communications, Networking and Mobile Computing (WiCOM 2015), Shanghai,
China, 21–23 September 2015; pp. 1–5. [CrossRef]
20. Vinayakumar, R.; Soman, K.P.; Poornachandran, P. Long short-term memory based operation log anomaly
detection. In Proceedings of the 2017 International Conference on Advances in Computing, Communications
and Informatics (ICACCI), Udupi, India, 13–16 September 2017; pp. 236–242. [CrossRef]
21. Ma, Y.; Wu, Z.; Guan, L.; Zhou, B.; Li, R. Study on the relationship between transmission line failure rate and
lightning information based on Neo4j. In Proceedings of the 2014 International Conference on Power System
Technology, Chengdu, China, 20–22 October 2014; pp. 474–479. [CrossRef]
22. Zhang, Z.J. Graph Databases for Knowledge Management. IT Prof. 2017, 19, 26–32. [CrossRef]
c 2019 by the authors. Licensee MDPI, Basel, Switzerland. This article is an open access
article distributed under the terms and conditions of the Creative Commons Attribution
(CC BY) license (http://creativecommons.org/licenses/by/4.0/).You can also read