CHIA-DROPBOX: A NOVEL ANALYSIS AND VISUALIZATION PIPELINE FOR MULTIPLEX CHROMATIN INTERACTIONS - BIORXIV
←
→
Page content transcription
If your browser does not render page correctly, please read the page content below
bioRxiv preprint first posted online Apr. 18, 2019; doi: http://dx.doi.org/10.1101/613034. The copyright holder for this preprint
(which was not peer-reviewed) is the author/funder, who has granted bioRxiv a license to display the preprint in perpetuity.
                                    All rights reserved. No reuse allowed without permission.

        ChIA-DropBox: a novel analysis and visualization pipeline for multiplex
        chromatin interactions

        Simon Zhongyuan Tian1, Daniel Capurso1, Minji Kim1, Byoungkoo Lee1, Meizhen
        Zheng1, Yijun Ruan1,2,3*

        1
            The Jackson Laboratory for Genomic Medicine, Farmington, CT, USA.

        2
        Department of Genetics and Genome Sciences, University of Connecticut Health
        Center, Farmington, CT, USA.

        3
            Huazhong Agricultural University, Wuhan, China.

        *email: yijun.ruan@jax.org

        Abstract

        ChIA-Drop is a new experimental method for mapping multiplex chromatin interactions
        with single-molecule precision by barcoding chromatin complexes inside microfluidics
        droplets, followed by pooled DNA sequencing. The chromatin DNA reads with the same
        droplet-specific barcodes are inferred to be derived from the same chromatin interaction
        complex. Here, we describe an integrated computational pipeline, named ChIA-
        DropBox, that is specifically designed for reconstructing chromatin reads in each droplet
        and refining multiplex chromatin complexes from raw ChIA-Drop sequencing reads, and
        then visualizing the results. First, ChIA-DropBox maps and filters sequencing reads, and
        then reconstructs the “chromatin droplets” by parsing the barcode sequences and
        grouping together chromatin reads with the same barcode. Based on the concept of
        chromosome territories that most chromatin interactions take place within the same
        chromosome, potential mixing up of chromatin complexes derived from different
        chromosomes could be readily identified and separated. Accordingly, ChIA-DropBox
        refines these “chromatin droplets” into purely intra-chromosomal chromatin complexes,
        ready for downstream analysis. For visualization, ChIA-DropBox converts the ChIA-Drop
        data to pairwise format and automatically generates input files for viewing 2D contact
        maps in Juicebox and viewing loops in BASIC Browser. Finally, ChIA-DropBox
        introduces a new browser, named ChIA-View, for interactive visualization of multiplex
        chromatin interactions.

                                                                                                                                    1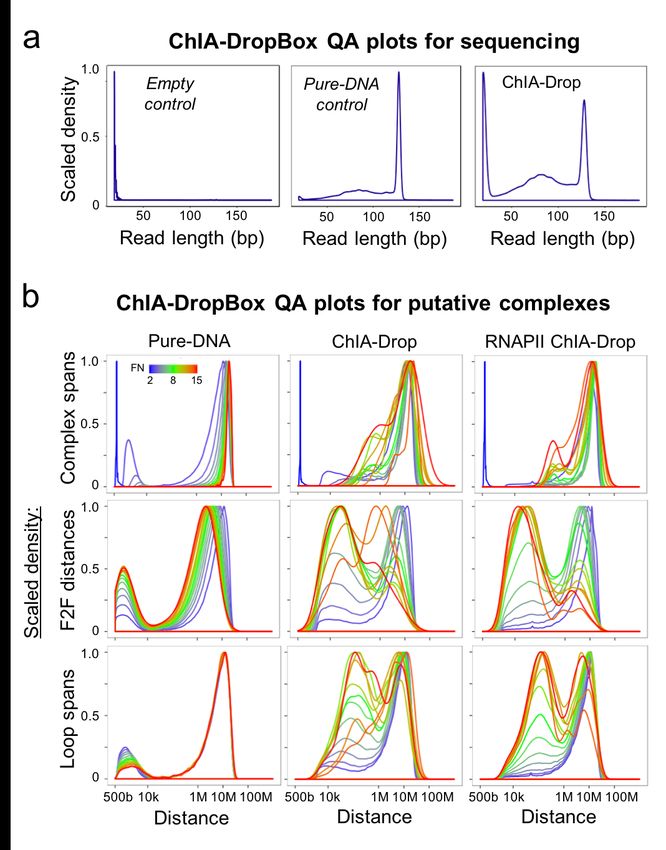
bioRxiv preprint first posted online Apr. 18, 2019; doi: http://dx.doi.org/10.1101/613034. The copyright holder for this preprint
(which was not peer-reviewed) is the author/funder, who has granted bioRxiv a license to display the preprint in perpetuity.
                                    All rights reserved. No reuse allowed without permission.

        Introduction

        Over the past decade, experimental methods have been developed to map the three-
        dimensional (3D) organization of genomes. These methods detect bulk chromatin
                                                                                                                 1
        interactions, genome-wide chromosome conformation capture (Hi-C)                                             or enrich for
        chromatin interactions involving a specific protein, chromatin interaction analysis with
        paired-end tag sequencing (ChIA-PET) 2. ChIA-PET and Hi-C have been extensively
        applied and have suggested complex chromosomal folding structures. However, these
        methods are based on nuclear proximity ligation, and reveal only pairwise contacts at
        population-level aggregated from millions of cells. Thus, the true multiplex nature of
        chromatin complexes at the single-molecule level had remained unexplored. A new
        direction is to develop single molecule approaches to directly detect multiplex chromatin
        interactions from either single cells 3 or bulk cells 4.
                  Recently, we developed ChIA-Drop, a novel experimental method for detecting
        multiplex chromatin interactions with single-molecule precision via droplet-based and
        barcode-linked sequencing 5. In ChIA-Drop, a crosslinked and fragmented chromatin
        sample is directly loaded into a microfluidics system (10X Genomics). The chromatin
        sample can either be without specific enrichment (similar as for Hi-C) or enriched for a
        specific protein factor by immunoprecipitation (similar as for ChIA-PET). Once the
        sample is loaded in the microfluidics system, the chromatin complexes are partitioned
        into Gel-bead-in-Emulsion (GEM) droplets. Each droplet then contains a gel bead of
        unique DNA oligonucleotides and reagents for linear amplification and barcoding of the
        chromatin DNA templates (Fig. 1a). The barcoded amplicons with GEM-specific indices
        can then be pooled for standard high-throughput sequencing, and the single-molecule
        chromatin complexes can be inferred computationally through processing and analysis
        of the sequencing data.
                  We have successfully generated dozens of ChIA-Drop (no enrichment) and
        RNAPII-enriched ChIA-Drop libraries, and have demonstrated that the method is simple,
        robust, and reproducible for detecting multiplex chromatin interactions 5. The ChIA-Drop
        experimental method has many advantages: it can analyze chromatin samples directly
        without the need to purify chromatin DNA, it is independent of proximity ligation, it
        detects multiplex chromatin interactions with single-molecule precision, it is simple and
        robust to perform experimentally, and it uses standard pooled sequencing of the
        barcoded fragments. However, the pooled sequencing means that computational tool is
        essential to obtain interpretable data by reconstructing and refining the multiplex

                                                                                                                                    2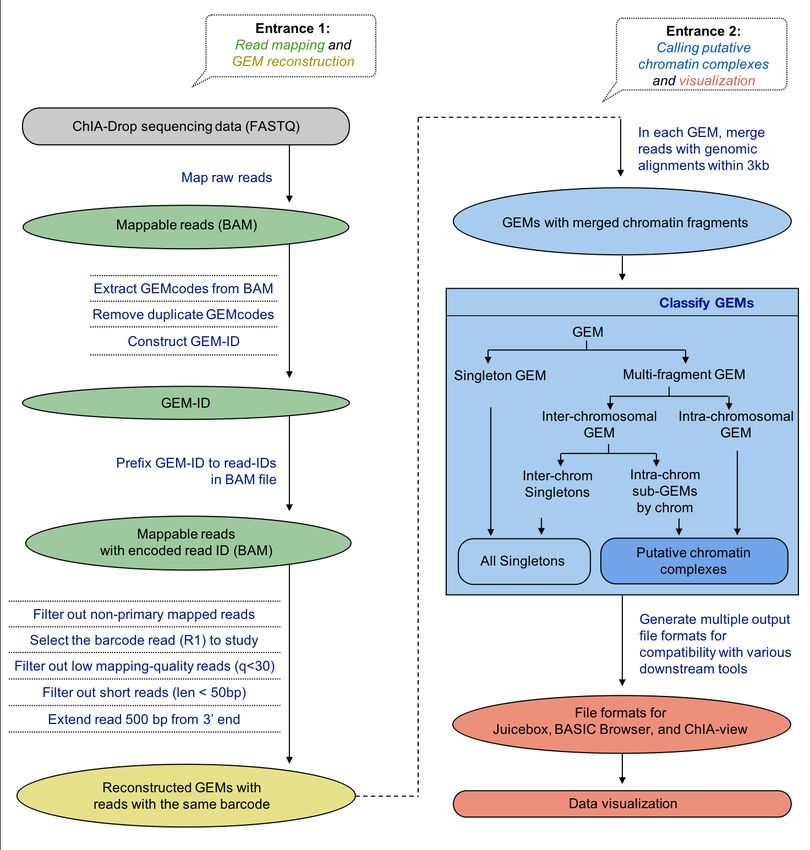
bioRxiv preprint first posted online Apr. 18, 2019; doi: http://dx.doi.org/10.1101/613034. The copyright holder for this preprint
(which was not peer-reviewed) is the author/funder, who has granted bioRxiv a license to display the preprint in perpetuity.
                                    All rights reserved. No reuse allowed without permission.

        chromatin complexes. Thus, during the course of ChIA-Drop development, we also
        developed a concomitant computational pipeline ChIA-DropBox with an advanced and
        open-source framework to tackle the major challenge of going from raw ChIA-Drop
        sequencing reads for mapping, analyzing, and visualizing multiplex chromatin
        interactions. Here, we describe the modules in the ChIA-DropBox pipeline, a novel
        analysis and visualization pipeline for multiplex ChIA-Drop data (Fig. 1, Supplementary
        Fig. 1).

        Results
        Overview of ChIA-DropBox.
        The ChIA-DropBox pipeline is composed of four modules, mapping of sequencing reads,
        assembling of chromatin fragments and chromatin droplets, refinement of chromatin
        complexes, and data visualization. Briefly, the 10X Genomics Chromium software suite
        pipeline is first applied to align reads to the reference genome and to identify the GEM
        barcode of each read. ChIA-DropBox then groups uniquely mapped reads with the same
        barcode to reconstruct the GEMs. For each GEM, reads with overlapping genomic
        coordinates within 3 Kb are merged into “chromatin fragments” (3 Kb chosen according
        to the average DNA fragment size with restriction enzyme HindIII digestion). Finally,
        based on the concept of chromosome territories 6, GEMs are then refined into purely
        intra-chromosomal “putative chromatin complexes”, ready for downstream analysis and
        visualization (Fig. 1b). ChIA-DropBox then enables visualization of the resulting
        chromatin interactions using several approaches. First, the data are converted to
        pairwise format and input files are generated to support existing tools: 2D contact map
                                                 7
        visualization using Juicebox                 and loop visualization using BASIC Browser 8. In addition,
        ChIA-DropBox introduces a new web-based browser, named ChIA-View, for visualizing
        multiplex chromatin complexes. ChIA-View includes multiple display types, which
        support visualization of chromatin complexes in topological domains or around gene
        promoters (Fig. 1c).

        Quality Assessment of ChIA-Drop DNA sequencing data.
        First, ChIA-DropBox automatically generates a series of quality-assessment (QA) plots,
        every time the pipeline is run to automate assessment of each library (Fig. 2). The first
        set of QA plots are distributions of the insert sizes in the sequencing reads to assess the
        quality of library preparation, loading concentration, and sequencing. For example, these

                                                                                                                                    3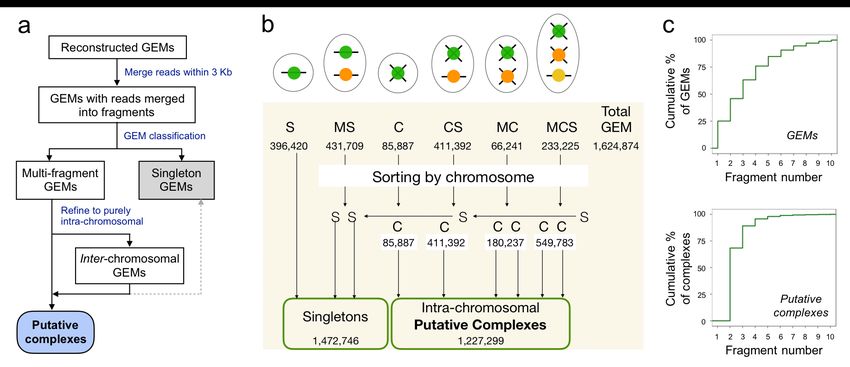
bioRxiv preprint first posted online Apr. 18, 2019; doi: http://dx.doi.org/10.1101/613034. The copyright holder for this preprint
(which was not peer-reviewed) is the author/funder, who has granted bioRxiv a license to display the preprint in perpetuity.
                                    All rights reserved. No reuse allowed without permission.

        QA plots were generated for three libraries: a negative control library (empty droplets), a
        positive control library (pure-DNA) that fragments evenly distributing into droplets, and a
        ChIA-Drop library of chromatin complexes that distributing into droplets as a complex
        unit (Fig. 2a). Therefore, in the negative control, the droplets were predominantly empty.
        In the positive control, the droplets predominantly contained fragments for amplification.
        In the ChIA-Drop library, there were some empty droplets and some droplets that
        contained fragments for amplification. Thus, this QC plot indicates that the ChIA-Drop is
        a high-quality experimental library. While increasing the loading concentration could
        eliminate the empty droplets, it may also result in more droplets containing two
        independent chromatin complexes by random chance. Thus, a balance is necessary to
        obtain high-quality results, as indicated by the QA plot.
                  The second set of QA plots is used to assess the final chromatin complexes
        called from the ChIA-DropBox data processing workflow. These QA plots depict the
        distributions of various distance metrics used to summarize the complexes: (1) the span
        of the complex (from the first fragment to the last fragment), (2) the neighboring
        fragment-to-fragment (“F2F”) distances in the complex, and (3) the pairwise “loop”
        distances between all combinations of fragments in the complex (Supplementary Fig. 2).
        For example, ChIA-DropBox was used to generate these QA plots for three types of
        libraries in Drosophila S2 cells: a pure-DNA control sample (DNA was purified from the
        chromatin fragment after de-crosslinking), an unenriched ChIA-Drop sample, an RNAPII-
        enriched ChIA-Drop sample (Fig. 2b). In the pure-DNA control sample, most of the
        putative chromatin complexes have very long span (> 10 Mb in linear chromosomal
        distance) and long-range F2F distances (~ 1 Mb). Thus, the control sample of pure DNA
        reveals that the noise profile of ChIA-Drop is very long-range putative complexes, which
        likely resulted from independent DNA fragments being randomly partitioned into a
        shared droplet.
                  In contrast, the distance distributions for the ChIA-Drop sample and the RNAPII-
        enriched ChIA-Drop sample are much different than those for the control sample (Fig.
        2b). For low-fragment-number chromatin complexes in the ChIA-Drop samples, most of
        the F2F distances are long-range (~1 Mb) indicating that these low-fragment-number
        GEMs are mostly noise, similar to the pure-DNA control sample. However, for high-
        fragment-number chromatin complexes in the ChIA-Drop samples, most of the F2F
        distances are in the biologically meaningful range of interaction distances (from 10 kb to
        1 Mb), implying that these high-fragment-number chromatin complexes contain real

                                                                                                                                    4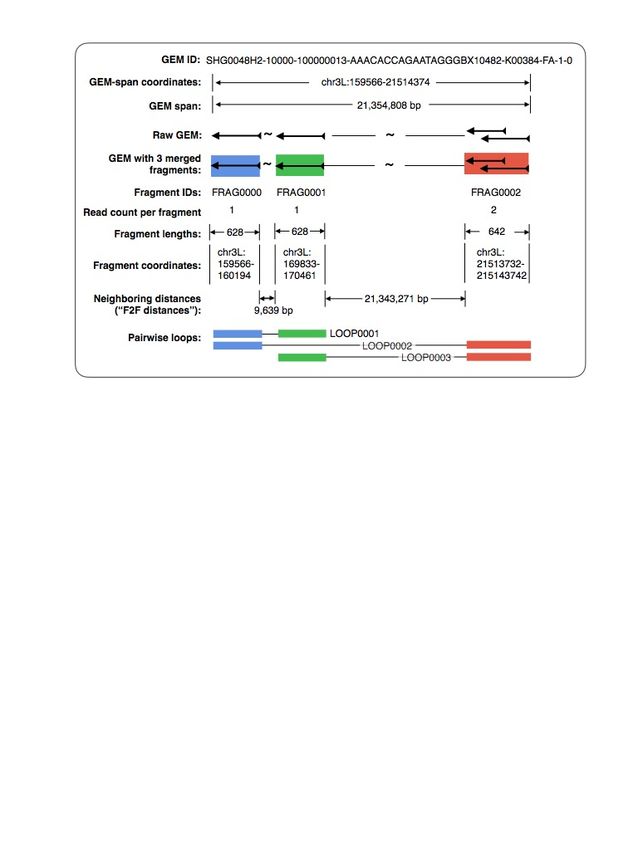
bioRxiv preprint first posted online Apr. 18, 2019; doi: http://dx.doi.org/10.1101/613034. The copyright holder for this preprint
(which was not peer-reviewed) is the author/funder, who has granted bioRxiv a license to display the preprint in perpetuity.
                                    All rights reserved. No reuse allowed without permission.

        signal for multiplex interactions. Thus, the QA plots from ChIA-DropBox indicate that the
        ChIA-Drop sample and the RNAPII-enriched ChIA-Drop sample are high-quality libraries
        containing real signal for multiplex chromatin interactions.

        Reconstruction and refinement of chromatin complexes.
        We next describe the detailed procedure for calling putative chromatin complexes (Fig.
        3a). The initial steps of ChIA-DropBox data processing are: map reads to the reference
        genome, retain high-quality and uniquely mapped reads, parse the barcodes of the
        reads, and reconstruct the GEM droplets by grouping together reads with the same
        barcode. Once the GEM droplets are reconstructed, ChIA-DropBox refines them into
        putative chromatin complexes to attain interpretable data for analysis and visualization.
                  The first consideration is that during the experimental protocol, the linear
        amplification and barcoding initializes at random positions along each chromatin
        fragment. Thus, a single chromatin fragment could be represented by multiple reads with
        shifted positions and on different strands. Accordingly, within each computationally
        reconstructed GEM, ChIA-DropBox then assembles “chromatin fragments” by merging
        reads that have linear genomic alignments within 3Kb, consistent with the experimental
        chromatin fragment size.
                  Once reconstructed GEMs with merged chromatin fragments are ready, ChIA-
        DropBox then classifies and refines these GEMs into putative chromatin complexes to
        yield interpretable data (Fig. 3a). The goal of thus refinement step is to filter out two
        types of noise. The first type of noise is the presence of “singleton” chromatin fragments
        that are not in an interaction complex with any other fragments. A GEM may be
        comprised of only a singleton or of two or more singletons from different chromosomes
        (Fig. 3b). These purely singleton GEMs are filtered out. In addition, a GEM may contain
        a chromatin complex plus a singleton from a different chromosome (Fig. 3b). In this
        case, the GEM is refined by splitting it so that the singleton is filtered out and the
        putative chromatin complex is retained.
                  The second type of potential noise is a GEM that contains multiple chromatin
        complexes from different chromosomes (Fig. 3b). In this case, it is difficult to distinguish
        whether these inter-chromosomal multi-complex GEMs are true interactions or if they
        are examples of independent chromatin complexes from different chromosomes were
        randomly partitioned into the same droplet in the microfluidics device. Based on the
        concept of chromosome territories, the majority of chromatin complexes should be intra-

                                                                                                                                    5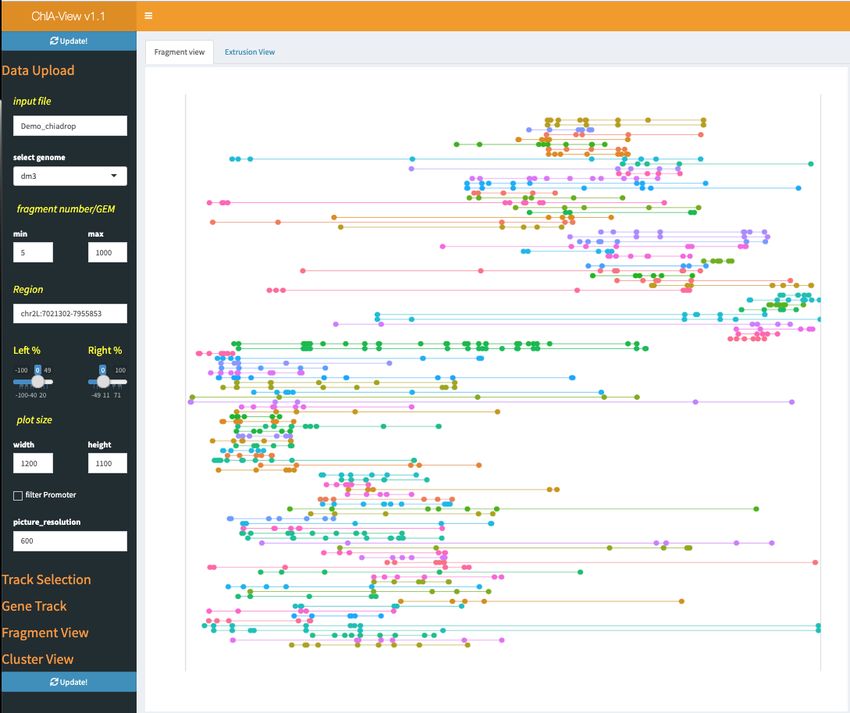
bioRxiv preprint first posted online Apr. 18, 2019; doi: http://dx.doi.org/10.1101/613034. The copyright holder for this preprint
(which was not peer-reviewed) is the author/funder, who has granted bioRxiv a license to display the preprint in perpetuity.
                                    All rights reserved. No reuse allowed without permission.

        chromosomal. Thus, ChIA-DropBox refines these GEMs by splitting them into purely
        chromosomal putative chromatin complexes (Fig. 3a). This refinement procedure was
        applied to a Drosophila ChIA-Drop library and the numbers of input GEMs by category
        are indicated, as well as the number of final putative chromatin complexes (Fig. 3b).
                  The results of calling putative chromatin complexes can be seen clearly by
        visualizing the distributions of the fragment number of the GEMs (before refinement) and
        the distribution of the fragment number of the putative chromatin complexes (Fig. 3c).
        Before refinement, around 25% of the GEMs are singletons, and there are also
        considerable GEMs with very high fragment number (reflecting inter-chromosomal
        multicomplex droplets). In contrast, after refinement, the putative chromatin complexes
        predominantly have between two and six fragments (Fig. 3c). Thus, ChIA-DropBox
        generates interpretable data from the raw ChIA-Drop FASTQ files by: mapping and
        filtering reads, reconstructing the GEMs based on the barcodes, and ultimately refining
        GEMs into putative chromatin complexes.

        Visualization for multiple chromatin interaction data.
        Once putative chromatin complexes are ready, ChIA-DropBox then automatically
        generates multiple output file formats to support diverse types of downstream analysis
        and visualization. First, the interactions from the putative chromatin complexes are
        converted to pairwise contacts (similar to Hi-C or ChIA-PET data), and the appropriate
        input files are generated to support existing analysis and visualization tools for pairwise
                                                                                                                 9
        contacts (Supplementary Fig. 3). Specifically, ChIA-DropBox calls Juicer                                     to generate a
                                                                                                         7                      10
        contact matrix for visualization of 2D contact maps using Juicebox                                   or Juicebox.js          . In
        addition, since the ChIA-PIPE pipeline for ChIA-PET data processing has workflows for
        calling loops and calling binding peaks from pairwise contacts 8, ChIA-DropBox also
        generates a file format compatible with ChIA-PIPE data processing (see Methods). The
        resulting peaks and pairwise loops can then be visualized with high-resolution using
        BASIC Browser 8 (Supplementary Fig. 3).
                  While it is important to support existing pairwise visualization tools for
        comparison with ChIA-PET and Hi-C data, the fundamental advance of ChIA-Drop is
        that it captures multiplex chromatin complexes at the single-molecule level. Thus, ChIA-
        Drop data contain more detailed information about the true nature of chromatin
        complexes than can be displayed as pairwise contacts. Accordingly, ChIA-DropBox also
        introduces a new interactive browser, named ChIA-View, that is specifically designed to

                                                                                                                                       6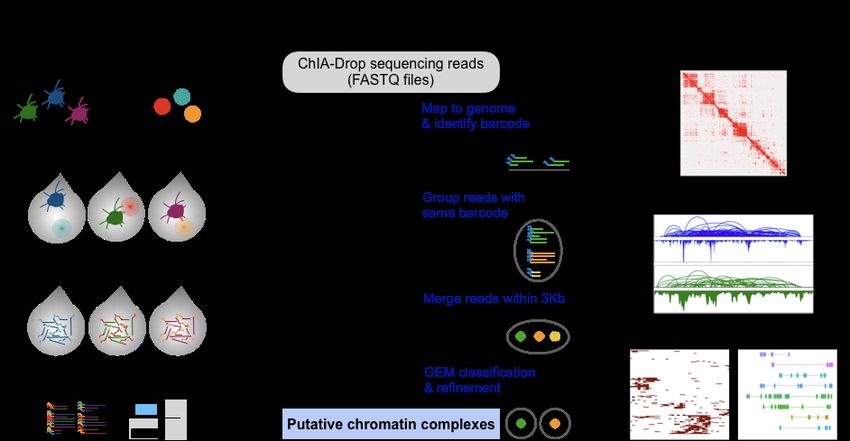
bioRxiv preprint first posted online Apr. 18, 2019; doi: http://dx.doi.org/10.1101/613034. The copyright holder for this preprint
(which was not peer-reviewed) is the author/funder, who has granted bioRxiv a license to display the preprint in perpetuity.
All rights reserved. No reuse allowed without permission.
leverage the single-molecule and multiplex nature of ChIA-Drop data. ChIA-View is a
fully featured and highly customizable browser that has four different display modes,
each intended to facilitate its own type of downstream biological interpretation.
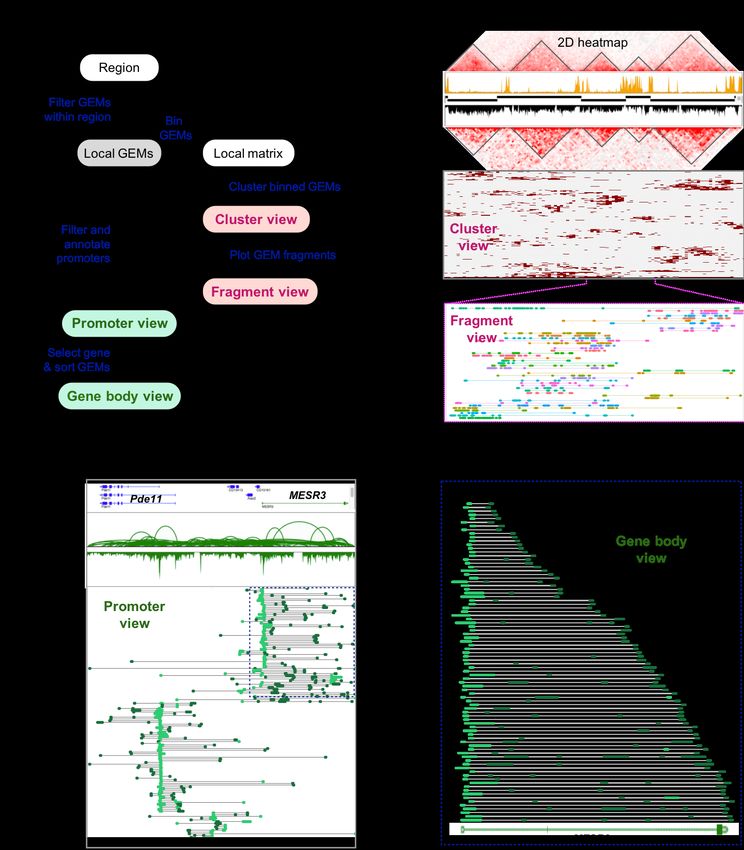
In ChIA-View, the fragments of each chromatin complex are displayed in their
linear genomic alignments along the x-axis, and the different single-molecule complexes
are arranged along the y-axis (Fig. 4). The first display mode is the “cluster view”. In the
cluster view, the genomic region of interest is binned along the x-axis, and then the
chromatin complexes with their binned fragments are arranged by similarity along the y-
axis via hierarchical clustering (see Methods) (Fig. 4a). The cluster view enables
biological interpretation by facilitating visualization of chromatin complexes across broad
chromosomal regions, such as across multiple TADs (Fig. 4b). After hierarchical
clustering has been applied to the binned chromatin complexes, the complexes can also
be displayed with their original (unbinned) fragments (Fig. 4a). The display mode is
named the “fragment view”. The fragment view is especially useful for visualizing the
heterogeneity within topological domains at the single-molecule level (Fig. 4b). For
example, fragment views of ChIA-Drop complexes in topological domains reveals
substantial heterogeneity, consistent with recent reports from super-resolution
11
microscopy .
While the cluster view and fragment view in ChIA-View are well suited for
unenriched ChIA-Drop data, the next two display modes are specifically designed for
RNAPII-enriched ChIA-Drop data and take into account the promoter-centric nature of
the data. In the “promoter view”, chromatin complexes within the genomic region are
filtered to retain those that overlap promoters (Fig. 4a). Then, the complexes are
grouped together along the y-axis based on which gene’s promoter they overlap. Within
each complex, the fragments are color coded to indicate whether they overlap a
promoter element or a non-promoter element. For example, promoter views of RNAPII-
enriched ChIA-Drop data in Drosophila reveals that most single-molecule complexes
involve only one promoter and multiple non-promoter elements (Fig. 4c). This
observation is consistent with a recent report from super-resolution microscopy that 80%
12
of RNAPII foci in the nucleus have a single RNAPII protein . Once the promoter-
involving complexes have been filtered and color annotated, complexes within a single
gene body can then be viewed. In the “gene body view” display mode, chromatin
complexes fully contained within the body of a single gene are retained and then they
are sorted by span along the y-axis (Fig. 4a). For example, the gene body view of
7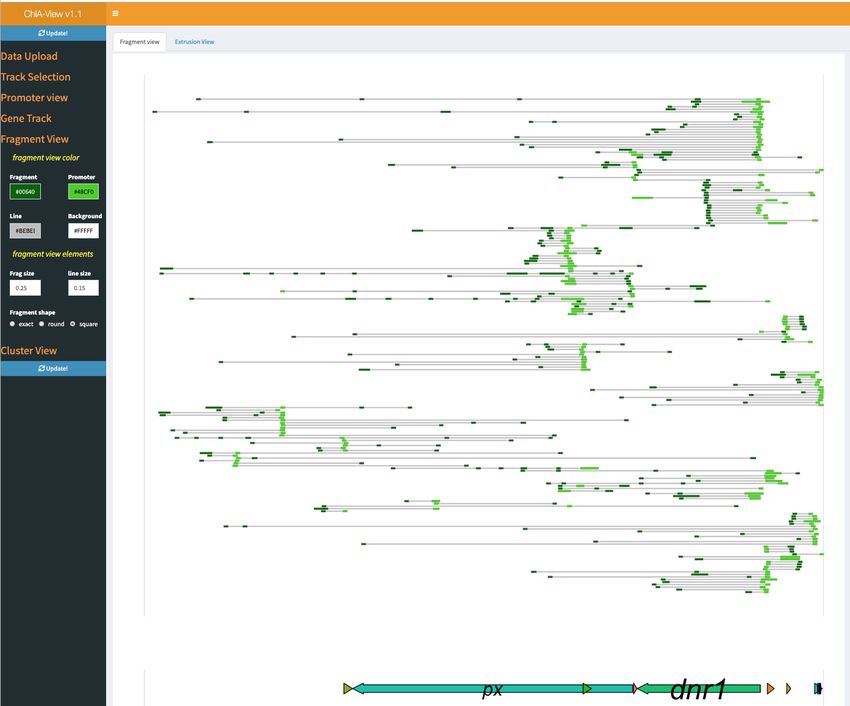
bioRxiv preprint first posted online Apr. 18, 2019; doi: http://dx.doi.org/10.1101/613034. The copyright holder for this preprint
(which was not peer-reviewed) is the author/funder, who has granted bioRxiv a license to display the preprint in perpetuity.
                                    All rights reserved. No reuse allowed without permission.

        RNAPII-enriched ChIA-Drop data in Drosophila reveals a pattern that would be
        consistent with a one-side extrusion model of transcription (Fig. 4d). ChIA-View is
        available as an easy-to-use R Shiny application (Supplementary Fig. 4).

        Discussion
        In conclusion, ChIA-DropBox is a major advance both in terms of the processing and the
        visualization of a novel data type. Considering that ChIA-Drop experiments use pooled
        sequencing of barcoded fragments, the computational reconstruction of the data is
        essential to yield interpretable results. Thus, ChIA-DropBox is a crucial companion of
        ChIA-Drop. Starting with raw sequencing reads, it performs read mapping, barcode
        parsing, GEM reconstruction, and refinement of putative chromatin complexes.
                  For visualization, ChIA-DropBox automatically converts the data to pairwise
        format and generates input files to support Juicebox views of 2D contact maps and
        BASIC Browser views of loops. ChIA-DropBox also introduces a new browser named
        ChIA-View, the first visualization tool for single-molecule multiplex chromatin complexes
        to the best of our knowledge.
                  Overall, the current version of ChIA-DropBox including ChIA-View cover all the
        core elements necessary for processing, analyzing, and visualizing the multiplex
        chromatin interaction data from ChIA-Drop experiments. Notably, ChIA-View was
        designed to support visualization of any multiplex chromatin interaction data, and can
        readily support the visualization of multiplex interactions from GAM or SPRITE. Thus, we
        envision ChIA-View as a comprehensive browser for multiplex interactions, which will
        also enable comparative analyses of the data generated from different experimental
        methods. In addition, future versions of ChIA-DropBox will be extended to support
        processing of data generated by GAM and SPRITE.
                  The introduction of ChIA-DropBox will enable researchers to immediately begin
        interpreting their ChIA-Drop experiments. As there are many outstanding questions in
        the field of 3D genome organization that can only be addressed at the single-molecule
        level, we anticipate that these computational advances and tools will have high visibility
        and high impact. Empowered with ChIA-DropBox and ChIA-View, researchers will be
        able to explore many crucial topics, such as: the cell-to-cell variation of chromatin
        interactions in topological domains; the mechanisms of chromatin loop and domain
        formation; the landscape of chromatin interactions in heterogeneous cell populations,

                                                                                                                                    8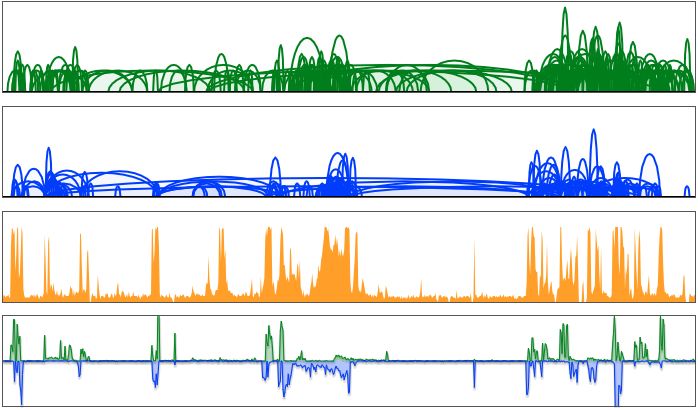
bioRxiv preprint first posted online Apr. 18, 2019; doi: http://dx.doi.org/10.1101/613034. The copyright holder for this preprint
(which was not peer-reviewed) is the author/funder, who has granted bioRxiv a license to display the preprint in perpetuity.
                                    All rights reserved. No reuse allowed without permission.

        such as tumors’ and immune cell populations; and the multiplex nature of transcriptional
        regulation and gene-gene interactions.

        Acknowledgements

        This study is supported by a Jackson Laboratory Director’s Innovation Fund
        (DIF19000-18-02). Y.R. is funded by 4DN (U54 DK107967) and ENCODE (UM1
        HG009409) consortia. Y.R. is also funded by Human Frontier Science Program
        (RGP0039/2017), and supported by Florine Roux Endowment.

        Author contributions

        S.Z.T developed the ChIA-DropBox pipeline and D.C., M.K. B.L., M.Z., and Y.R.
        provided input. S.Z.T. developed ChIA-View and D.C., M.Z., and Y.R. provided input.
        D.C. developed the utility to make the output compatible with ChIA-PIPE loop calling.
        S.Z.T and D.C. created the figures and M.Z. and Y.R. provided input. D.C., S.Z.T., and
        Y.R. wrote the manuscript. All authors read and approved the final manuscript.

        Competing interests

        The authors do not declare any competing interests.

        Methods

        ChIA-DropBox workflows
        ChIA-DropBox includes two components: the data-processing and the data-visualization.
        The data-processing workflow contains four categories of procedures: read alignment;
        GEMcode identification and read filtering; GEM calling; and chromatin-complex calling.
        There are 39 processing steps distributed among these four categories. At the end of
        GEM calling, ChIA-DropBox has a step to generate multiple formats of files for various
        purposes, including quality-assessment (QA) plots, and statistics tables. In the data
        visualization workflow, three types of visualization are supported. First, ChIA-DropBox
        converts the multiplex chromatin interaction data to pairwise format and automatically
                                                                                                            7,9
        generates input files to visualize 2D contact maps using Juicebox                                         . Second, ChIA-
        DropBox uses the pairwise-format data to generate input files for presenting interaction

                                                                                                                                    9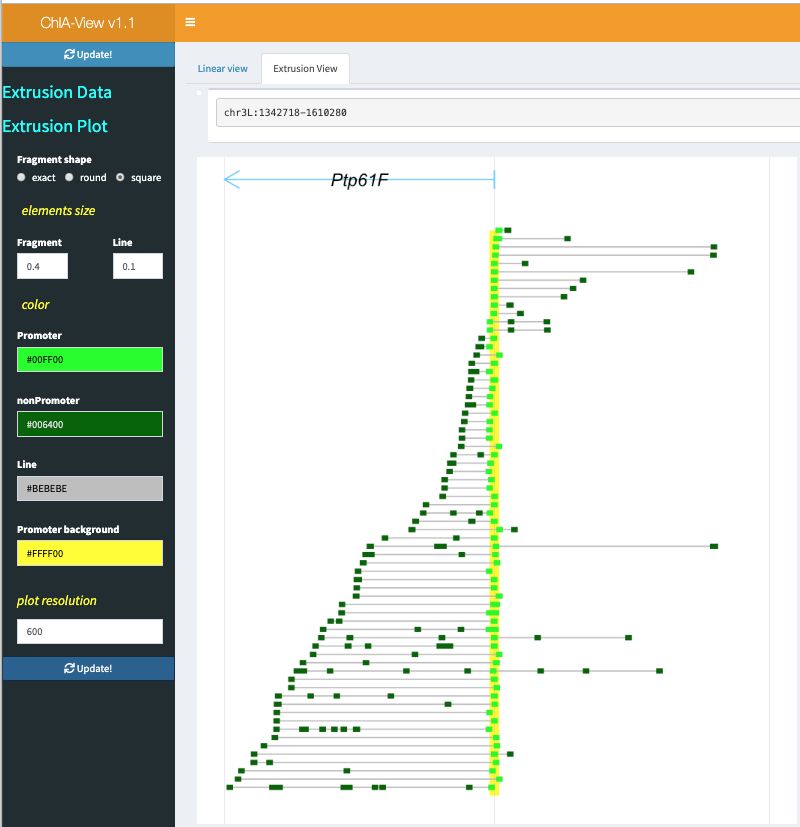
bioRxiv preprint first posted online Apr. 18, 2019; doi: http://dx.doi.org/10.1101/613034. The copyright holder for this preprint
(which was not peer-reviewed) is the author/funder, who has granted bioRxiv a license to display the preprint in perpetuity.
                                    All rights reserved. No reuse allowed without permission.

        loops in genome browsers. Third, ChIA-DropBox includes a novel web-based browser,
        named ChIA-View, for visualizing multiplex chromatin interactions.

        Read alignment
        In this step, reads are aligned to the reference genome to generate a BAM file of aligned
        reads with GEMcodes. In addition, a statistics table is generated, which includes library
        name, total paired-end read count, PCR redundancy rate, among others.
                  First, base-calling is performed using the 10X Genomics longrange mkfastq
        pipeline (v2.1.5), and then a reference genome index for the longranger pipeline is
        created using longrange mkref (v2.1.5). Next, mapping is performed via the 10X
        Genomics longrange wgs pipeline (v2.1.5) (see Supplementary Methods). When using
        longranger wgs, the parameters (e.g., number of processors; amount of memory) are set
        in the “MRO” file (see Supplementary Methods). Important values in the MRO file are
        the library ID, the path and names of the FASTQ files, and the path of the reference
        genome folder (see Supplementary Methods).

        GEMcode identification and read-quality filtering
        In this step, the GEMcode of each read is identified, the read ID is renamed to include
        the GEMcode, and the reads are filtered for quality.
                  First, GEMcodes are extracted from the BAM file by accessing the “BX” tag field
        in the BAM files. Then, the ID of each read is renamed to include the GEMcode, along
        with its numeric GEM ID (see Supplementary Methods). This re-naming allows the GEM
        ID to be propagated forward when the BAM files are converted to other output formats
        for downstream analyses.
                  Second, reads are filtered for quality. The R1 read of each pair is retained for
        downstream analysis, since it contains both the GEMcode and the amplified DNA
        sequence. After removing non-primary alignments and low map-quality reads (MAPQ <
        30 and read length < 50bp), each read is then extended by 500 bp from its 3’ end,
        consistent with the DNA template length in the ChIA-Drop experiment. These filtering
        steps are performed using pysam (v0.7.5) in python (v2.7.9) and samtools (v0.1.19).

        Calling GEMs
        In this step, GEMs are reconstructed. Uniquely mapped reads with the same GEMcode
        are grouped together. Overlapping reads within each GEM are merged into chromatin
        fragments. Then, the GEMs are refined and classified.

                                                                                                                                    10
bioRxiv preprint first posted online Apr. 18, 2019; doi: http://dx.doi.org/10.1101/613034. The copyright holder for this preprint
(which was not peer-reviewed) is the author/funder, who has granted bioRxiv a license to display the preprint in perpetuity.
All rights reserved. No reuse allowed without permission.
All reads with the same GEMcode and their extended genomic coordinates
overlapping within 3Kb distance are merged to represent a chromatin fragment, using
13
the python package pybedtools (v0.7.10) . This distance was chosen because the
average fragment length of the genomic DNA in Drosophila after HindIII digestion is 3
Kb. This merging step also collapses any duplicate reads, so it is not necessary to
include a separate PCR de-duplication step. Three output file formats of the GEMs for
the downstream analysis are 1) one GEM per line, 2) one fragment per line, and 3) one
read per line.
After merging overlapping reads into chromatin fragments, each GEM is then
categorized based on the number of fragments it contains. A GEM with one chromatin
fragment (F = 1) is considered a singleton GEM, whereas a GEM with two or more
fragments (F ≥ 2) is considered a multiplex GEM, representing a chromatin interaction
complex with multiple fragments. Based on the genomic coordinates of the chromatin
fragments, multiplex GEMs are further classified as intra-chromosomal GEMs if all
fragments within a GEM mapped to the same chromosome, or inter-chromosomal GEMs
if the fragments within a GEM mapped to different chromosomes. Since most
interactions occur within chromosome territories 6, the inter-chromosomal GEMs are
then split into their intra-chromosomal sub-components. After the refinement and
classification, an additional output file is generated with one “sub-GEM” per line.
Statistic report table
Extensive quality-assessment statistics are generated, such as the total read count, the
PCR redundancy rate, and the number of mappable reads with GEMcodes. The read
count is the reported after each filtering step: number of uniquely mapped R1 reads,
reads with mapping score ≥ 30, and reads with lengthbioRxiv preprint first posted online Apr. 18, 2019; doi: http://dx.doi.org/10.1101/613034. The copyright holder for this preprint
(which was not peer-reviewed) is the author/funder, who has granted bioRxiv a license to display the preprint in perpetuity.
All rights reserved. No reuse allowed without permission.
read length, fragment lengths, read count per fragment, neighboring-fragment distances,
and the fragment number per GEM (see Supplementary Methods).
Data visualization
To visualize multiplex chromatin interaction complexes in a genome browser-based
view, we developed a linear multi-fragment view tool, called ChIA-View, which displays
the chromatin fragments in either a clustering heatmap view, or a multi-fragment linear
alignment view. In a standard ChIA-View, along the y-axis, GEMs are arranged by
similarity, which is computed via hierarchical clustering (using the R package pheatmap
(v1.0.10) with “clustering_distance_rows” = “euclidean” and “clustering_method” =
“complete” in default). ChIA-View also includes variant modes: PE ChIA-View for
annotating promoter and non-promoter fragments, and Gene body ChIA-View for sorting
GEMs to demonstrate RNAPII extrusion model.
ChIA-View for unenriched data: “Cluster” mode and “Fragment” mode
The input file for a standard ChIA-View is a REGION file, which is a per-line-per-
fragment data from the ChIA-DropBox processing pipeline. The ChIA-View workflow is
performed as follows. First, all fragments within a given genomic coordinate are selected
by bedtools (v2.27.1). Second, GEMcodes specific fragments are assigned to 100 bins
per GEM in default (or a fix length bin), constructed a Boolean matrix (per row per GEM,
and per column per bin). Continuously, the Boolean matrix’s GEM order (row order) was
determined by hierarchical clustering, and plot out by R package pheatmap (v1.0.10) in
clustering heatmap views. Finally, the original GEMs were plotted according to alignment
order achieved from the hierarchical clustering function. In the resulting visualization, the
entire GEM span is indicated with a thin line, and the individual fragments are displayed
with thick lines (linear alignment views of ChIA-View). Each row is a GEM and the
GEMs are displayed in assorted colors. The linear alignment view of ChIA-View is
performed using R (v3.5.1) with mainly ggplot2 (v2_3.0.0).
Other R packages used in ChIA-View include: pheatmap (v1.0.10), ggplot2
(v3.0.0), dplyr (v0.7.6), bedr (v1.0.4), ggforce (v0.1.3), cowplot (v0.9.3), gtable (v0.2.0),
gridExtra (v2.3), reshape2 (v1.4.3), RColorBrewer (v1.1-2), ggrepel (v0.8.0), and ggpubr
(v0.1.7).
12bioRxiv preprint first posted online Apr. 18, 2019; doi: http://dx.doi.org/10.1101/613034. The copyright holder for this preprint
(which was not peer-reviewed) is the author/funder, who has granted bioRxiv a license to display the preprint in perpetuity.
All rights reserved. No reuse allowed without permission.
ChIA-View for enriched data: “Promoter” mode and “Gene body” mode
For a RNAPII ChIA-Drop data, we are interested in interplay among regulatory elements
such as promoters and enhancers. Thus, we annotate each fragment as a promoter
fragment if its coordinates overlap with a gene promoter region (TSS ± 250 bp); all other
fragments are denoted as non-promoters. Fragments are color-coded by this
classification.
The Gene body ChIA-View starts from a promoter annotated REGION file used
for Promoter ChIA-View, and zooms into a particular gene. Then sorting GEMs order by
a self-defined method and plot out, instead of hierarchical clustering in standard ChIA-
View. This sorting method selects GEMs that owning fragments within the promoter
region of the selected gene, then sorting Gems by their local GEM coverage from short
to long.
Code availability
The ChIA-DropBox data processing pipeline is publicly available at:
https://github.com/TheJacksonLaboratory/ChIA-DropBox.git. The ChIA-view visualization
tool for multiplex interactions is publicly available at:
https://github.com/TheJacksonLaboratory/ChIA-view.git. Both repositories contain
README files with further details on how to get started using the software.
Data availability
The ChIA-Drop and RNAPII ChIA-Drop data showcased in this paper were publicly
released previously (raw sequencing FASTQ files; processed data files of aligned reads
with parsed barcodes; and final files of chromatin interaction complexes) via the Gene
Expression Omnibus under SuperSeries accession number: GSE109355.
References
1 Lieberman-Aiden, E. et al. Comprehensive mapping of long-range interactions
reveals folding principles of the human genome. Science 326, 289-293 (2009).
2 Fullwood, M. J. et al. An oestrogen-receptor-alpha-bound human chromatin
interactome. Nature 462, 58-64 (2009).
13bioRxiv preprint first posted online Apr. 18, 2019; doi: http://dx.doi.org/10.1101/613034. The copyright holder for this preprint
(which was not peer-reviewed) is the author/funder, who has granted bioRxiv a license to display the preprint in perpetuity.
All rights reserved. No reuse allowed without permission.
3 Beagrie, R. A. et al. Complex multi-enhancer contacts captured by genome
architecture mapping. Nature 543, 519-524 (2017).
4 Quinodoz, S. A. et al. Higher-Order Inter-chromosomal Hubs Shape 3D Genome
Organization in the Nucleus. Cell 174, 744-757 (2018).
5 Zheng, M. et al. Multiplex chromatin interactions with single-molecule precision.
Nature 566, 558-562 (2019).
6 Cremer, T. & Cremer, M. Chromosome territories. Cold Spring Harbor
perspectives in biology 2 (2010).
7 Durand, N. C. et al. Juicebox Provides a Visualization System for Hi-C Contact
Maps with Unlimited Zoom. Cell systems 3, 99-101 (2016).
8 Daniel C. et al. ChIA-PIPE: A fully automated pipeline for ChIA-PET data
analysis and visualization. bioRxiv, doi:https://doi.org/10.1101/506683 (2018).
9 Durand, N. C. et al. Juicer Provides a One-Click System for Analyzing Loop-
Resolution Hi-C Experiments. Cell systems 3, 95-98(2016).
10 Robinson, J. T. et al. Juicebox.js Provides a Cloud-Based Visualization System
for Hi-C Data. Cell systems 6, 256-258 (2018).
11 Bintu, B. et al. Super-resolution chromatin tracing reveals domains and
cooperative interactions in single cells. Science 362 (2018).
12 Zhao, Z. W. et al. Spatial organization of RNA polymerase II inside a mammalian
cell nucleus revealed by reflected light-sheet superresolution microscopy.
Proceedings of the National Academy of Sciences of the United States of
America 111, 681-686 (2014).
13 Dale, R. K., Pedersen, B. S. & Quinlan, A. R. Pybedtools: a flexible Python library
for manipulating genomic datasets and annotations. Bioinformatics 27, 3423-
3424 (2011).
14bioRxiv preprint first posted online Apr. 18, 2019; doi: http://dx.doi.org/10.1101/613034. The copyright holder for this preprint
(which was not peer-reviewed) is the author/funder, who has granted bioRxiv a license to display the preprint in perpetuity.
All rights reserved. No reuse allowed without permission.
Figure 1: ChIA-Drop protocol and ChIA-DropBox computational pipeline.
(a) Schematic of the ChIA-Drop experimental protocol. A dual-cross-linked and
fragmented sample of chromatin complexes is loaded directly into the 10X Genomics
microfluidic device. The sample can be protein enriched (immunoprecipitated) or
unenriched. In the microfluidics device, chromatin complexes are partitioned into gel-
bead-in-emulsion (GEM) droplets for barcoding and linear amplification. Then the
barcoded amplicons are pooled for standard high-throughput sequencing. (b) Schematic
of the ChIA-DropBox computational pipeline. First, the 10X Genomics Chromium
software suite is applied to align reads to the reference genome and to identify the GEM
barcode of each read. ChIA-DropBox then groups uniquely mapped reads with the same
barcode to reconstruct the GEMs. Within each GEM, reads that overlap in their linear
genomic alignments within 3Kb are merged into chromatin fragments (considered with
the fragment size from library preparation). Finally, considering the concept of
chromosome territories, the GEMs are refined into purely intra-chromosomal putative
chromatin complexes. (c) ChIA-DropBox enables high-resolution data visualization via
several approaches. First, ChIA-DropBox converts the data to pairwise format and
generates input files for existing visualization tools: 2D contact map views via Juicebox
and loop views via BASIC Browser or other genome browsers. Importantly, ChIA-
DropBox also introduces its own custom visualization tool specifically for viewing
multiplex chromatin complexes, called the “ChIA-View”, which includes a cluster view
and a fragment view, implemented by R Shiny.
15bioRxiv preprint first posted online Apr. 18, 2019; doi: http://dx.doi.org/10.1101/613034. The copyright holder for this preprint
(which was not peer-reviewed) is the author/funder, who has granted bioRxiv a license to display the preprint in perpetuity.
All rights reserved. No reuse allowed without permission.
Figure 2. ChIA-DropBox automates quality assessment.
(a) Quality-assessment (QA) plots for the raw sequencing library. For a negative control
library of empty droplets (no chromatin material), the read length distribution has a peak
at 20 bp, reflecting only the reads of DNA oligos and absence of chromatin DNA
templates. For a positive control library of pure DNA fragments, the read length
distribution has a peak around 130 bp, reflecting the full sequencing read-length (1X150
bp, minus library linker 20 bp) of pure DNA templates in all droplets. For a real ChIA-
Drop library, the read length distribution has a peak at 20 bp (reflecting some empty
droplets) and a peak around 130 bp (reflecting some droplets with chromatin templates).
(b) QA plots of the distributions of various distance summaries of the putative chromatin
complexes, as a function of the fragment number (FN) of the complex (color scale). The
first row depicts the distribution of the spans of the chromatin complexes. The second
row depicts the distribution of fragment-to-fragment (“F2F”) distances. The third row
depicts the distribution of pairwise contact “loop” distances. Example QA plots are
shown for three types of libraries. The first column is a control sample of pure-DNA
fragments (no chromatin complexes). The second column is a ChIA-Drop sample. The
third column is an RNAPII-enriched (immunoprecipitated) ChIA-Drop sample.
16bioRxiv preprint first posted online Apr. 18, 2019; doi: http://dx.doi.org/10.1101/613034. The copyright holder for this preprint
(which was not peer-reviewed) is the author/funder, who has granted bioRxiv a license to display the preprint in perpetuity.
All rights reserved. No reuse allowed without permission.
Figure 3: ChIA-DropBox reconstructs and refines putative chromatin complexes.
(a) After attaining uniquely mapped reads and grouping together reads with the
same barcode to reconstruct GEMs, ChIA-DropBox then has a comprehensive
workflow for refining the GEMs into putative chromatin complexes. First, within
each GEM, reads that overlap within 3 Kb in linear genomic alignment are
merged into “chromatin fragments”. Second, GEMs are classified as multi-
fragment GEMs or singleton GEMs. Based on the concept of chromosome
territories, the multi-fragment GEMs are then refined to generate purely intra-
chromosomal “putative chromatin complexes”. (b) Example breakdown of the
results of applying the ChIA-DropBox workflow to a ChIA-Drop library. The
schematic at the top illustrates the types of input GEMs for calling complexes: the
colored circles indicate the chromosome of origin, and the number of fragments
indicate singleton or multiple fragments (horizontal line or a cross). S: singleton;
MS: multiple singletons; C: complex; CS: complex and singleton; MC: multiple
complexes; MCS: multiple complexes and singleton(s). Below each category, the
number of instances observed in the example library of Drosophila S2 cells is
indicated. Also indicated are the total number of input GEMs, and the final
number of putative complexes. (c) Cumulative distributions of the fragment
number per GEM or per putative complex. There are many singleton GEMs and
some high-fragment-number (inter-chromosomal) GEMs. In contrast, putative
complexes predominantly contain between two and six fragments.
17bioRxiv preprint first posted online Apr. 18, 2019; doi: http://dx.doi.org/10.1101/613034. The copyright holder for this preprint
(which was not peer-reviewed) is the author/funder, who has granted bioRxiv a license to display the preprint in perpetuity.
All rights reserved. No reuse allowed without permission.
Figure 4: ChIA-DropBox introduces a new browser for visualizing multiplex single-
molecule chromatin interactions.
18bioRxiv preprint first posted online Apr. 18, 2019; doi: http://dx.doi.org/10.1101/613034. The copyright holder for this preprint
(which was not peer-reviewed) is the author/funder, who has granted bioRxiv a license to display the preprint in perpetuity.
All rights reserved. No reuse allowed without permission.
Figure 4: ChIA-DropBox introduces a new browser for visualizing multiplex single-
molecule chromatin interactions.
(a) A flowchart of ChIA-View. First, the user enters the coordinates of a genomic region
of interest, and then GEMs mapping within this region are extracted. Once the “Local
GEMs” have been extracted, there are two paths for visualization. The first path (“1”) is
useful for visualizing unenriched ChIA-Drop data in topological domains, while the
second path (“2”) is useful for visualizing RNAPII-enriched ChIA-Drop data around
promoters. In path 1, the genomic region is binned, and then hierarchical clustering is
applied to arrange the GEMs by similarity along the y-axis (“Cluster view”). Once the
GEMs have been arranged, the original un-binned data can be viewed with the same y-
axis arrangement (“Fragment view”). In path 2, GEMs involving promoters are extracted
and the fragments in each GEM that overlap promoters are highlighted in a bright color
(“Promoter view”). Then, an individual gene within the region can be selected, and
GEMs involving that gene’s promoter are sorted by GEM span (“Gene body view”). (b)
An example of multiple visualization types for unenriched ChIA-Drop data in a 1.2 Mb
region in Drosophila S2 cells. First, Hi-C data, ChIP-seq data, and domain calls (TAD)
are displayed as a reference. Then, a 2D heat map view of ChIA-Drop data is shown.
Below that, a ChIA-View “Cluster view” of the same region is shown. Below that, a
magnified view of a single TAD is shown with ChIA-View “Fragment view”. (c) An
example of the ChIA-View “Promoter view” of RNAPII-enriched ChIA-Drop in a 141 Kb
window containing the gene Pde11 and MESR3. Gene annotations, RNA-seq data, and
pairwise ChIA-Drop loops are shown for reference. (d) The gene MESR3 is selected,
and a zoomed-in ChIA-View “Gene body view” is displayed.
19bioRxiv preprint first posted online Apr. 18, 2019; doi: http://dx.doi.org/10.1101/613034. The copyright holder for this preprint
(which was not peer-reviewed) is the author/funder, who has granted bioRxiv a license to display the preprint in perpetuity.
All rights reserved. No reuse allowed without permission.
Supplemental material for:
ChIA-DropBox: a novel analysis and visualization pipeline for multiplex chromatin
interactions
Simon Zhongyuan Tian1, Daniel Capurso1, Minji Kim1, Byoungkoo Lee1, Meizhen Zheng1, Yijun
Ruan1,2,3*
*email: yijun.ruan@jax.org
20bioRxiv preprint first posted online Apr. 18, 2019; doi: http://dx.doi.org/10.1101/613034. The copyright holder for this preprint
(which was not peer-reviewed) is the author/funder, who has granted bioRxiv a license to display the preprint in perpetuity.
All rights reserved. No reuse allowed without permission.
Supplementary Figures
Supplementary Figure 1: Detailed flowchart of ChIA-DropBox data processing.
21bioRxiv preprint first posted online Apr. 18, 2019; doi: http://dx.doi.org/10.1101/613034. The copyright holder for this preprint
(which was not peer-reviewed) is the author/funder, who has granted bioRxiv a license to display the preprint in perpetuity.
All rights reserved. No reuse allowed without permission.
Supplementary Figure 1: Detailed flowchart of ChIA-DropBox data processing.
A flowchart of the detailed steps in the ChIA-DropBox processing pipeline. Gray oval shapes
represent data files. Green: FASTQ files of sequencing reads are mapped to the reference
genome to generate a BAM file. The barcode is extracted from each sequencing read and then
prefixed to the read ID in the BAM file. Reads are filtered to retain high quality reads; the R1
read, which contains both the barcode and genomic sequence, is retained; and the read is
extended. Yellow: GEMs are reconstructed by grouping together reads with the same barcode.
Blue: GEMs are further refined. First, within each GEM, reads that have genomic alignments
within 3 Kb of each other are merged into “chromatin fragments”. A refinement procedure is
applied to obtain a set of multiplex and intra-chromosomal “putative chromatin complexes”. Red:
the putative chromatin complexes are output in multiple file formats to enable downstream
analysis and visualization. First, the data are converted to pairwise format and input files are
generated for viewing 2D heat maps in Juicebox and viewing loops in BASIC Browser. Then, an
input file is generated for viewing multiplex interactions in ChIA-View.
22bioRxiv preprint first posted online Apr. 18, 2019; doi: http://dx.doi.org/10.1101/613034. The copyright holder for this preprint
(which was not peer-reviewed) is the author/funder, who has granted bioRxiv a license to display the preprint in perpetuity.
All rights reserved. No reuse allowed without permission.
Supplementary Figure 2. ChIA-DropBox data formats and terminology.
Each intra-chromosomal GEM is given a unique identifier (ID), which also encodes information
about the GEM (e.g., the sequencing run, and the number of fragments in the GEM; see
Methods). Each GEM has an outer span from its leftmost fragment to its rightmost fragment,
and corresponding coordinates of the GEM-span. After a length extension, reads in the same
GEM located within 3Kb of each other are merged into “chromatin fragments”. Each fragment
has an ID, a read number, a length, and coordinates. The distances between fragments in a
GEM are considered in two ways. First, the distances between neighboring fragments are
considered (fragment-to-fragment, or “F2F”, distances). Second, the GEM is converted to
pairwise loops and the pairwise distances are considered.
23bioRxiv preprint first posted online Apr. 18, 2019; doi: http://dx.doi.org/10.1101/613034. The copyright holder for this preprint
(which was not peer-reviewed) is the author/funder, who has granted bioRxiv a license to display the preprint in perpetuity.
All rights reserved. No reuse allowed without permission.
chr3L: 21,800,000 - 23,000,000 (1.2 Mb)
ChIA-Drop
Juicebox
2D
heat maps RNAPII
ChIA-Drop
RNAPII
ChIA-Drop
BASIC
Browser
loops RNAPII
ChIA-PET
H3K27ac
ChIP-seq
RNA-seq
Supplementary Figure 3: ChIA-DropBox automatically converts the putative chromatin
complexes to pairwise format and generates input files for existing visualization tools.
After ChIA-DropBox reconstructs and refines the putative chromatin complexes, it then supports
existing visualization tools by automatically converting the data to pairwise format and
generating the appropriate file formats. A contact matrix is generated for viewing 2D heatmaps
in Juicebox. An input file is generated for performing loop calling via ChIA-PIPE and then
viewing the loops in BASIC Browser. Juicebox 2D heat maps of an unenriched ChIA-Drop
sample and an RNAPII-enriched ChIA-Drop sample in Drosophila S2 cells. In Drosophila, ChIA-
Drop signal is enriched in the transcriptionally inactive topological domains, while RNAPII-
enriched ChIA-Drop signal is enriched in the transcriptionally active gap regions between
domains. BASIC Browser views of RNAPII-enriched ChIA-Drop loops and RNAPII-enriched
ChIA-PET loops (both sets of loops called using ChIA-PIPE). BASIC Browser also displays a
ChIP-seq coverage track for an active histone mark and an RNA-seq track. Loops are enriched
in the gap regions between domains for both RNAPII-enriched ChIA-Drop and RNAPII-enriched
ChIA-PET.
24bioRxiv preprint first posted online Apr. 18, 2019; doi: http://dx.doi.org/10.1101/613034. The copyright holder for this preprint
(which was not peer-reviewed) is the author/funder, who has granted bioRxiv a license to display the preprint in perpetuity.
All rights reserved. No reuse allowed without permission.
a Cluster view
chr2L: 7,021,302 - 7,955,853
b Fragment view
chr2L: 7,021,302 - 7,955,853
Promoter view Gene body view
c chr2R: 18,331,373 - 18,495,793 d chr3L: 1,342,493 - 1,475,250
Supplementary Figure 4: ChIA-View is a new web-based R Shiny app for visualizing
multiplex chromatin interactions.
25bioRxiv preprint first posted online Apr. 18, 2019; doi: http://dx.doi.org/10.1101/613034. The copyright holder for this preprint
(which was not peer-reviewed) is the author/funder, who has granted bioRxiv a license to display the preprint in perpetuity.
All rights reserved. No reuse allowed without permission.
Supplementary Figure 4: ChIA-View is a new web-based R Shiny app for visualizing
multiplex chromatin interactions.
ChIA-View is an easy-to-use R shiny app for high-resolution visualization of single-molecule
multiplex chromatin interactions. ChIA-View facilitates biological interpretation through four
different display modes: (a) “Cluster view”, (b) “Fragment view”, (c) “Promoter view”, and (d)
“Gene body view”. In the ChIA-View browser, there is core control panel on the left side for
navigation. Using this control panel, the user can upload data (or select demo data pre-loaded
in the browser). Once a data set is selected, the user can then: select a display mode; enter the
coordinates of a genomic region of interest; filter GEMs by fragment number; refine properties of
the display (e.g., colors, line width, dimensions); and export the display to a high-resolution,
publication-quality image file. The “Cluster view” and the “Fragment view” are especially well
suited for unenriched ChIA-Drop data. The “Cluster view” displays binned chromatin complexes
over broad chromosomal regions, and the different complexes are arranged by similarity along
the y-axis via hierarchical clustering. The “Fragment view” retains the y-axis arrangement from
the “Cluster view”, but instead displays the original chromatin fragments. The “Promoter view”
and the “Gene body view” are particularly well suited for RNAPII-enriched ChIA-Drop data. The
“Promoter view” filters and retains chromatin complexes overlapping promoters, and then
highlights the promoter-involving fragments in a different color. The “Gene body” view displays
the chromatin complexes involving the promoter of a specified individual gene, which the
chromatin complexes arranged by span.
26bioRxiv preprint first posted online Apr. 18, 2019; doi: http://dx.doi.org/10.1101/613034. The copyright holder for this preprint
(which was not peer-reviewed) is the author/funder, who has granted bioRxiv a license to display the preprint in perpetuity.
All rights reserved. No reuse allowed without permission.
Supplementary Methods
The ChIA-DropBox pipeline includes two parts: data processing and data visualization. The
data-processing workflow includes four main categories: (1) read mapping and barcode
identification; (2) GEM reconstruction; (3) refinement of GEMs into putative chromatin
complexes; (4) generating various file formats to support downstream analysis and visualization;
and (5) quality assessment. The data-visualization workflow includes support for existing
visualization tools and introducing a new visualization tool. For existing visualization tools for
pairwise interaction data, ChIA-Dropbox generates a contact matrix for viewing 2D heat maps in
Juicebox and generates a file for performing loop calling via ChIA-PIPE, with subsequent
visualization of the loops in BASIC Browser. ChIA-DropBox also introduces a new browser,
named ChIA-View, specifically designed for visualizing single-molecule multiplex chromatin
interactions.
Read mapping
After the droplet-barcoded and pooled ChIA-Drop amplicons are sequenced on a standard
Illumina platform (e.g. Miseq, NextSeq 500, or HiSeq 4000), ChIA-DropBox begins data
processing by performing read mapping via the 10X Genomics Chromium software suite.
First, the 10X Genomics ‘longranger mkfastq’ (v2.1.4) command is used with default
parameters to convert the data set of barcoded reads to demultiplexed FASTQ files. Then, 10X
Genomics ‘longranger wgs’ (v2.1.5) is used in whole-genome mode to map reads to the
reference genome, with additional parameters specified as suitable for the computing
environment (e.g. “longranger wgs $LIB MCP.mro --jobmode=local --localcores=32 --
localmem=150gb”). It is important to set the correct information in the ‘MCP.mro’ file, and these
can be achieved using a utility script in ChIA-DropBox named ‘MCP.init.sh’. Specifically: (I)
‘sample_id’ is library name; (II) "gem_group" is the library specific digits code, which will appear
at the end of ‘BX’ tag of BAM files (e.g., in a ‘BX’ tag ‘BX:Z:AAACCCAAGAAGTGAG-10482’,
the ‘gem_group’ is ‘10482’); (III) "read_path" is the absolute path to the FASTQ directory; (IV)
"sample_names" is the prefix of FASTQ file names (e.g., for FASTQ file named
“SHG0048H2_GT18-08819_SI-GA-A2_S30_L007_R1_001.fastq.gz”, the “sample_names” is
“SHG0048H2_GT18-08819_SI-GA-A2”); (V) ‘sex’ should be set to ‘m’ (male) or ‘f ’(female)
according to the cell line; and (VI) ‘reference_path’ is the absolute path to the reference genome
file, which could be downloaded from 10X Genomics website, or generated using the
‘longranger mkref’ command.
27You can also read


