Suitable Pattern of the Natural Environment of Human Settlements in the Lower Reaches of the Yangtze River - MDPI
←
→
Page content transcription
If your browser does not render page correctly, please read the page content below
atmosphere
Article
Suitable Pattern of the Natural Environment of
Human Settlements in the Lower Reaches of the
Yangtze River
Fan Song , Xiaohua Yang * and Feifei Wu
 State Key Laboratory of Water Environment Simulation, School of Environment, Beijing Normal University,
 Beijing 100875, China; 201621180014@mail.bnu.edu.cn (F.S.); wufeifei_bnu@163.com (F.W.)
 * Correspondence: xiaohuayang@bnu.edu.cn; Tel.: +86-010-5880-6050

 Received: 27 February 2019; Accepted: 9 April 2019; Published: 12 April 2019

 Abstract: The human settlement environment is the object on which human survival depends.
 In this study, six single factor suitability models and a comprehensive index model of the human
 settlement natural environment were established. The six single factor models included topography,
 hydrology, vegetation, soil, temperature and humidity, and land surface temperature. This study took
 1 km × 1 km as the pixel size and relied on the ArcGIS platform to systematically and quantitatively
 evaluate the human settlement environment of the lower reaches of the Yangtze river. The results
 show that: (1) From the evaluation results of single natural elements, the topography of the study
 area is relatively flat, with a small number of hydraulic erosion areas. Besides, there are significant
 differences between the north and the south in temperature and humidity, hydrology, vegetation,
 and land surface temperature. (2) In 2015, the most suitable areas of human settlement environment
 were mainly distributed in the plains along the Yangtze river, the plain of northern Zhejiang, and
 the Poyang plain. The most unsuitable areas are mainly distributed in mountainous areas, such as
 the mountain area of southern Zhejiang and Dabie mountain area. Topography and vegetation are
 the dominant factors for classification. (3) From the perspective of space, the score of the human
 settlement natural environment in Shanghai is above the average, and the best among the other
 provinces is Jiangsu province, while Zhejiang, Jiangxi, and Anhui provinces have little difference.
 From the perspective of time, the overall level of the suitability in the lower reaches of the Yangtze
 river has been improved from 2005 to 2015, mainly due to the influence of temperature and humidity
 index and water resource index.

 Keywords: human settlement suitability; human settlement natural environment index; GIS; lower
 reaches of Yangtze River

1. Introduction
      The human settlement environment is the place where people work, live, and play. It is also the
dependent object of human survival and the main transformation object of human activities [1]. The
quality of the human settlement environment not only directly affects the residents’ living experience,
but also indirectly affects the economic and social progress of a region. The earliest research on
the human settlement environment was in 1958, when the Greek scholar Doxiadis established the
science of human settlement and conducted a lot of basic research on the problems of the human
settlement environment [2]. The second Habitat Conference of United Nations in the 1990s put
forward the “Habitat Agenda”; there were two important issues: “comfortable housing for everyone”
and “sustainable development of human settlements in the process of urbanization”. This indicated
that sustainable human settlements should be established in a human living environment so that

Atmosphere 2019, 10, 200; doi:10.3390/atmos10040200                             www.mdpi.com/journal/atmosphere
Atmosphere 2019, 10, 200                                                                           2 of 15

human beings can enjoy a harmonious, healthy, and fulfilling life with nature. In the 21st century, the
concept of sustainable development has become the guiding ideology of the research on the human
settlement environment. In recent years, many international scholars have done a lot of research on
the sustainable development of a human settlement environment from multiple perspectives. For
example, Muhammad Rusdi et al. [3] assessed the land suitability of the Banda Aceh, Indonesia region
10 years after the tsunami. The study was conducted primarily from the perspective of soil permeability,
topography, and geology, so as to determine the level of suitability of the area for human habitat. Safa
Mazahreh et al. [4] made a land suitability map in Jordan through an approach that integrated soil and
climatic data. The analyses not only identified key factors limiting land use but also provided the type
of land use for which the region was suitable. Walter Musakwa [5] and Ingrida Bagdanavičiūtė [6],
respectively, established evaluation standards from the perspectives of nature-society and pollution
sources, and then selected the most suitable areas for human settlement in their respective study areas,
so as to provide a basis for land reform and creation of smart cities. Although their researches have
their own emphases, they all make great contributions to the study of human settlement.
      In China, the research on the human settlement environment started in the 1990s. Tsinghua
University established the research center for human settlements in 1995. Professor Wu Liang-yong
classified the human settlement environment system into five systems: natural system, human system,
social system, residential system, and supporting system [7,8]. Around these five systems, scholars
in different fields have conducted a lot of studies from different perspectives. Scholars in the field of
architecture are more focused on the study of the residential system and support system, among the
five major systems, while sociologists are more concerned with human systems and social systems [9],
and environmental and ecologists are more inclined to study natural systems. There are also some
scholars who study complex systems [10]. A review article by MA Ren-feng gave a detailed description
of the history and current situation of research on the human settlement environment in China [11],
and the evaluation method of human settlement natural environment suitability, introduced in the
article, is also the main idea of this paper.
      In addition to the system divisions described above, the research on the human settlement
environment can also be divided from the spatial scale, which can be divided into five scales
including global, regional, urban, community, and architecture [12]. Numerous classifications have
also generated numerous research methods. Currently, the commonly used method is analysis in
Geographic Information System. At the same time, many mathematical methods such as fuzzy
comprehensive evaluation [13], factor analysis [14], and genetic algorithm [15] have been applied
in this field. With the development and maturity of Geographic Information System and Remote
Sensing technology, it is possible to show the advantages and disadvantages of the human settlement
environment with pictures and texts. The joint analysis of GIS tool and other methods is also
gradually developed [16], which is of great significance to the research on the human settlement
environment suitability.
      Natural system is the basic system of the human settlement environment, which directly relates to
human health and body surface feeling, and indirectly constitutes the construction foundation of other
systems. Among the numerous natural factors, this study selects some basic elements that are most
closely related to human survival and life, including six natural elements: topography, hydrology,
vegetation, soil, temperature and humidity, and land surface temperature. On the basis of the study of
each individual element, the model of the human settlement natural environment index (HNEI) is
established, and different weights are assigned to each element according to the actual situation of the
research area. The lower reaches of the Yangtze river are one of the most developed regions in China.
During a long period of economic development, a series of resource and environmental problems
have emerged. The purpose of this study is as follows: 1. To reveal the spatial pattern of the human
settlement natural environment suitability of five provinces in the lower reaches of the Yangtze river;
2. to explore the advantage and restriction of the human settlement environment in this region, so as to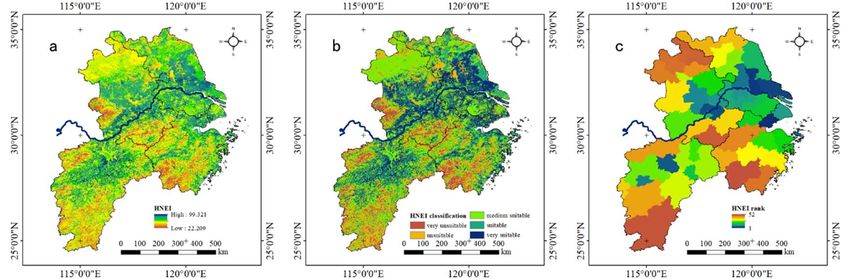
Atmosphere 2019, 10, x FOR PEER REVIEW                                                                3 of 15

   natural2019,
Atmosphere  environment
                10, 200   suitability of five provinces in the lower reaches of the Yangtze river; 32.of 15
   to explore the advantage and restriction of the human settlement environment in this region,
   so as to provide the corresponding research basis and decision-making support for local
provide  the corresponding
   population                research
               spatial planning        basisfunction
                                 and land     and decision-making
                                                     planning.     support for local population spatial
planning and land function planning.
    2. Study Area
2. Study Area
         The study area covered the lower reaches of the Yangtze river, including five provincial-
      The study area covered the lower reaches of the Yangtze river, including five provincial-level
    level administrative regions of Jiangxi, Anhui, Jiangsu, Zhejiang and Shanghai, with a total of
administrative regions of Jiangxi, Anhui, Jiangsu, Zhejiang and Shanghai, with a total of
    51 prefecture-level cities and one municipality directly under the central government. The
51 prefecture-level cities and one municipality directly under the central government. The region
    region is located in longitude E113°34'–E123°25' and latitude N24°29'–N35°20'. The total area is
is located in longitude    E113◦ 340 –E123◦ 250 and latitude N24◦ 290 –N35◦ 200 . The total area is about
    about 526,080 km . The location of the study area is shown in Figure 1. At the end of 2016, the
                       2
526,080 km2 . The location of the study area is shown in Figure 1. At the end of 2016, the permanent
    permanent resident population of the five provinces was about 267.82 million, accounting for
resident population of the five provinces was about 267.82 million, accounting for 19.37% of the total
    19.37% of the total population of China, with a high population density. Most of the region is
population of China, with a high population density. Most of the region is located in the economic
    located in the economic radiation zone of the urban agglomeration of the Yangtze river delta.
radiation zone of the urban agglomeration of the Yangtze river delta. Relying on the excellent
    Relying on the excellent geographical advantages and economic foundation, the study area has
geographical advantages and economic foundation, the study area has become the region with the
    become the region with the highest urbanization level and the most developed economy in
highest urbanization level and the most developed economy in China. Most of the region belongs to
    China. Most of the region belongs to the subtropical monsoon climate zone, with obvious
the subtropical monsoon climate zone, with obvious monsoon characteristics. In the process of rapid
    monsoon characteristics. In the process of rapid urbanization in this region, a lot of resources
urbanization in this region, a lot of resources and environmental problems have been caused, resulting
    and environmental problems have been caused, resulting in great changes in the natural
in great changes in the natural environment. In this study, the grid of 1 × 1 km was taken as the basic
    environment. In this study, the grid of 1 × 1 km was taken as the basic unit, which can satisfy
unit, which can satisfy the analysis of different spatial scales, so as to make an appropriate evaluation
    the analysis of different spatial scales, so as to make an appropriate evaluation of the natural
of the natural suitability of human settlement.
    suitability of human settlement.

                                        Figure 1. Location of study area.
                                        Figure 1. Location of study area.
3. Materials and Methods
   3. Materials and Methods
3.1. Data Sources
   3.1. Data Sources
      The six indexes selected in this study were: relief degree of land surface (RDLS), water resource
         The six
index (WRI),      indexes
               land         selected
                    cover index      in soil
                                  (LCI), thissuitability
                                              study were:    relief
                                                         index      degree
                                                                (SSI),        of land surface (RDLS),
                                                                       temperature–humidity               waterand
                                                                                                  index (THI),
   resource
land          index (WRI),index
      surface temperature      land(LSTI).
                                      coverTheindex
                                                  data(LCI),  soil
                                                       used for     suitability
                                                                 calculation      index (SSI),
                                                                               included:  digitaltemperature–
                                                                                                   elevation model
   humidity
data,         index
       land use  data,(THI), and
                        annual    land surfacespatial
                                precipitation    temperature   index (LSTI).
                                                       interpolation            The data used
                                                                        data, normalized         for calculation
                                                                                             difference  vegetation
   included:  digital  elevation  model   data, land  use data,  annual    precipitation spatial  interpolation
index data [17], soil erosion spatial distribution data [18], annual data for natural indicators of weather
   data, normalized
stations, and MODIS difference      vegetation
                         land surface  temperatureindex  data
                                                      data. The[17],
                                                                  datasoil  erosion
                                                                        types,  year spatial
                                                                                     of data,distribution   data are
                                                                                              and data source
   [18],inannual
shown              data
           the Table   1. for natural indicators of weather stations, and MODIS land surface
   temperature data. The data types, year of data, and data source are shown in the Table 1.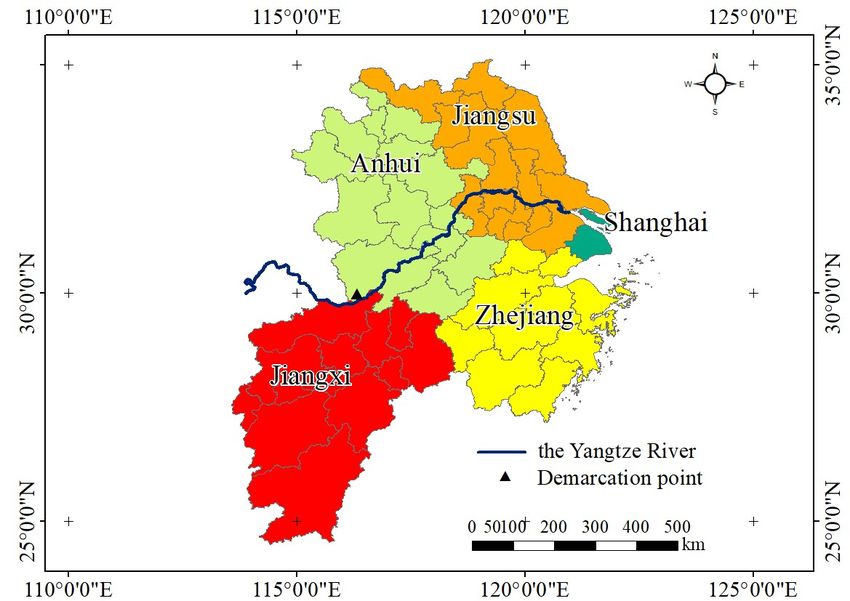
Atmosphere 2019, 10, 200                                                                                                                                      4 of 15

                                                                      Table 1. Details of the data.

         The Name of the Data                     Data Types                Year of Data                    Data Source
                                                                                                            The resource and environmental data cloud
         Digital elevation model data             Raster data, 90 × 90 m    2015                            platform of the Chinese academy of sciences
                                                                                                            (http://www.resdc.cn/)
                                                                                                            The resource and environmental data cloud
         Land use data                            Raster data, 1 × 1 km     2005,2010,2015                  platform of the Chinese academy of sciences
                                                                                                            (http://www.resdc.cn/)
                                                                                                            The resource and environmental data cloud
         Annual precipitation spatial
                                                  Raster data, 1 × 1 km     2004–2006,2009–2011,2014–2016   platform of the Chinese academy of sciences
         interpolation data
                                                                                                            (http://www.resdc.cn/)
                                                                                                            The resource and environmental data cloud
         Normalized difference vegetation
                                                  Raster data, 1 × 1 km     2005,2010,2015                  platform of the Chinese academy of sciences
         index data
                                                                                                            (http://www.resdc.cn/)
                                                                                                            The resource and environmental data cloud
         Soil erosion spatial distribution data   Raster data, 1 × 1 km     2015                            platform of the Chinese academy of sciences
                                                                                                            (http://www.resdc.cn/)
         Annual data for natural indicators of                                                              Chinese academy of sciences
                                                  Point data                2004–2006,2009–2011,2014–2016
         weather stations                                                                                   (http://www.resdc.cn/)
                                                                                                            United States Atmosphere Archive & Distribution
         MODIS land surface temperature data      Raster data, 1 × 1 km     2005,2010,2015                  System, Distributed Active Archive Center
                                                                                                            (https://ladsweb.modaps.eosdis.nasa.gov/).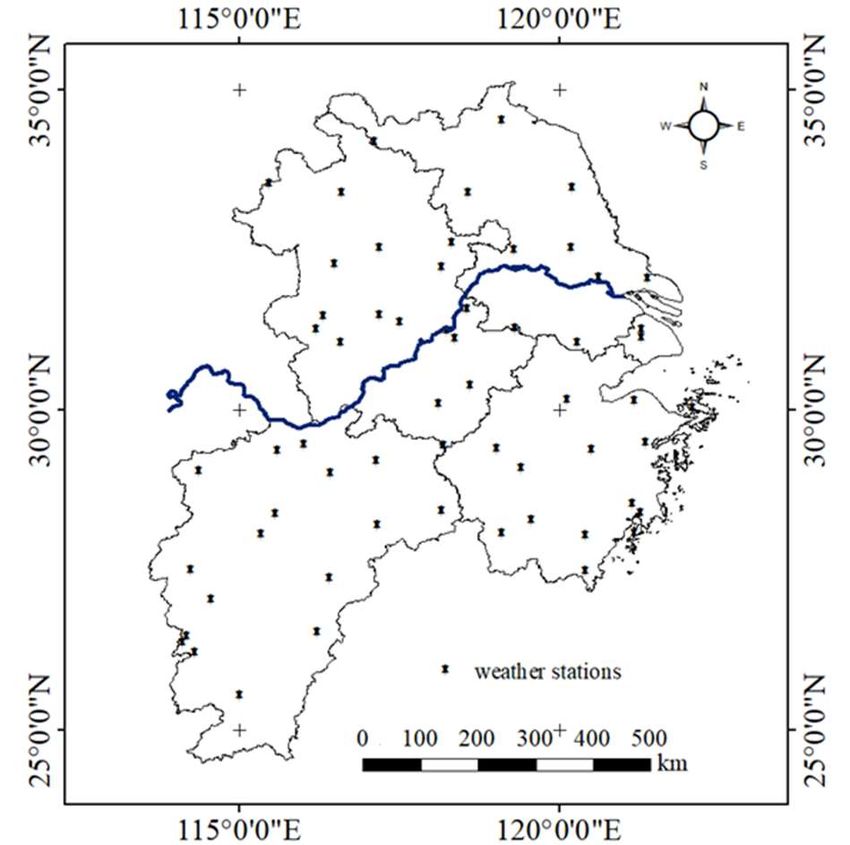
Atmosphere 2019, 10, 200                                                                                5 of 15

3.2. Methods of Single Factor Model

3.2.1. Relief Degree of Land Surface
     Relief degree of land surface refers to the difference between the highest and lowest elevations in
an area. It reflects the macroscopic changes of the region’s terrain, which is of great reference value for
the site selection of human settlements [19]. The key to calculate RDLS is to determine the size of the
reference area, which can well express the topographic characteristics of the study area. Referring to
the research results of Feng Zhi-ming [20], Wang Yong-li [21], and other scholars, the formula of RDLS
established in this paper is as follows:

                       RDLS = ALT/1000 + [max(H) − min(H)] × [1 − P(A)/A] /500                             (1)

where, ALT refers to the average altitude within the selected reference area; Max(H) and min(H) refer
to the highest and lowest elevations within the reference area; P(A) refers to the flat area within the
reference area, whose slope is less than 5◦ ; A refers to the total area of the reference area; and 500 refers
to China’s benchmark mountain height.
     The neighborhood analysis method based on raster data was used to calculate the size of the
reference area [22]. The neighborhood analysis tool of ArcGIS was used to analyze the altitude
difference within the grid, from 3 × 3 pixels to 69 × 69 pixels. According to the calculation results, the
scatter diagram of the corresponding relationship between the grid size and the altitude difference
was established, and the logarithmic function of the curve equation was determined. The size of the
reference area grid can be determined according to the change of curve growth rate. In this study, the
determined optimal grid size was 19 × 19 (2.92 km2 ). According to Formula (1), the RDLS of the lower
reaches of the Yangtze river can be obtained. The result in 2015 is shown in Figure 3a.

3.2.2. Water Resource Index
     Water is the source of life, and the basic need of human settlement construction and development.
Although the lower reaches of the Yangtze river are relatively rich in water resources, they are unevenly
distributed. In order to express this difference, referred to the environmental assessment standards
of the ministry of environmental protection of the People’s Republic of China, and relevant research
results [23,24], we selected two indexes of “rainfall” and “distance from water source” to build the
water resource index model. The formula of WRI is as follows:

                                              WRI = αP + βD                                                (2)

where P is the normalized rainfall; D is the normalized distance from the water source; A and B are
the weights of two factors, which are respectively 0.8 and 0.2 in this study. In order to reduce the
contingency of data, the average rainfall in 2004–2006, 2009–2011, and 2014–2016 was used as the
values in 2005, 2010, and 2015, respectively. The required water source location was obtained by
extracting the “water area” type in the land use data and the “Euclidean Distance” in ArcGIS was used
to calculate the “distance from water source”. In this paper, the distance within 10 km from the water
source was calculated and reversely normalized, and the value of the remaining areas was assigned to
zero. The calculation result in 2015 is shown in Figure 3b.

3.2.3. Land Cover Index
     Land is an important material for human survival and development. Land coverage and utilization
not only affect the stability of natural ecosystem, but also continuously affect the development of social
economy [25]. In recent years, with the rapid development of urbanization, inappropriate land use has
become more and more serious. Inappropriate land use has become a problem of universal concern,
among which vegetation cover has been a hot topic. Vegetation is an important intermediate link
Atmosphere 2019, 10, 200 6 of 15
connecting the atmospheric environment, soil environment, and water environment, which can regulate
the climate and have a significant impact on the human settlement environment [26]. In this paper,
the land cover index model was constructed by referring to the ecological environment evaluation
standard of the State Environmental Protection Administration [27] and previous research results [24]:
LCI = LTi × NDVI (3)
where, LTi refers to the weight of each land use type, and NDVI refers to the normalized difference
vegetation index.
According to the research purpose, relevant literatures [28,29] and technical specifications, weight
was assigned to each land use type, and the results are shown in Table 2. Then, the land cover index
can be obtained according to Formula (3). The calculation result in 2015 is shown in Figure 3c.
Table 2. Weight of each land use type.
Land-Use Type Weight Classification Weight
Arable land 0.25 Paddy field 0.65
Dry field 0.35
Woodland 0.18 Forest land 0.34
Shrub land 0.26
Sparse wood 0.2
Other woodland 0.2
Grass land 0.15 Grassland with high coverage 0.4
Grassland with moderate coverage 0.33
Grassland with low coverage 0.27
Water area 0.17 Canal 0.31
Lake 0.29
Reservoir and pit-pond 0.2
Mudflat 0.1
Bottomland 0.1
Construction land 0.2 Urban and town land 0.44
Village land 0.35
Other construction land 0.21
Unused land 0.05 Wetland 0.48
Bare land 0.28
Bare rock 0.24
3.2.4. Soil Suitability Index
Soil erosion is a serious environmental problem, which not only damages land resources and
affects normal industrial and agricultural behaviors, but also may aggravate drought and waterlogging.
It is one of the important evaluation indexes of the human settlement environment [30]. China is one of
the countries with serious soil erosion, which has affected the economic and social development. It can
be known from the existing studies that soil erosion exists in some areas of the study area, especially in
Jiangxi province [31,32]. Therefore, soil erosion was taken as an evaluation index in this study. We
used soil erosion data for reclassification to obtain soil suitability index of five provinces in the lower
reaches of the Yangtze river, as shown in Figure 3d.
3.2.5. Temperature–Humidity Index
Among the many climatic elements, air temperature directly affects the exchange of heat and
water between human body and the outside world, so the air temperature directly affects the comfort
degree of human body. Due to the difference in humidity between the north and the south, there
will be a difference in apparent temperature [33]. Therefore, this study adopted the widely used
temperature–humidity index (THI) to express this effect [34,35], so as to reflect the temperatureAtmosphere 2019, 10, 200 7 of 15
suitability through
Atmosphere 2019, thePEER
10, x FOR comprehensive
REVIEW effect of temperature and humidity. The calculation formula is
7 of 15
as follows:
THI = T − 0.55(1 − f )(T − 58)
1.8t
THIT = T +0.55(1
32 f )(T 58) (4)
(4)
T=1.8t+32
where t is Celsius, T is Fahrenheit, and f is relative humidity. In order to reduce the contingency of
Where
data, thet is Celsius,
average T is Fahrenheit,
temperature and f is
and relative relative data
humidity humidity. In order2009–2011,
in 2004–2006, to reduce and
the contingency
2014–2016 was of
data, as
used thethe
average
values temperature
in 2005, 2010,and
andrelative humidity data
2015, respectively. in 2004–2006,
Firstly, the location2009–2011,
of weatherand 2014–2016
stations in the
was used
study areaas thethe
and values in 2005, 2010,
corresponding and 2015,and
temperature respectively.
humidity Firstly, the location
information of weather
were input stations
in ArcGIS. The
in the study area and the corresponding temperature and humidity information
locations of weather stations are shown in Figure 2. After data processing, the kriging interpolating were input in
ArcGIS.was
model Theused
locations of weather
to carry stations
out spatial are shown processing
interpolation in Figure 2.in After
fivedata processing,
provinces, and the
the kriging
spatial
interpolatingdata
distribution model was used
of various to carry
climatic out spatial
elements interpolation
were obtained. We processing in five
mainly used theprovinces, and the
“Spatial Analyst
spatial distribution data of various
tools-interpolation-Kriging” functionclimatic elements
in ArcGIS. were
Finally, obtained.
according We mainly
to Formula (4), used the result
the 2015 "Spatial
is
Analystintools-interpolation-Kriging"
shown Figure 3e. function in ArcGIS. Finally, according to formula (4), the 2015
result is shown in Figure 3e.
Figure 2.
Figure 2. Locations
Locations of
of weather stations.
weather stations.
3.2.6. Land
3.2.6. Land Surface
Surface Temperature Index
Temperature Index
The rapid
The rapiddevelopment
development of urbanization
of urbanization has changed
has changed the urban the climate,
urban and climate,
one of and
the one of the
remarkable
remarkable characteristics is the urban heat island effect. On the one hand, the urban heat island
characteristics is the urban heat island effect. On the one hand, the urban heat island effect directly
effect directly
affects the energy affects the energy
utilization, utilization,
hydrological hydrologicaland
environment, environment,
air quality. Onandthe airother
quality. Onthe
hand, theurban
other
hand,island
heat the urban
effect heat island effect
also indirectly alsothe
affects indirectly
quality affects
of urban the quality
living of urban living
environment and theenvironment
health status and
of
the health status of residents [36]. Land surface temperature is a key parameter of urban surface
residents [36]. Land surface temperature is a key parameter of urban surface energy balance and a
energy balance and a very important parameter for monitoring urban heat island effect.
very important parameter for monitoring urban heat island effect.
The classification
The classificationmethodmethodofofland landsurface
surfacetemperature
temperature waswas to to segment
segment thethe temperature
temperature density
density on
on the basis of the original land surface temperature data [37]. The surface temperature in the region
the basis of the original land surface temperature data [37]. The surface temperature in the region was
was divided
divided into into
five five grades,
grades, which which
were: were:lowlow temperature
temperature < T
(T > Tmean + 1.5Tstd). mean
T Where+ 1.5T
Tmean
stdis
).
the average
Where Tmean value
is the of land surface
average value oftemperature
land surfaceand Tstd is theand
temperature standard
Tstd is deviation
the standard of land surface
deviation of
temperature. The result of land surface temperature index in 2015 is shown in Figure 3f.
land surface temperature. The result of land surface temperature index in 2015 is shown in Figure 3f.
3.3. Methods of Human Settlement Natural Environment Model
3.3.1. Scoring Criteria
After the completion of the single factor evaluation, it is necessary to carry out the graph
superposition to complete the evaluation of human settlement natural environment. Therefore, eachAtmosphere 2019, 10, 200 8 of 15
3.3. Methods of Human Settlement Natural Environment Model
3.3.1. Scoring Criteria
After the completion of the single factor evaluation, it is necessary to carry out the graph
superposition to complete the evaluation of human settlement natural environment. Therefore, each
single factor model should be graded according to the actual situation of the study area and existing
studies [38]. The single factor evaluation results in 2015 were divided into five grades and assigned
with scoring values, as shown in Table 3.
Table 3. Scoring criteria of the single factors.
RDLS WRI LCI
I (90 grades) [−0.02, 0.15] (0.67, 0.96] (0.1209, 0.1495]
II (70 grades) (0.15, 0.44] (0.54, 0.67] (0.0807, 0.1209]
III (50 grades) (0.44, 1.03] (0.41, 0.54] (0.0562, 0.0807]
IV (30 grades) (1.03, 1.68] (0.25, 0.41] (0.0323, 0.0562]
V (10 grades) (1.68, 3.30] [0, 0.25] [−0.004, 0.0323]
SSI THI LSTI
I (90 grades) mired (61, 63] low temperature
II (70 grades) mild (59, 61], (63, 66] sub-low temperature
III (50 grades) moderate (57, 59] medium temperature
IV (30 grades) strong (55, 57] sub-high temperature
V (10 grades) very strong and violent [46, 55] high temperature
Note: RDLS refers to Relief Degree of Land Surface; WRI refers to Water Resource Index; LCI refers to Land Cover
Index; SSI refers to Soil Suitability Index; THI refers to Temperature–Humidity Index; LSTI refers to Land Surface
Temperature Index.
3.3.2. Establishment of Human Settlement Natural Environment Index
On the basis of single factor evaluation, a human settlement natural environment index (HNEI)
model was constructed to evaluate the natural suitability of human settlement in five provinces of the
lower reaches of the Yangtze river. The formula is as follows:
HNEI = αRDLS + βWRI + χLCI + δSSI + γTHI + εLSTI + 0.2GDPI (5)
where αβχδγε are the corresponding weights of each index respectively, which were obtained by
referring to existing studies [4,28,38] through the analytic hierarchy process. The results were as
follows: α = 0.2324, β = 0.0794, χ = 0.3579, δ = 0.0435, γ = 0.1697, ε = 0.1172.
0.2GDPI (Gross Domestic Product Index) is the economic correction coefficient. Since selected
natural indexes such as LCI and LSTI are affected largely by population distribution, the economic
coefficient was added to eliminate such influence. At the same time, economically developed areas
have relatively complete residential infrastructure, which is also one of the necessary conditions for
human settlement. The classification of GDPI is shown in Table 4.Atmosphere 2019, 10, 200 9 of 15
Table 4. The classification of Gross Domestic Product Index (GDPI).
Grades Classification of GDP (unit: Yuan per km2 )
10 [0, 424]
20 (425, 558]
30 (558, 983]
40 (983, 2337]
50 (2337, 6654]
60 (6654, 20,415]
70 (20,415, 64,282]
80 (64,282, 204,114]
90 (204,114, 649,851]
100 (649,851, 2,070,711]
4. Results and Discussion
4.1. Results of Single Natural Factor
(1) RDLS: As can be seen from Figure 3a, the RDLS in most areas was low, with the maximum
of 3.3 and the minimum of −0.03. From the perspective of province, there were some high-RDLS
areas in Anhui, Zhejiang, and Jiangxi provinces, which were distributed in the Dabie Mountain area,
mountainous area of southern Anhui, mountain area of southern Zhejiang, and the Mufu Mountain,
Jiuling Mountain in northwest Jiangxi province.
(2) WRI: As can be seen from Figure 3b, the WRI showed a trend of gradual decrease from south
to north, with high suitability areas concentrated in central and northern Jiangxi, southern Anhui, and
most areas of southwest Zhejiang. The low suitability areas were mainly concentrated in the central
and northern Anhui and most areas of Jiangsu province.
(3) LCI: As shown in Figure 3c, the LCI had the following characteristics: 1. In terms of spatial
distribution, a medium-high-low pattern was formed from north to south. The dominant vegetation
types in the three regions were dry field, paddy field, and woodland, respectively. 2. In terms of
provinces, Jiangsu province had the best suitability. Except for the uninhabitable lake areas, the scores
of the other regions were all above the average. The LCI of Anhui from north to south also presented a
medium-high-low distribution. Because the built-up areas in Shanghai were too concentrated, the LCI
of the northern Shanghai was poor. The most suitable areas of Jiangxi and Zhejiang were the areas of
basins and plains.
(4) SSI: As can be seen from Figure 3d, soil erosion in the lower reaches of the Yangtze river was
only caused by hydraulic erosion without wind erosion and freeze–thaw erosion, which was related
to the geographical location of the region. The numerous tributaries along the Yangtze river and the
abundant rainfall contributed to this phenomenon.
(5) THI: According to Figure 3e and the reference standard, the THI of the lower reaches of the
Yangtze river was suitable for human habitation. From the perspective of distribution, the THI basically
increased with the increase of latitude. The overall temperature–humidity index of Jiangxi province
was the highest, while that of Anhui province and Jiangsu province was lower. In addition, the THI of
mountainous areas was obviously lower than that of plain areas at the same latitude.
(6) LSTI: According to the actual situation of the research area, we believed that the lower the land
surface temperature is, the better the habitability is. Figure 3f shows that Shanghai had the highest
land surface temperature among the five provinces, because Shanghai had a high population density
and a high proportion of built-up area. Due to the existence of a large number of lakes, such as Tai
Lake and Hongze Lake, Jiangsu province had reserved a large area of low temperature area, while
the high temperature area was mostly concentrated in the urban agglomeration in southern Jiangsu.
There was a close relationship between land surface temperature and topography in Zhejiang and
Anhui provinces. High temperature areas were mainly concentrated in plain and basin areas; lowAtmosphere 2019, 10, 200 10 of 15
temperatures
Atmosphere areas
2019, 10, were
x FOR concentrated
PEER REVIEW in hilly and mountainous areas. Jiangxi province is located10
in of
the15
Atmosphere
south 2019,
of the 10,provinces,
five x FOR PEER the
REVIEW 10 high.
sun is the strongest, so the land surface temperature was relatively of 15
Figure
Figure3.3.
Figure 3.Suitability
Suitabilityevaluation
Suitability evaluation of
evaluation of single
of single natural
single natural elements.
natural elements. (a) RDLS; (b)
(a) RDLS;
RDLS; (b) WRI;
(b) WRI; (c)
WRI; (c)LCI;
(c) LCI;(d)
LCI; (d)SSI;
(d) SSI;(e)
SSI; (e)THI;
(e) THI;
THI;
(f)
(f)LSTI.
LSTI.
(f) LSTI.
4.2. Results of Human Settlement Natural Environment
4.2.
4.2.Results
ResultsofofHuman
HumanSettlement
Settlement Natural
Natural Environment
Environment
The distribution diagram of Human Settlement Natural Environment Index (HNEI) obtained
The
Thedistribution
distribution diagram
diagram ofof Human
Human Settlement Natural Environment
Environment IndexIndex (HNEI)
(HNEI)obtained
obtained
after superposition calculation is shown in Figure 4a. It can be seen from the figure that the
after
aftersuperposition
superpositioncalculation
calculation is
is shown
shown in
in Figure 4a. It can be seen
seen from
from the
the figure
figurethat
thatthe
therange
rangeofof
range of HNEI was 22.2–99.3. The results are expressed in five levels respectively: very unsuitable
HNEI
(22 ≤ was
HNEI was22.2–99.3.
22.2–99.3.The
Theresults
HNEI ≤ 48), unsuitable
results are
(48 expressed
are expressed in five levels respectively:
< HNEI ≤ 57), medium respectively:
suitable (57very unsuitable
very unsuitable
< HNEI (22suitable
(22
≤ 66),
≤≤HNEI
HNEI
≤48),
48),unsuitable
≤(66 unsuitable(48(48Atmosphere 2019, 10, 200 11 of 15
(1) Very unsuitable area: This area was the most unsuitable area for human habitation in the study
area, which was not suitable for development and had a fragile ecological environment. This area
accounted for 7.27% of the total area. As can be seen from the figure, this part of the region was mainly
distributed in southern Zhejiang mountain, Dabie mountain, and southern Anhui mountain. Besides,
there was Mufu mountain and Jiuling mountain in northwest Jiangxi province. The dominant factor
in these areas was RDLS. In addition, these areas also tended to be consistent in other single factor
evaluation results. As for the LCI, most of these areas were covered by forest, and the scoring criteria
was IV (30 grades). In terms of LSTI, due to the high vegetation coverage, most scoring criteria in
these areas were II (70 grades) or above. In terms of THI, due to the high terrain, the somatosensory
temperature in these areas was relatively cold, and most of the scoring criteria were III (50 grades)
or below. Finally, in addition to the southern Zhejiang mountains, other areas had varying degrees
of erosion.
(2) Unsuitable area: This area accounted for 20.14% of the total area and was widely distributed.
The reasons for the formation of such areas were complex and can be roughly divided into five
categories: The first category was the surrounding area of the very unsuitable area. The terrain and
other factors in this area were better than those in the very unsuitable area. The second category
was distributed in mountainous and hilly areas in southern Jiangxi. The terrain of this category was
between mountain and plain, and the score of RDLS increased, but correspondingly, the score of LSTI
decreased. The WRI of this area differed widely, there was less rainfall in southern Jiangxi and more in
eastern Jiangxi. The biggest difference from the first category was in the THI. Such a category had
lower latitudes and higher temperatures, making it more suitable for settlement. The third category
was the western Zhejiang hilly region and the eastern Zhejiang hilly region. Similar to the first category,
the dominant factors were RDLS and LCI. In general, this category was limited by THI, so the natural
ecological conditions were slightly worse than those of the second category. However, the GDP of
this area was higher than that of the second category; there was a strong ability to construct and
transform the residential environment. After correction, they were all in the unsuitable area. The fourth
category was located in the lake area of northern Anhui and northern Jiangsu. The water area itself
was uninhabitable and the temperature was low, so it was in the unsuitable area. The fifth category
was the northern region of the study area. The limiting factor in this category was the THI, and the
temperature was relatively cold.
(3) Very suitable area: This area had the most harmonious combination of various natural factors,
and was the most suitable place for human production and life. This category accounted for 21.19% of
the total area, mostly distributed in the plain areas along the Yangtze river, the plain areas in northern
Zhejiang, and the Poyang lake plain. There were two dominant factors in this area. The first one
was LCI, with scores of 70 or above. The vegetation coverage in these regions was basically paddy
fields, which were suitable for living. The second was RDLS. These areas were all flat and suitable for
large-scale group living.
(4) Suitable area: This category was also suitable for human habitation, accounting for 16.91% of
the total area. This area was relatively complex, which can be roughly divided into three categories:
The first category was the area around the Yangtze river basin, which was distributed around the very
suitable area. The dominant factor in this region was the LCI, and most of the vegetation was paddy
field. The second category was parts of Nantong city, Yancheng city, and part of northern Jiangsu. The
dominant factor of this region was still the LCI, and most of them were dryland regions with relatively
good hydrothermal conditions. In addition, the correlation degree between this category and the LSTI
was relatively high, and most of them were located in the region with medium temperature. The third
category was the area around Poyang lake plain in Jiangxi province and the basin area in the south of
Poyang lake. The dominant factors in this part were WRI and RDLS, and most of them were in flat
areas and areas with abundant water resources.
(5) Medium suitable area: This category covered the largest area among the five categories,
accounting for 34.56% of the total area, with a large distribution in each province. Generally, thereAtmosphere 2019, 10, 200 12 of 15
were the following distribution areas: The first category was the part of northern Anhui and northern
Zhejiang province, the dominant factor was the land cover index, and the land use type was mostly
dry land. The limiting factors were the THI and WRI. The temperature in most regions was low and
the amount of water resources was small; the score of the two indexes were mostly below 30 points.
The second category covered most of Shanghai and some parts of southern Jiangsu province. The
Atmosphere 2019, 10, x FOR PEER REVIEW 12 of 15
dominant factor of this category was LCI, and the limiting factor was LSTI. The main land use type was
construction land, and the natural conditions of this region were more suitable for living. However, it
was construction land, and the natural conditions of this region were more suitable for living.
was located in the Yangtze river delta region, and the built-up area had a large population density, so
However, it was located in the Yangtze river delta region, and the built-up area had a large
the LSTI was higher. In fact, it was no longer suitable for adding too many people, so it was classified
population density, so the LSTI was higher. In fact, it was no longer suitable for adding too many
in the medium suitable area. The third category was Tai lake, Poyang lake, and other lake areas, which
people, so it was classified in the medium suitable area. The third category was Tai lake, Poyang lake,
were similar to the lake in unsuitable areas. The fourth category was the area between the suitable
and other lake areas, which were similar to the lake in unsuitable areas. The fourth category was the
areas and the unsuitable areas. If such areas can follow the local development rules and make rational
area between the suitable areas and the unsuitable areas. If such areas can follow the local
development and utilization in the development process, they are highly likely to become suitable
development rules and make rational development and utilization in the development process, they
areas. On the contrary, if the ecological environment is damaged or the climate changes greatly, they
are highly likely to become suitable areas. On the contrary, if the ecological environment is damaged
are also likely to become unsuitable areas.
or the climate changes greatly, they are also likely to become unsuitable areas.
The ranking of HNEI in 2015 is shown in Figure 4c. Similar to Figure 4b, cities with a high index
The ranking of HNEI in 2015 is shown in Figure 4c. Similar to Figure 4b, cities with a high index
were mainly distributed along the Yangtze river, the northern Zhejiang plain, and the Poyang lake
were mainly distributed along the Yangtze river, the northern Zhejiang plain, and the Poyang lake
plain. Shanghai’s HNEI ranked twelfth. Among the other four provinces, Jiangsu province had the
plain. Shanghai's HNEI ranked twelfth. Among the other four provinces, Jiangsu province had the
best HNEI. There were six cities in the top 15: Taizhou, Nantong, Yangzhou, Zhenjiang, Changzhou,
best HNEI. There were six cities in the top 15: Taizhou, Nantong, Yangzhou, Zhenjiang, Changzhou,
and Nanjing. The overall scores of the other three provinces were similar. The top 15 cities in Zhejiang
and Nanjing. The overall scores of the other three provinces were similar. The top 15 cities in Zhejiang
province are Jiaxing and Zhoushan. Jiangxi province had Nanchang, Xinyu. Anhui province had
province are Jiaxing and Zhoushan. Jiangxi province had Nanchang, Xinyu. Anhui province had
Wuhu, Hefei, Ma’anshan, and Tongling.
Wuhu, Hefei, Ma'anshan, and Tongling.
4.3. Time Evolution Analysis of HNEI
4.3. Time Evolution Analysis of HNEI
In order to explore the evolution of HNEI in the study area, WRI, LCI, THI, and LSTI in 2010 and
2005 In order
were to exploreusing
recalculated the evolution
relevant of HNEI
data in thethe
to obtain study area,
HNEI of WRI, LCI, 2005.
2010 and THI, and
The LSTI in were
results 2010
and 2005 were recalculated using relevant data to obtain the HNEI of 2010
graded using the same criteria as in 2015, as shown in Figure 5 and Table 5. and 2005. The results were
graded using the same criteria as in 2015, as shown in Figure 5 and Table 5.
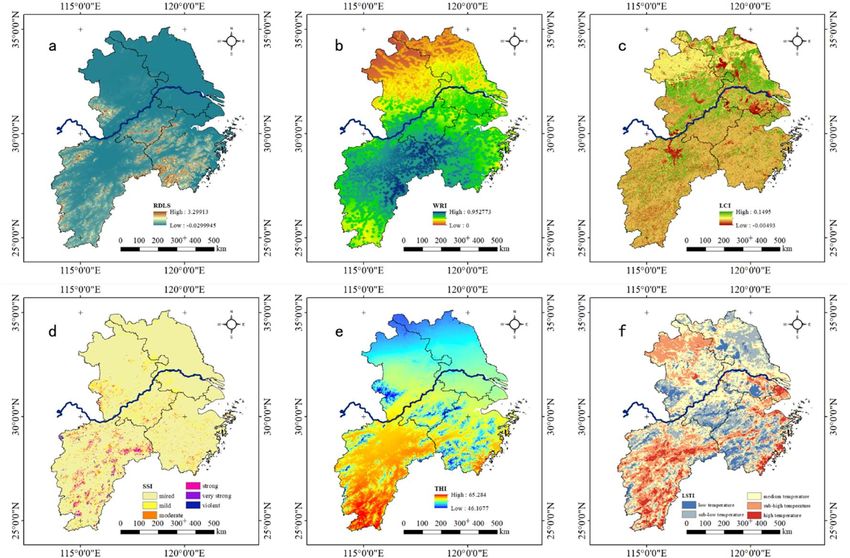
Figure
Figure 5. Results of
5. Results of natural
natural suitability
suitability of
of human
human settlements
settlements in
in 2005
2005 and
and 2010.
2010. (a)
HNEI classification
HNEI in
classification
2005; HNEI
in 2005; classification
(b) HNEI in 2010.
classification in 2010.
According to the results in Figure 5 and the result of 2015, the natural suitability of human
Table 5. The change of area proportion of each district.
settlement in the lower reaches of the Yangtze river showed little change, and the high suitability
Very Unsuitable
areas were still concentrated Unsuitable
along the Medium
Yangtze river, Suitable Zhejiang
the northern Suitableplain,
Very Suitable
and the Poyang lake
plain. However, the overall level of HENI was slightly improved; it can be seen from the results in
2015 7.20% 20.14% 34.56% 16.91% 21.19%
2010 14.30% 30.82% 22.29% 18.31% 14.28%
2005 17.80% 31.93% 20.04% 20.59% 9.64%
According to the results in Figure 5 and the result of 2015, the natural suitability of human
settlement in the lower reaches of the Yangtze river showed little change, and the high suitabilityAtmosphere 2019, 10, 200 13 of 15
Table 5 that the area of very unsuitable was significantly reduced, while the area of very suitable was
significantly increased. It was found that the leading factors are THI and WRI, and the improvement
of these two indexes increased the overall score, making the natural suitability of human settlement
somewhat improved compared with that of ten years ago.
Table 5. The change of area proportion of each district.
Very Medium
Unsuitable Suitable Very Suitable
Unsuitable Suitable
2015 7.20% 20.14% 34.56% 16.91% 21.19%
2010 14.30% 30.82% 22.29% 18.31% 14.28%
2005 17.80% 31.93% 20.04% 20.59% 9.64%
5. Conclusions
(1) In this paper, six natural factors, including relief degree of land surface (RDLS), water resource
index (WRI), land cover index (LCI), soil suitability index (SSI), temperature-humidity index (THI),
and land surface temperature index (LSTI), were selected to establish the human settlement natural
environment index (HNEI) model. With ArcGIS as a tool, the natural suitability of human settlement
in five provinces in the lower reaches of the Yangtze river was quantitatively evaluated and analyzed.
(2) The human settlement environment includes five major systems: nature, human, society,
residence, and support. There is a strong correlation between each system. The main research object of
this study is the natural system, and the GDP Index was used to correct the repeated interference of
human factors on various elements. The method is feasible to restore the human ecological system
objectively and truly from the angle of nature.
(3) In 2015, the most suitable areas accounted for 22.06% of the total area. The areas with the highest
suitability index were mainly distributed in the plains along the Yangtze river, the northern Zhejiang
plain, and the Poyang lake plain. The dominant factors were RDLS and LCI, and the vegetation cover
was basically paddy field, which is suitable for living. Suitable areas accounted for 16.85% of the total
area. Some areas were distributed around very suitable areas. In addition, there were parts of paddy
fields and dry lands in Jiangsu province, and areas with better hydrothermal conditions in Jiangxi
province. The most unsuitable areas accounted for 7.27% of the total area, and were mainly distributed
in southern Zhejiang mountain, Dabie mountain, southern Anhui mountain, Mufu mountain, and
Jiuling mountain. Relief degree of land surface (RDLS) was the dominant factor, and soil erosion areas
were also mainly distributed in these areas. The unsuitable areas accounted for 20.49% of the total area.
Some areas were distributed around the very unsuitable areas, while others were mainly distributed
in southern Jiangxi (the dominant factors were RDLS and THI), western and eastern Zhejiang (the
dominant factor was RDLS), and northern Anhui (the dominant factor was THI). The area of medium
suitable area accounted for 33.33%, which was widely distributed in each province. Whether these
areas will develop into suitable or unsuitable areas in the future depends, to a great extent, on urban
development policies and means, which are the key areas that should be paid attention to.
(4) From the perspective of space, the human settlement natural environment index of Shanghai
in 2015 was above the average. The best among the rest of the provinces was Jiangsu province, with
six cities ranking in the top 15. Zhejiang province, Jiangxi province, and Anhui province had two,
two, and four cities, respectively. From the perspective of time, the spatial distribution of the natural
suitability of human settlements did not change much from 2005 to 2015, but the overall suitability
level was improved for a certain extent, mainly due to the improvement of the temperature–humidity
index (THI) and the water resource index (WRI).
Author Contributions: Conceptualization, F.S. and X.H.Y.; methodology, F.S. and F.F.W.; data curation, F.S.;
writing, F.S.; visualization, F.S.; project administration, X.H.Y.Atmosphere 2019, 10, 200 14 of 15
Funding: This research was funded by the Project of the National Key Research Program of China
(Nos. 2017YFC0506603, 2016YFC0401305), National Natural Foundation of China (No. 51679007), and the
State Key Program of National Natural Science of China (No. 41530635).
Conflicts of Interest: The authors declare no conflict of interest.
References
1. Aynur, M.; Shi, P.; Zhao, G.J.; Yan, F.; Xue, G.L. Evaluations of living environment suitability of Hotan
Prefecture in Xinjiang based on GIS. Arid Land Geogr. 2012, 35, 847–855. (In Chinese)
2. Xie, X.Y.; Zeng, X.; Li, J. Evaluation of Nature Suitability for Human Settlement in Chongqing. Resour. Environ.
Yangtze Basin 2014, 23, 1351–1359. (In Chinese)
3. Muhammad, R.; Ruhizal, R.; Mohd, S.; Ahamad, S. Land evaluation suitability for settlement based on soil
permeability, topography and geology ten years after tsunami in Banda Aceh, Indonesia. Egypt. J. Remot
Sens. Space Sci. 2015, 18, 207–215.
4. Safa, M.; Majed, B.; Doaa, A.H. GIS approach for assessment of land suitability for different land use
alternatives in semi arid environment in Jordan: Case study (Al Gadeer Alabyad-Mafraq). Inf. Proc. Agric.
2019, 6, 91–108.
5. Walter, M.R.; Tshesane, M.; Kangethe, M. The strategically located land index support system for human
settlements land reform in South Africa. Cities 2017, 60, 91–101.
6. Bagdanavičiūtė, I.; Valiūnas, J. GIS-based land suitability analysis integrating multi-criteria evaluation for
the allocation of potential pollution sources. Environ. Earth Sci. 2013, 68, 1797–1812. [CrossRef]
7. Wu, L.Y. Search for the Theory of Science of Human Settlement. Planners 2001, 17, 5–8. (In Chinese)
8. Wu, L.Y. Introduction to Sciences of Human Settlements; China Architecture & Building Press: Beijing, China,
2001. (In Chinese)
9. Wei, W.; Shi, P.J.; Feng, H.C.; Wang, X.F. Study on the Suitability Evaluation of the Human Settlements
Environment in Arid Inland River Basin—A Case Study on the Shiyang River Basin. J. Nat. Resour. 2012, 27,
1940–1950. (In Chinese)
10. Wang, Y.; Jin, C.; Lu, M.Q.; Lu, Y.Q. Assessing the suitability of regional human settlements environment
from a different preferences perspective: A case study of Zhejiang Province, China. Habitat Int. 2017, 70,
1–12. [CrossRef]
11. Ma, R.F.; Wang, T.F.; Zhang, W.Z.; Yu, J.H.; Wang, D.; Chen, L.; Jiang, Y.P.; Feng, G.Q. Overview and progress
of Chinese geographical human settlement research. J. Geogr. Sci. 2016, 26, 1159–1175. [CrossRef]
12. Deng, M.L.; Zhang, B.; Gao, Y.R.; Yu, B. Assessment of Human Settlements in Prefecture-level Cities of
Sichuan Province. Sichuan Environ. 2009, 28, 42–47. (In Chinese)
13. Xia, Y.; Lin, A.W.; Zhu, H.J. Evolvement of Spatial Pattern of Urban Human Settlement Environment
Suitability in Yangtze River Delta. Ecol. Econ. 2017, 33, 112–117. (In Chinese)
14. Li, X.; Li, X.X.; Wang, T.; Li, L. Human Settlement Assessment in Yellow River Valley Based on Factor
Analysis. Environ. Sci. Technol. 2010, 33, 189–193. (In Chinese)
15. Li, M.; Li, X.M. Application Research on Quality Evaluation of Urban Human Settlements Based on The BP
Neural Network Improved by GA. Econ. Geogr. 2007, 32, 99–103. (In Chinese)
16. Zhang, X.R.; Fang, C.L.; Wang, Z.B.; Ma, H.T. Urban Construction Land Suitability Evaluation Based on
Improved Multi-criteria Evaluation Based on GIS (MCE-GIS): Case of New Hefei City, China. Chin. Geogr.
Sci. 2013, 23, 740–753. [CrossRef]
17. Xu, X.L. China Annual Normalized Difference Vegetation Index Spatial Distribution Data. Resource and
Environment Data Cloud Platform, Chinese Academy of Sciences. Available online: http://www.resdc.cn/
DOI/doi.aspx?DOIid=49 (accessed on 2 November 2018). (In Chinese).
18. Xu, X.L. Spatial Distribution Data of Soil Erosion in China. Resource and Environment Data Cloud Platform,
Chinese Academy of Sciences. Available online: http://www.resdc.cn/DOI/doi.aspx?DOIid=47 (accessed on
2 November 2018). (In Chinese).
19. Cheng, S.J.; Zhu, Z.L.; Bai, L.B. GIS-based Assessment on Ecological Suitability for Human Settlement—A
Case Study in the Central Arid Zone in Ningxia. Arid Zone Res. 2015, 32, 176–183. (In Chinese)
20. Feng, Z.M.; Tang, Y.; Yang, Y.Z.; Zhang, D. Relief degree of land surface and its influence on population
distribution in China. J. Geogr. Sci. 2008, 18, 237–246. [CrossRef]Atmosphere 2019, 10, 200 15 of 15
21. Wang, Y.L.; Qi, P.C.; Li, D.; Ma, X.L. Relief and Suitability Evaluation of the Human Settlements in Shaanxi
Province. J. Northwest Normal Univ. 2013, 49, 96–101. (In Chinese)
22. Lang, L.L.; Cheng, W.M.; Zhu, Q.J.; Long, E. A Comparative Analysis of the Multi-criteria DEM Extracted
Relief–Taking Fujian Low Mountainous Region as an Example. Geo-Inf. Sci. 2007, 1, 135–136. (In Chinese)
23. Hao, H.M.; Ren, Z.Y. Evaluation of Nature Suitability for Human Settlement in Shaanxi Province Based on
Grid Data. Acta Geogr. Sin. 2009, 64, 498–506. (In Chinese)
24. Feng, Z.M.; Yang, Y.Z.; Zhang, D.; Tang, Y. Natural environment suitability for human settlements in China
based on GIS. J. Geogr. Sci. 2009, 19, 437–446. [CrossRef]
25. Hao, H.M.; Ren, Z.Y.; Xue, L.; Jiang, Y.F. Quantitative Study on Response of Ecosystem to Land Use/Cover
Changes in Yulin Area Based on 3S Technology. Prog. Geogr. 2007, 96, 106–130. (In Chinese)
26. Peng, S.Z.; Yu, K.L.; Li, Z.; Wen, Z.M.; Zhang, C. Integrating potential natural vegetation and habitat
suitability into revegetation programs for sustainable ecosystems under future climate change. Agric. For.
Meteorol. 2019, 269, 270–284. [CrossRef]
27. State Environmental Protection Administration. Environmental Protection Industry Standard of the People’s
Republic of China: Technical Criterion for Ecosystem Status Evaluation; China Environmental Science Press:
Beijing, China, 2006. (In Chinese)
28. Deng, S.B.; Zhang, Q.N. GIS-Based Evaluation of Natural Suitability of Human Settlement Environment in
Guangdong Province. Acta Scientiarum Nat. Univ. Sunyatseni 2014, 53, 127–134. (In Chinese)
29. Li, Y.C.; Liu, C.X.; Zhang, H.; Gao, X. Evaluation on the human settlements environment suitability in the
Three Gorges Reservoir Area of Chongqing based on RS and GIS. J. Geogr. Sci. 2011, 21, 346–358. [CrossRef]
30. Qiao, H.J.; Ding, M.J.; Li, L.H.; Chen, Z.P.; Hou, H.Y. Design and Achievement of Soil Erosion Assessment
System of Jiangxi Province. Soil Water Conserv. China 2014, 46, 63–69. (In Chinese)
31. Teng, H.F.; Hu, J.; Zhou, Y.; Zhou, L.Q.; Shi, Z. Modelling and mapping soil erosion potential in China.
J. Integr. Agric. 2019, 18, 251–264. [CrossRef]
32. Zhao, J.L.; Yang, Z.Q.; Gerard, G. Soil and water conservation measures reduce soil and water losses in
China but not down to background levels: Evidence from erosion plot data. Geoderma 2019, 337, 729–741.
[CrossRef]
33. Yu, S.; Dai, W.Y. Fujian Province Tour Climate Evaluation. J. Fujian Normal Univ. 2005, 103–106. (In Chinese)
34. Aynur, M.; Wahap, H.; Gulgena, H.; Rebiyam, M. Assessment of residential environment suitability for
southern Xinjiang based on GIS. J. Arid Land Resour. Environ. 2012, 26, 11–17. (In Chinese)
35. Halik, W.; Mamat, A.; Dang, J.H.; Deng, B.S.; Tiyip, T. Suitability analysis of human settlement environment
within the Tarim Basin in Northwestern China. Quatern. Int. 2013, 311, 175–180. [CrossRef]
36. Bokaie, M.; Zarkesh, M.K.; Arasteh, P.D.; Hosseini, A. Assessment of Urban Heat Island based on the
relationship between land surface temperature and Land Use/ Land Cover in Tehran. Sustain. Cities Soc.
2016, 23, 94–104. [CrossRef]
37. Qiao, Z.; Sun, Z.Y.; Sun, X.H.; Xu, X.L.; Yang, J. Prediction and analysis of urban thermal environment risk
and its spatio-temporal pattern. Acta Econ. Sin. 2019, 39, 1–10. (In Chinese)
38. Zhu, B.Y.; Li, G.Z.; Liu, C.Y.; Liu, J.F.; Xu, C.H. Evaluation of the natural suitability of human settlements
environment in Jilin Province based on RS and GIS. Remot Sens. Land Resour. 2013, 25, 138–142. (In Chinese)
© 2019 by the authors. Licensee MDPI, Basel, Switzerland. This article is an open access
article distributed under the terms and conditions of the Creative Commons Attribution
(CC BY) license (http://creativecommons.org/licenses/by/4.0/).You can also read