Trial of Chemical Composition Estimation Related to Submarine Volcano Activity Using Discolored Seawater Color Data Obtained from GCOM-C SGLI. A ...
←
→
Page content transcription
If your browser does not render page correctly, please read the page content below
water
Article
Trial of Chemical Composition Estimation Related to
Submarine Volcano Activity Using Discolored Seawater Color
Data Obtained from GCOM-C SGLI. A Case Study of
Nishinoshima Island, Japan, in 2020
Yuji Sakuno

                                          Graduate School of Advanced Science and Engineering, Hiroshima University,
                                          Higashi-Hiroshima 739-8527, Japan; sakuno@hiroshima-u.ac.jp; Tel.: +81-82-424-7773

                                          Abstract: This study aims to develop the relational equation between the color and chemical compo-
                                          sition of discolored seawater around a submarine volcano, and to examine its relation to the volcanic
                                          activity at Nishinoshima Island, Japan, in 2020, using the model applied by atmospheric corrected
                                          reflectance 8 day composite of GCOM-C SGLI. To achieve these objectives, the relational equation
                                          between the RGB value of the discolored seawater in the submarine volcano and the chemical com-
                                          position summarized in past studies was derived using the XYZ colorimetric system. Additionally,
                                          the relationship between the volcanic activity of the island in 2020 and the chemical composition
                                          was compared in chronological order using the GCOM-C SGLI data. The following findings were
                                obtained. First, a significant correlation was observed between the seawater color (x) calculated

                                          by the XYZ colorimetric system and the chemical composition such as (Fe + Al)/Si. Second, the
Citation: Sakuno, Y. Trial of             distribution of (Fe + Al)/Si in the island, estimated from GCOM-C SGLI data, fluctuated significantly
Chemical Composition Estimation
                                          just before the volcanic activity became active (approximately one month prior). These results suggest
Related to Submarine Volcano
                                          that the chemical composition estimation of discolored seawater using SGLI data may be a powerful
Activity Using Discolored Seawater
                                          tool in predicting submarine volcanic activity.
Color Data Obtained from GCOM-C
SGLI. A Case Study of Nishinoshima
                                          Keywords: submarine volcano; GCOM-C SGLI; discolored seawater
Island, Japan, in 2020. Water 2021, 13,
1100. https://doi.org/10.3390/
w13081100

Academic Editor: Monica Papini            1. Introduction
                                               In recent years, there have been frequent eruptions of submarine volcanoes. Anak
Received: 26 March 2021                   Krakatau in Indonesia [1], White Island in New Zealand [2], and Nishinoshima Island in
Accepted: 13 April 2021                   Japan [3] are just three of the submarine volcanoes that have erupted in the past 2 years;
Published: 16 April 2021                  Nishinoshima Island, particularly, has had active volcanic activity since December 2019.
                                          Such eruptions of submarine volcanoes not only hinder the navigation of ships and aircraft
Publisher’s Note: MDPI stays neutral      in the area, but can also have other life-threatening implications. Hence, it is extremely
with regard to jurisdictional claims in   important to monitor these volcanoes to be able to predict any volcanic activity. Scarpa
published maps and institutional affil-
                                          and Tilling [4] have evaluated various methods related to volcano observation, noting the
iations.
                                          importance of monitoring volcanic earthquakes, the expansion of magma pools, increases
                                          in volcanic gas release, and rises in temperature. However, considering that it is dangerous
                                          to conduct such surveys, remote sensing surveys have often been used instead.
                                               Remote sensing volcanic surveys include topographic analysis of both volcanic islands,
Copyright: © 2021 by the author.          using satellite Synthetic Aperture Radar (SAR) data [5,6], and mountain bodies, using
Licensee MDPI, Basel, Switzerland.        thermal infrared sensors (thermography) mounted on helicopters, aircraft, and satellites,
This article is an open access article    as well as temperature analysis [7,8], silicon dioxide (SiO2 ) analysis of volcanic gas using
distributed under the terms and
                                          satellite infrared sensors [9,10], and eruption analysis using meteorological satellite visible
conditions of the Creative Commons
                                          and infrared sensors [11,12]. Although the relationship between the chemical composition
Attribution (CC BY) license (https://
                                          of discolored seawater and volcanic activity has been known for a long time [13,14], there
creativecommons.org/licenses/by/
                                          have been very few quantitative studies of the chemical composition itself that have been
4.0/).

Water 2021, 13, 1100. https://doi.org/10.3390/w13081100                                                       https://www.mdpi.com/journal/water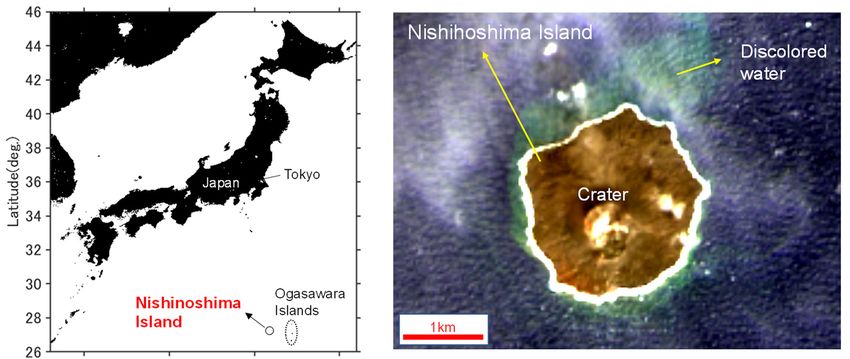
Water 2021, 13, 1100                                                                                          2 of 15

                       conducted using remote sensing, and in the few studies that have been undertaken [15,16],
                       only the reflectance pattern of discolored seawater has been analyzed.
                            Submarine volcanoes release several chemicals, including iron (Fe), aluminum (Al),
                       and silicon (Si), depending on their activity, and these chemicals change the color of
                       the surrounding sea. Generally, a higher proportion of Fe produces a yellow or brown
                       color, whereas a higher proportion of Al or Si produces a white color [17]. Focusing on this
                       discoloration phenomenon, Watanabe [18] recently attempted to use previously taken aerial
                       photographs to quantify Fe, Al, and Si from the RGB values of these images. However,
                       there was found to be no significant correlation between the RGB values and the absolute
                       values of the concentration of these chemical substances given that “the RGB values of the
                       analyzed aerial photographs were not removed from the influence of brightness due to the
                       shooting time or the weather” and that “volcanic discolored seawater is determined not by
                       the absolute values of Fe, Al, and Si, but by the relative mixing ratio”.
                            However, there have been a greater number of studies that have used satellites to
                       chromatically analyze hot spring water, instead of discolored seawater. Ohsawa et al. [19]
                       and Onda et al. [20] have explained the coloration mechanism of water in typical hot
                       springs in Japan using the chromaticity diagram of the XYZ colorimetric system [21]. They
                       identified that the blue to green colors of hot spring water and crater lakes are scattered
                       not only by the sulfur colloid, but also by the absorption of dissolved Fe2+ sunlight.
                            In recent years, satellites such as Terra/Aqua Moderate Resolution Imaging Spectrora-
                       diometer, Sentinel-3 Ocean and Land Color Imager (OLCI), and Global Change Observation
                       Mission–Climate Second Generation Global Imager (GCOM-C SGLI) have been the typ-
                       ical global satellites used in measuring the color of seawater. Among them, the SGLI
                       sensor, launched by Japan in December 2017, is the seawater color sensor that has the
                       highest resolution (250 m), and it has an observation cycle of 2–3 days. In conventional
                       satellite analysis of discolored seawater, satellites with a period of 16 days or more, such
                       as Terra Advanced Spaceborne Thermal Emission and Reflection Radiometer (ASTER)
                       and Advanced Land Observing Satellite Advanced Visible and Near-Infrared Radiometer
                       type 2 (ALOS AVNIR-2), have typically been used [15,16]. However, given the life-saving
                       potential of being able to predict volcanic eruptions, monitoring using satellites with the
                       shortest possible cycle is much preferred.
                            It is within this context that this study has been undertaken with the objectives of de-
                       veloping the relational model between the color of seawater and the chemical composition
                       around submarine volcano using the XYZ colorimetric system, and examining the volcanic
                       activity of Nishinoshima Island in 2020 using GCOM-C SGLI data.

                       2. Materials and Methods
                       2.1. Study Area
                             Nishinoshima Island is located in the Ogasawara Arc, at 27◦ 150 N and 140◦ 52.50 E,
                       approximately 1000 km south of Tokyo, Japan, as shown in Figure 1. The eruption started
                       in November 2013, after 40 years of dormancy, and continued until November 2015,
                       generating lava of approximately 8.7 × 10⁷ m3 above sea level, which increased the size of
                       the island, making it approximately 13 times larger [22]. The most recent eruption began
                       in December 2019, with further eruptions continuing until mid-August, after which the
                       eruptive activity subsided [23]. As of December 2020, the island is approximately 2 km2 in
                       size. Throughout 2020, yellow-brown, yellow-green, and brown discolored seawaters were
                       regularly observed off the coast of Nishinoshima, as can be seen in the recent Landsat-8
                       image shown in Figure 1.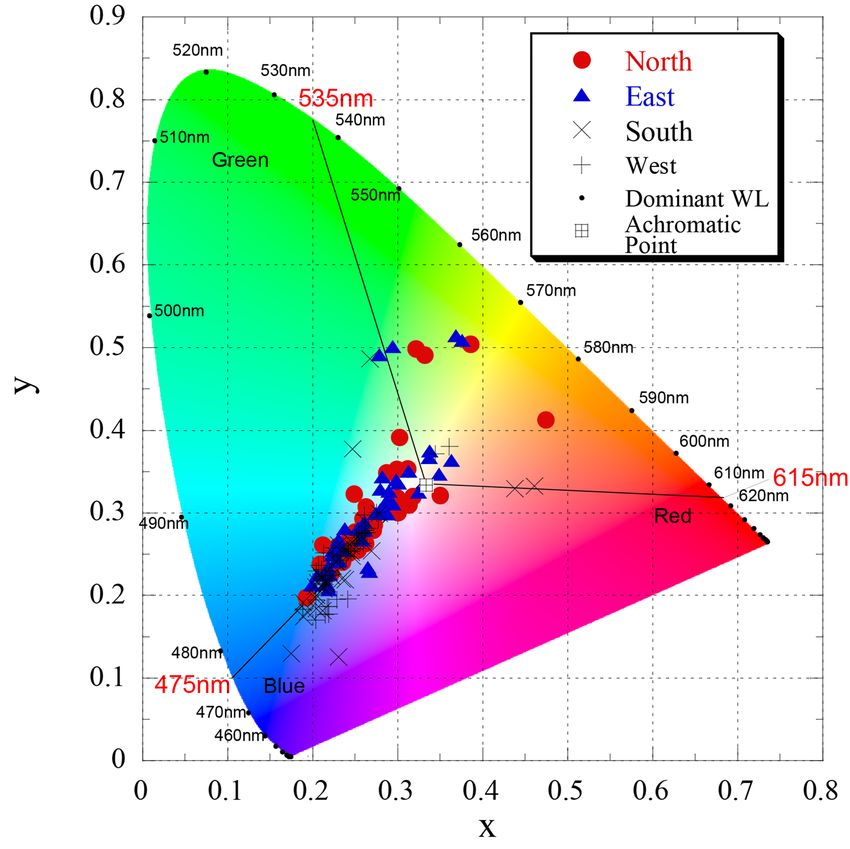
PEER REVIEW
Water 2021, 13, 1100 3 of 15 3 of 15
Figure
Figure 1. Map
1. Map of Nishinoshima
of Nishinoshima Island
Island (left) and (left) andOperational
Landsat-8 Landsat-8Land
Operational Land
Imager (OLI) Imager
image of the(OLI)
island image
taken on
of the island taken on
5 September 2020 (right). 5 September 2020 (right).
2.2.
2.2. XYZ Colorimetric XYZ Colorimetric
System Conversion System
fromConversion
RGB andfrom RGB and Reflectance
Reflectance Data Data
The color system used in this study is the XYZ colorimetric system by the Commission
The color system used in this study is the XYZ colorimetric system by the Commis-
internationale de l’éclairage (CIE) in 1931 [21,24,25], which has a proven track record in
sion internationale de
the l’éclairage (CIE)
color evaluation of in 1931
crater [21,24,25],
lakes whichwater
and hot spring has a[19,20].
proven track
This XYZrecord
colorimetric
in the color evaluation of crater
system has the lakes andof
advantage hot spring
being water
able to [19,20].
express This XYZ
the reflectance colorimetric
obtained from the RGB
system has the advantage of being
information able
of aerial to expressand
photographs thesatellite
reflectance
data inobtained fromspace.
the same color the RGB
First, the
following equation [24] was used as a formula for converting the
information of aerial photographs and satellite data in the same color space. First, the fol- RGB values obtained
from aerial photographs taken from previous studies into the XYZ colorimetric system:
lowing equation [24] was used as a formula for converting the RGB values obtained from
aerial photographs taken from previousX studies 0.4125 into the0.3576
XYZ colorimetric R system:
0.1804
Y = 0.2127 0.7152 0.0722 G (1)
X 0.4125
Z 0.3576 0.1192
0.0193 0.1804 R
0.9503 B
YG,
where, R,
=and
0.2127 0.7152
B in Equation 0.0722
(1) are values
G been converted into 0–1(1)
that have relative
valuesby dividing
0.0193 0.1192 0.9503 from the aerial photograph
the 0–255 (8-bit spectral) values obtained
imagebyZ255.
B
The following equation [19] was used to convert the reflectance into the XYZ values
where, R, G, and B (X,
in Y,
Equation
and Z) of (1) are values
the XYZ thatsystem.
colorimetric have been converted into 0–1 relative
values by dividing the 0–255 (8-bit spectral) values obtained from the aerial photograph
Z 780
image by 255. X=K S(λ) x 0(λ) R(λ)dλ (2)
380
The following equation [19] was used to convert Z 780
the reflectance into the XYZ values
(X, Y, and Z) of the XYZ colorimetric system.X = K S(λ)y0(λ) R(λ)dλ (3)
380
780
X = K S (λ
X )=xK'(λ ) RS((λ
λ))zd0(λ
Z 780
λ) R(λ)dλ (2) (4)
380 380
where S is the spectral distribution of standard light; x0 , y0 , and z0 are the color matching
function; R is the spectral780
reflectance of the object; K is the proportional coefficient (although,
X =toKconsider
it is not necessary S (λthis '(λ ) R(ofλ the
) ybecause )d λrelativizing used in this study);(3)
and λ is
380
the wavelength. The chromaticity coordinates x, y, and z are derived by normalizing the
values of X, Y, and Z as the following equations:
780
X = K S (λ ) z '(λ ) R(λ )Xd λ (4)
380 x= (5)
X+Y+Z
where S is the spectral distribution of standard light; x′, y′, and z′ are the color matching
function; R is the spectral reflectance of the object; K is the proportional coefficient (alt-
hough, it is not necessary to consider this because of the relativizing used in this study);
and λ is the wavelength. The chromaticity coordinates x, y, and z are derived by normal-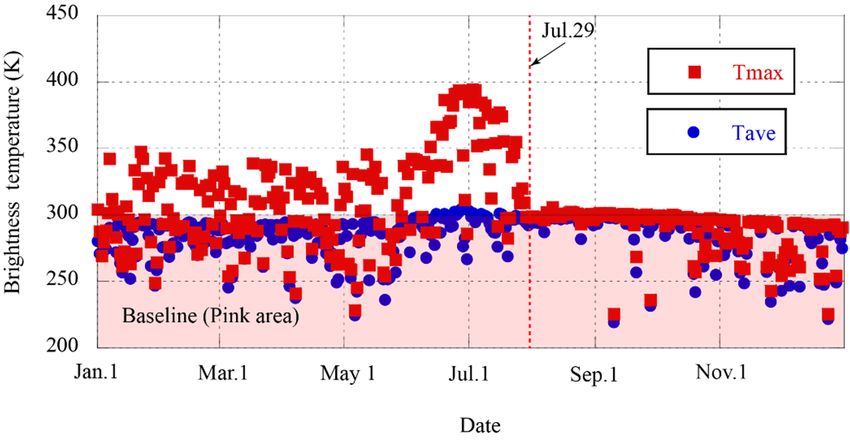
Water 2021, 13, 1100                                                                                            4 of 15

                                                                      Y
                                                               y=                                                  (6)
                                                                    X+Y+Z
                                                                      Z
                                                               z=                                                  (7)
                                                                    X+Y+Z
                             Since the variables x, y, and z in these equations have a relationship of x + y + z = 1,
                       z is automatically determined if x and y are known. Hence, in principle, if an R(λ) of
                       380–780 nm is measured, which is commonly included in Equations (2)–(4), the remaining
                       coefficients can be calculated using constants such as the JIS Handbook [25]. The discolored
                       seawater can be quantified (standardized) by the two-dimensional chromaticity coordinates
                       of x and y. However, for S(λ), various light sources have been proposed depending on the
                       purpose. In the present study, we define D65 (light under average daylight including the
                       ultraviolet region) as a standard light, which has been defined by the CIE to determine the
                       standard seawater color in the field. The product of the color matching function and the
                       standard light D65 used in Equations (2)–(4) is known as the weight factor [25].

                       2.3. Discolored Seawater and the Chemical Composition Data Set
                            To clarify the relationship between discolored seawater and its chemical composition,
                       the RGB values from aerial photographs and the chemical composition dataset of areas
                       around submarine volcanoes in various parts of Japan compiled by Watanabe [18] have
                       been used in this study. The details of the chemical analysis method for discolored seawater
                       used in Watanabe’s data are mainly based on Nogami et al. [13] and Ossaka et al. [17]. As
                       a basic method, water samples floating on the sea surface were collected using a radio-
                       controlled boat. Then, 1 mL of 6 N HCL was added to 100 mL of the collected sample,
                       and the mixture was warmed in a water bath of 100 ◦ C for 24 h to completely dissolve the
                       precipitate in the coexisting solution. The three components of Si, Fe, and Al in this solution
                       were quantified by the molybdenum yellow method, by the absorption photometry of 2,20 -
                       bipyridine method, and by the atomic absorption photometry of the nitrous oxide-acetylene
                       flame, respectively. However, this dataset obscures the statistical relationship because it
                       contains too many of the same RGB values for different chemical composition values. Thus,
                       to derive the relationship between the average color and the chemical composition, in this
                       study, when the R, G, and B values were exactly the same on any given day, the Fe, Al,
                       and Si values were changed to the average values for each day. Additionally, the dataset
                       for Satsuma Iojima Island, where there was a period of approximately 6 months between
                       the water sampling and aerial photography, was excluded in this study. Moreover, the
                       component ratios of Fe, Al, and Si were calculated and expressed as Fe%, Al%, and Si%,
                       along with ((Fe + Al)/Si) which is an index of volcanic activity proposed by Tsuchide [26].
                       Table 1 shows the Watanabe [18] dataset modified in this way. Then, assuming the following
                       simple regression model, the relationship between the two was investigated using the
                       following formula:
                                                                (CC ) = a(OC )                                      (8)
                       where [CC] is the chemical composition (Fe, Al, Si, (Fe + Al)/Si, Fe%, Al%, Si%), [OC] is
                       the seawater color values (R, G, B, x, and y), and a and b indicate the regression coefficient.
                       The significance of the correlation was judged using p < 0.01 (the significance level of 1%).

                       2.4. Calculation of Volcanic Activity Using Satellite Data
                            In the present study, GCOM-C and Himawari-8 data were used to calculate the activity
                       of Nishinoshima Island in 2020. GCOM-C is a satellite launched by Japan in December
                       2017 that is equipped with an SGLI sensor that observes the ultraviolet, visible, and near-
                       infrared bands (nine bands of 380, 412, 443, 490, 530, 565, 674, 763, and 869 nm) with
                       a 250 m resolution. In this case, since regular discolored seawater data is required, the
                       46 atmospheric corrected reflectance 8 day composite (8 day average) data from January
                       2020 to December 2020, with a 250 m spatial resolution, was downloaded from the JAXA
                       Satellite Monitoring for Environmental Studies (JASMES) Data Access System (https:
                       //www.eorc.jaxa.jp/JASMES/SGLI_STD/daily.html?area=j (accessed on 26 March 2021))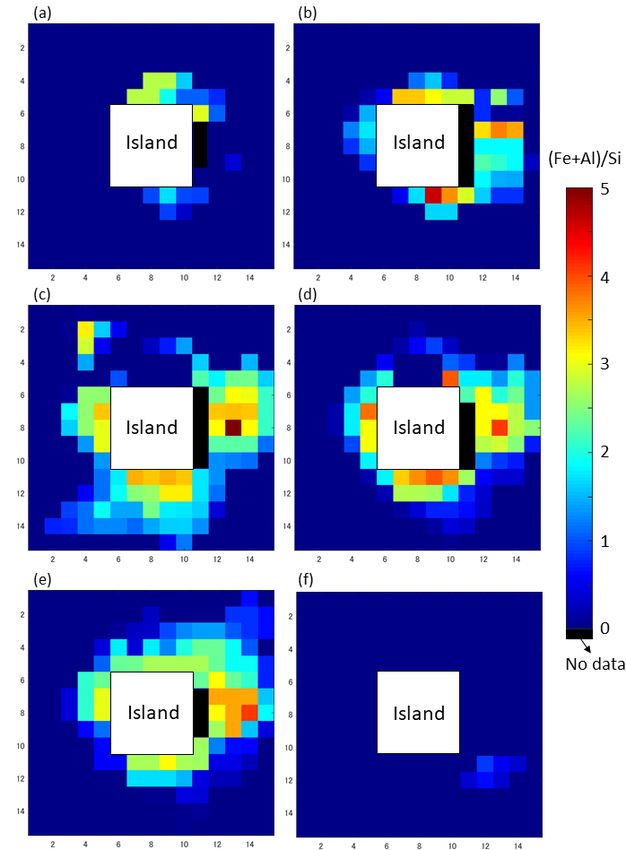
Water 2021, 13, 1100 5 of 15
produced by Japan Aerospace Exploration Agency, Earth Observation Research Center
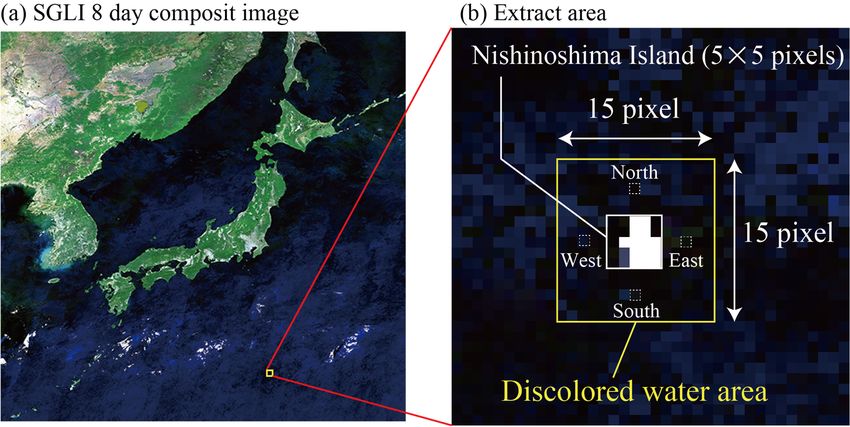
(JAXA EORC). The reflectance data actually obtained, 15 pixels × 15 pixels data centered
on Nishinoshima Island (5 × 5 pixels) was extracted, as shown in Figure 2. The reflectance
data of each pixel were converted to XYZ according to Equations (2)–(4). Specifically, as
shown in Figure 3, the reflectance of the nine bands obtained from the SGLI data is linearly
PEER interpolated in 5 nm steps, multiplied by a 5 nm weight factor (JIS Z 8781-1).6 It was then
PEER REVIEW
REVIEW 6 of
of 15
15
converted into coordinates X, Y, and Z, and the converted X, Y, and Z values were further
converted to x and y using Equations (5) and (6).
Figure 2. An example of the atmospheric corrected reflectance 8 day composite data of SGLI around
Figure 2. An example
Figure 2. An example of the of the atmospheric
atmospheric corrected
corrected reflectance reflectance
8 day 8 day
composite data composite
of SGLI data of SGLI
around Nishinoshima around
Island, Japan.
Nishinoshima
Nishinoshima Island,
Island, Japan.
Japan.
Figure 3. (a) Samples of GCOM-C atmospheric corrected spectral reflectance data, 12–20 August 2020, and (b) and weighting
Figure
Figureof 3. (a)
3.the Samples
(a)CIE
Samples of GCOM-C atmospheric corrected spectral reflectance data, 12–20 August
function 1931. of GCOM-C atmospheric corrected spectral reflectance data, 12–20 August
2020,
2020, and
and (b)
(b) and
and weighting
weighting function
function of
of the
the CIE
CIE 1931.
1931.
3.
3. Results
Results
3.1.
3.1. Relationship
Relationship between
between the
the Color
Color of
of Discolored
Discolored Seawater
Seawater and
and Its
Its Chemical
Chemical Composition
Composition in
in
Submarine Volcanoes
Submarine Volcanoes
We
We first
first investigated
investigated the
the relationship
relationship between
between discolored
discolored seawater
seawater color
color and
and its
itsWater 2021, 13, 1100 6 of 15
Table 1. Modified data set of discolored seawater (RGB) from aerial photographs and measured chemical composition (Fe, Al, and Si) for discolored seawater around Japanese submarine
volcanoes summarized by Watanabe [18].
Fe Al Si
No. Station * Water Sampling Date Aerial Photo Date R G B (Fe+Al)/Si Fe% Al% Si%
(mg/kg) (mg/kg) (mg/kg)
1 IZ Dec.10, 1986 Dec.10, 1986 112 146 147 0.18 0.8 1.79 0.55 6.5 28.9 64.6
2 IZ Dec.11, 1986 Dec.11, 1986 161 184 176 0.02 0.04 0.24 0.25 6.7 13.3 80.0
3 IZ Dec.16, 1986 Dec.17, 1986 161 168 174 1.6 2.75 6.74 0.64 14.4 24.8 60.8
4 IZ Dec.20, 1986 Dec.20, 1986 113 122 121 0.57 1.44 3.09 0.65 11.2 28.2 60.6
5 IZ Jan. 7, 1987 Jan. 7, 1987 146 152 148 0.36 1.16 2.25 0.68 9.5 30.8 59.7
6 IZ Jan. 8, 1987 Jan. 8, 1987 138 157 157 0.24 1.05 1.64 0.79 8.2 35.8 56.0
7 NS Jul. 7-8, 1974 Aug. 3, 1974 119 126 144 1.4 0.7 11.23 0.19 10.5 5.3 84.2
8 KT Mar.1984 - 221 220 200 0.3 0 0.22 1.36 57.7 0.0 42.3
9 FO Mar.21, 1977 Jan.10, 1977 233 247 247 0.14 0.09 0.25 0.94 29.2 18.8 52.1
10 FO Jan.20-24, 1986 Jan.12, 1986 153 125 113 0.54 0.63 0.56 2.07 31.2 36.4 32.4
11 FO Feb.1-26, 1986 Jan.29, 1986 114 108 118 0.13 0.34 2.71 0.17 4.1 10.7 85.2
* IZ: Izu-Ohshima Island, NS: Nishinoshima Island, KT: Kaitoku Seamount, FO: Fukutoku-Okanoba.Water 2021, 13, 1100 7 of 15
The Himawari-8 is a meteorological satellite launched by Japan in October 2014 that is
equipped with the Advanced Himawari Imager (AHI), which has a total of 16 bands from
0.47 to 13.3 µm. In this study, the brightness temperature in the 3.9 µm band (AHI band 7)
was extracted to estimate the high-brightness temperature inside of the crater as an index of
volcanic activity [27]. The projection-converted L1 gridded data with 2 km spatial resolution
(https://www.eorc.jaxa.jp/ptree/index.html (accessed on 26 March 2021)) provided by
JAXA EORC were downloaded. The maximum area value of 15 pixels × 15 pixels centered
on Nishinoshima Island at midnight (15:00 UTC) was set, and this was used as an index of
volcanic activity.
3. Results
3.1. Relationship between the Color of Discolored Seawater and Its Chemical Composition in
Submarine Volcanoes
We first investigated the relationship between discolored seawater color and its chem-
ical composition in general submarine volcanic waters. Table 2 shows the correlation
coefficient between the seawater color and its chemical composition, explained using
Equation (8). No significant correlation was obtained between (R, G, B) and (Fe, Al, Si,
(Fe + Al)/Si). However, several statistically significant (p < 0.01) correlations were ob-
served between R and Fe%, x and (Fe + Al)/Si, y and (Fe + Al)/Si, y and Si, and y and
Si%, respectively. Particularly, the highest correlation coefficient (r = 0.83) was obtained
for x and (Fe + Al)/Si. Figure 4 shows the relationships between the five combinations of
seawater color and chemical composition that were found to have a statistically significant
correlation (p < 0.01). Each relationship is expressed through the following equations:
( Fe%) = 0.302( R) − 28.7 (9)
(( Fe + Al )/Si ) = 45.4( x ) − 13.3 (10)
(( Fe + Al )/Si ) = 564(y) − 17.8 (11)
(Si ) = −360( x ) + 121 (12)
(Si%) = −1739(y) + 634 (13)
Table 2. Correlation coefficient of discolored seawater color (R, G, B, x, and y) and its chemical
composition (Fe, Al, Si, (Fe + Al)/Si, Fe%, Al%, and Si%).
Chemical Composition R G B x y
Fe −0.17 −0.24 −0.14 −0.08 −0.45
Al −0.34 −0.31 −0.25 −0.18 −0.23
Si −0.43 −0.41 −0.24 −0.4 −0.79 *
(Fe+Al)/Si 0.45 0.21 0.05 0.83 * 0.75 *
Fe% 0.78* 0.59 0.46 0.61 0.59
Al% −0.31 −0.29 −0.34 0.11 0.27
Si% −0.53 −0.36 −0.2 −0.67 −0.77 *
* p < 0.01.
3.2. Volcanic Activity Characteristics of Nishinoshima Estimated from AHI Data
Various data are required to link the discolored seawater color data from SGLI with
numerical volcanic activity. The Himawari-8 AHI temperature data for Nishinoshima
Island (mainly the temperature of the crater) is used as time series data for volcanic
activity [27]. In this study, the time series characteristics of the temperature for the whole
year (2020) were investigated by applying the method (The larger the difference between
the area’s average temperature (Tave) and the area maximum temperature (Tmax) in the
3.7 µm, the more intense the volcanic activity). Figure 5 shows the Tave and Tmax obtained
from the AHI data. Taking Tave as the background temperature, it can be seen that the
temperature was approximately 300 K (pink region) throughout the year. Additionally,Water 2021, 13, 1100 8 of 15
the Tmax from January to June 2020 fluctuates between 300 and 350 K (a temperature
difference of approximately 50 K), and subsequently, from the beginning of June to the
end of July, the Tmax increased from 350 to 400 K (an increase of 50 K). The Tmax peak
Water 2021, 13, x FOR PEER REVIEWoccurred around July 1, and by July 29, it had dropped back to the Tave level. Afterward, 8 of 1
the Tmax and Tave values remained almost the same, and no further increase in Tmax was
observed until the end of December.
(a) (b)
70 2.5
y = -28.7+ 0.302x R= 0.78 y = -13.3 + 45.4x R= 0.83
60
2
50
1.5
(Fe+Al)/Si
40
Fe (%)
30 1
20
0.5
10
0 0
100 120 140 160 180 200 220 240 0.29 0.3 0.31 0.32 0.33 0.34 0.35
R x
(c) (d)
14 2.5
y = 121 - 360x R= 0.79 y = -17.8 + 564.362x R= 0.75
12
2
10
1.5
(Fe+Al)/Si
Si (mg/kg)
8
6 1
4
0.5
2
0 0
0.31 0.315 0.32 0.325 0.33 0.335 0.34 0.31 0.32 0.33 0.34 0.35
y y
(e)
100
y = 634 - 1739x R= 0.77
90
80
70
Si (%)
60
50
40
30
0.31 0.315 0.32 0.325 0.33 0.335 0.34
y
Figure4.4.Examples
Figure Examples of of
thethe relationship
relationship between
between the parameters
the parameters of discolored
of discolored seawaterseawater color pa-
color param-
rameters
eters (R, x,(R,
andx,y)and
andy)itsand its chemical
chemical composition
composition (Fe, (Fe (Fe, (Fe +and
+ Al)/Si, Al)/Si,
Si). and
(a) RSi).
vs. (a) R vs
Fe%, (b)Fe%,
x vs. (b) x vs
(Fe+al)/Si,(c)
(Fe+al)/Si, (c)yyvs.
vsSi%,
Si%,(d)(d)y y
vs.vs(Fe+Al)/Si,
(Fe+Al)/Si,(e)(e) y vs
y vs. Si%.
Si%.19 Aug. 2020 None Yes - - -
yellow-green NW/SW -
23 Aug. 2020 None Yes
Light green N/SE 2 km<
5 Sep. 2020 None Yes - NW/SW 2 km<
Water 2021, 13, 1100 28 Oct. 2020 None Yes brown SE/SW - 9 of 15
24 Nov. 2020 None Yes brown SE/SW -
7 Dec. 2020 None Yes brown SE/SW -
Figure5.5. Time
Figure Time series of the
series of the maximum
maximumtemperature
temperature(Tmax)
(Tmax)and
andthe
the average
average temperature
temperature (Tave)
(Tave)
obtained from the 3.9 µm band of the Himawari-8 data around Nishinoshima Island in 2020.
obtained from the 3.9 µm band of the Himawari-8 data around Nishinoshima Island in 2020.
3.3. Table 3 shows the activity
Color Characteristics statusSeawater
of Discolored of Nishinoshima Island
Estimated from during
SGLI Data 2020, which was
obtained by the Japan Coast Guard [23], mainly through visual observations undertaken
To validate whether the seawater color data obtained by SGLI accurately captures
using aircraft. We have summarized the color, location, and scale of the discolored seawater
the actual conditions of the discolored seawater, we investigated the color characteristics
described by the Japan Coast Guard in a compact manner. These data show that an eruption
of the discolored seawater, estimated from the SGLI data. Figure 6 is a chromaticity dia-
had already occurred by the beginning of 2020, which continued until the end of July, with
gram of the seawater color at fixed points (north, east, south, and west) in the sea area
the eruption subsiding for a short period during the first half of April and eruptive activity
since August 19 has subsided. Hence, the activity of the volcano is in agreement with the
fluctuation observed in the AHI Tmax. In other words, eruptive activity occurs when the
Tmax greatly exceeds the Tave (with a temperature difference between several tens to 100 K),
and eruptive activity has subsided when the Tmax and Tave values are approximately the
same and below 300 K.
Table 3. Volcanic activity record of Nishinoshima Island obtained through visual observations by the Japan Coast Guard.
(The discoloration information has been modified into a short description.).
Date Eruption Discolored Water Water Color Discoloration Position Discoloration Width
17 Jan. 2020 Yes Yes - - -
4 Feb. 2020 Yes Yes yellowish-brown W/NE about 100 m
17 Feb. 2020 Yes Yes - - -
9 Mar. 2020 Yes Yes yellow-green W/N/E
15 Mar. 2020 Yes Yes - - -
6 Apr. 2020 None Yes - - -
16 Apr. 2020 None Yes - - -
19 Apr. 2020 None Yes brown E
29 Apr. 2020 Yes Yes - - -
18 May 2020 Yes Yes - - -
7 Jun. 2020 Yes Yes yellowish-brown N -
15 Jun. 2020 Yes Yes yellowish-brown E -
19 Jun. 2020 Yes Yes - - -
29 Jun. 2020 Yes Yes yellow-green All
20 Jul. 2020 Yes Yes - - -
19 Aug. 2020 None Yes - - -
yellow-green NW/SW -
23 Aug. 2020 None Yes
Light green N/SE 2 km<
5 Sep. 2020 None Yes - NW/SW 2 km<
28 Oct. 2020 None Yes brown SE/SW -
24 Nov. 2020 None Yes brown SE/SW -
7 Dec. 2020 None Yes brown SE/SW -Water 2021, 13, 1100 10 of 15
3.3. Color Characteristics of Discolored Seawater Estimated from SGLI Data
To validate whether the seawater color data obtained by SGLI accurately captures the
Water 2021, 13, x FOR PEER REVIEW 10 of 15
actual conditions of the discolored seawater, we investigated the color characteristics of
the discolored seawater, estimated from the SGLI data. Figure 6 is a chromaticity diagram
of the seawater color at fixed points (north, east, south, and west) in the sea area around
around Nishinoshima
Nishinoshima Island estimated
Island estimated from SGLI.from SGLI.
The The numbers
numbers around the around
colorstheindicate
colors indi-
the
dominant wavelength
cate the dominant (WL), which
wavelength (WL),iswhich
an index
is an of the of
index hue.
the From the xthe
this, this,
hue. From value of
x value
the seawater
of the seawatercolor
colorchanges within
changes a range
within a rangeofofapproximately
approximately0.2 0.2toto0.5,
0.5,and
andthetheyyvalue
value
changes
changeswithin
withinaarange
rangeof ofapproximately
approximately0.1 0.1to
to0.5.
0.5. Additionally,
Additionally,the thedata
dataareareparticularly
particularly
concentrated
concentrated in in blue
blue (where
(wherethethedominant
dominantWL WLisisapproximately
approximately475 475±± 55 nm)
nm)from
fromthethe
Achromatic
Achromatic point
point (white
(white point)
point)totothe
thelower
lowerleft.
left. Relatively
Relatively pure
pure green–red
green–redseawater
seawater
(dominant
(dominantWL WLfromfromapproximately
approximately535 535nmnmto toapproximately
approximately615 615nm)
nm) waswas also
also captured.
captured.
There
There are several seawater color groups that are far from the group in zone A,such
are several seawater color groups that are far from the group in zone A, suchas asthe
the
seawater color in zones B and C, at the north, east, and south stations. The
seawater color in zones B and C, at the north, east, and south stations. The color change color change of
the west
of the station
west is relatively
station small
is relatively andand
small waswas
confirmed
confirmed qualitatively.
qualitatively.
Figure6.6.Colorimetric
Figure Colorimetricdata
dataofofdiscolored
discoloredseawater atat
seawater the four
the directions
four (north,
directions east,
(north, south,
east, andand
south, west)
west) around
around Nishinoshima
Nishinoshima Island
Island in 2020.in 2020.
3.4.
3.4.Distribution
DistributionCharacteristics
Characteristicsofofthe
theChemical
ChemicalComponents
ComponentsEstimated
Estimatedfrom
fromSGLI
SGLIData
Data
We
We investigated the distribution characteristics of the chemical compositionof
investigated the distribution characteristics of the chemical composition ofNishi-
Nishi-
noshima estimated from the SGLI data using the estimation formula that gave the
noshima estimated from the SGLI data using the estimation formula that gave the strong-strongest
significant correlation in Section 3.1. Figure 7 is an example of an estimated distribution
est significant correlation in Section 3.1. Figure 7 is an example of an estimated distribu-
map of (Fe + Al)/Si between mid-May and late June that has been mapped by applying
tion map of (Fe + Al)/Si between mid-May and late June that has been mapped by applying
Equation (10) to the SGLI data. From this, it is qualitatively well understood that the
Equation (10) to the SGLI data. From this, it is qualitatively well understood that the value
value of the northeastern part of the island rises as a whole during this period, and then
of the northeastern part of the island rises as a whole during this period, and then the
discoloration gradually progresses to the sea area around the entire island, before it dis-
appears.
Furthermore, we investigated the annual time series fluctuations in 2020 to quantita-
tively understand the changes in (Fe + Al)/Si in the discoloration range. In Figure 8, theWater 2021, 13, x FOR PEER REVIEW 11 of 15
Water 2021, 13, 1100 11 of 15
each time and is displayed in chronological order together with the Tmax (as explained in
Section 3.2). Consequently, (Fe + Al)/Si fluctuated significantly in May and June, before
the Tmax peak at the start of July, and then decreased in early July. Afterward, the discol-
the discoloration
oration gradually
range decreased progresses
sharply, and it to
wastheconfirmed
sea area around
that thethe entire
value island, before
remained almostit
disappears.
constant from the beginning of August.
Figure
Figure7.7.Example
Exampleofofthe
the(Fe
(Fe++Al)/Si
Al)/Sidistribution
distributionasasa avolcanic
volcanicactivity
activityindex
indexfrom
fromMay
May16
16 to
to June
June 25
25 around Nishinoshima Island. (a) 16–23 May 2020, (b) 24–31 May 2020, (c) 1–8 June 2020, (d) 9–
around Nishinoshima Island. (a) 16–23 May 2020, (b) 24–31 May 2020, (c) 1–8 June 2020, (d) 9–16
16 June 2020, (e) 17–24 June 2020, (f) 25 June–2 July 2020.
June 2020, (e) 17–24 June 2020, (f) 25 June–2 July 2020.
Furthermore, we investigated the annual time series fluctuations in 2020 to quantita-
tively understand the changes in (Fe + Al)/Si in the discoloration range. In Figure 8, the
area average (Fe + Al)/Si value of the entire sea area in the analysis range was calculated
each time and is displayed in chronological order together with the Tmax (as explained in
Section 3.2). Consequently, (Fe + Al)/Si fluctuated significantly in May and June, before the
Tmax peak at the start of July, and then decreased in early July. Afterward, the discolorationWater 2021, 13, 1100 12 of 15
R REVIEW 12 of 15
range decreased sharply, and it was confirmed that the value remained almost constant
from the beginning of August.
Active volcanic activity
400 1
Tmax (Volcanic activity)
temperature of 3.7μm (deg.C)
380
0.8
Maximum brightness
Average (Fe+Al)/Si
360
0.6
340
0.4
320
(Fe+Al)/Si
300 0.2
280 0
Jan. Feb. Mar. Apr. May Jun. Jul. Aug. Sep. Oct. Nov. Dec.
Date
Figure 8. Comparison of the time series between Tmax (as a volcanic activity from Himawari-8) and an area average
Figure 8. Comparison of the time series between Tmax (as a volcanic activity from Himawari-8)
(Fe + Al)/Si of the discolored seawater color around Nishinoshima Island (from GCOM-C) during 2020. (Both datasets
and an area
involved an 8average
day cycle).(Fe + Al)/Si of the discolored seawater color around Nishinoshima Island
(from GCOM-C) during 2020. (Both datasets involved an 8 day cycle).
4. Discussion
4. Discussion 4.1. Validity of the Relationship between the Seawater Color and its Chemical Composition
According to Nogami et al. [13] and Ossaka et al. [14], the discolored seawater around
4.1. Validity of the Relationship
submarine between the
volcanoes is Seawater
known Colorbyand
to be caused the its Chemical
reaction Composition
of the SiO2 –Al2 O3 –Fe2 O3 –H2 O
system.et
According to Nogami Toal.
estimate
[13] andthe volcanic
Ossakaactivity
et al. from
[14],the
theseawater color using
discolored this relationship,
seawater around
Watanabe [18] investigated the relationship between the RGB values of the aerial pho-
submarine volcanoestographs
is known and to
thebe caused
chemical by the reaction
composition (Fe, Al, andof
Si)the SiO2–Al
but found 2O3–Fe2O3–H2O
no significant correlation
system. To estimate the volcanic
between the two.activity from
We, therefore, the seawater
excluded color
both duplicate datausing this
and data relationship,
with a large observa-
tion time the
Watanabe [18] investigated gap from the Watanabe
relationship [18] dataset
between and
the reanalyzed
RGB valuesit using XYZ colorimetric
the aerial
of the photo-
system and a new (Fe + Al)/Si. Consequently, and as shown in Table 2 and Figure 4, we
graphs and the chemical composition (Fe, Al, and Si) but found no significant correlation
found a strong and significant correlation between x and (Fe + Al)/Si and between y and
between the two. We,Si.therefore,
Since x means excluded both duplicate
“red,” excluding the brightness data and data
component, with
it has a large
a slightly ob-
different
servation time gap from the Watanabe [18] dataset and reanalyzed it using the XYZ col-in
meaning from R, for which Watanabe [18] could not find a correlation. In other words,
the correlation analysis conducted by Watanabe [14], it is considered necessary to elimi-
orimetric system and nate
a new (Fe + Al)/Si. Consequently, and as shown in Table 2 and Figure
the influence of the brightness condition due to the shooting conditions of the aerial
4, we found a strong and significant
photograph. correlation
Conversely, among thebetween
RGB values x and (Fe + Al)/Si
that Watanabe and between
[18] attempted y
to use, the
R value was found to have a strong and significant correlation
and Si. Since x means “red,” excluding the brightness component, it has a slightly different with Fe% (the ratio of the
three components of Fe) in this study. It is suggested that estimating the Fe% from R may
meaning from R, for which Watanabe [18] could not find a correlation. In other words, in
be useful as a simple method for estimating the volcanic activity.
the correlation analysis conducted by Watanabe [14], it is considered necessary to elimi-
4.2. Validity of Seawater Color Estimation Derived from SGLI
nate the influence of the brightness condition due to the shooting conditions of the aerial
Generally, the colors of seawater worldwide are represented using the Forel–Ure (FU)
photograph. Conversely, among the RGB values that Watanabe [18] attempted to use, the
water color scale. The x and y of FU1 to FU21 are in the range of 0.19 to 0.47 and 0.16
R value was found totohave a strong and
0.49, respectively [28]. significant
This time, thecorrelation
seawater color with Fe%
around (the ratio Island
Nishinoshima of theis
three components of Fe)
withinin the
thisrange
study.of FUIt water
is suggested that all
color in almost estimating
of this area,the
andFe% from
this is R may
considered to
be appropriate. However, since the SGLI data used were the composite data for 8 days,
be useful as a simple itmethod for estimating the volcanic activity.
could not be compared and validated with the visual XYZ colorimetric for each day.
Additionally, the colors visually observed from an aircraft and the colors measured by
4.2. Validity of Seawater Color Estimation Derived from SGLI
Generally, the colors of seawater worldwide are represented using the Forel–Ure
(FU) water color scale. The x and y of FU1 to FU21 are in the range of 0.19 to 0.47 and 0.16Water 2021, 13, 1100 13 of 15
satellites do not always match because of the effects of weather and water surface reflection.
Furthermore, although the reflectance data of SGLI has only nine bands, 5 nm step data
are created by linear interpolation, and there may be some errors introduced through
the interpolation method. Thus, it should be remembered that this result is based on the
assumption that “the water color calculated by SGLI is correct or captures the relative
change of the seawater color”.
Conversely, data that changes into three systems of blue, green, and red were obtained
by calculating the SGLI data. Such changes in color (or main WL) appear to be related to the
chemical composition of seawater. Ohsawa et al. [19] explained, from the chemical analysis
of hot spring water, that the water changes color because of the influences of Si in the blue
region near the main WL of 480 nm and Al in the region near 490 nm. Onda et al. [20], after
chemical analysis of crater lakes, explained that the green coloration near the main WL
of 535 nm is due to the influence of Fe2+ . After consideration of these previous studies,
these results are also the reason behind the change in the chemical composition around
Nishinoshima Island.
4.3. Validity of Discolored Seawater Distribution Characteristics Based on SGLI Data
According to Ossaka et al. [17], “The chemical composition and color tone of dis-
colored seawater change sharply in response to the fate of volcanic activity, and it is an
effective index for understanding the activity status of submarine volcanoes.” However,
the timing of the discolored seawater and its relationship with eruptive activity have not
yet been elucidated. In this study, the distribution of (Fe + Al)/Si in Nishinoshima Island
estimated from SGLI data spread to the northeastern part of the island from mid-May
to late-June, as shown in Figure 7. This is thought to be due to the lava deposition that
spread to the northeastern coast of the island during this period, which was reported by the
Geospatial Information Authority of Japan [29]. The distribution fluctuated significantly
approximately one month before the volcanic activity began. By contrast, satellite analysis
of the submarine volcano Fukutoku-Oka-no-Ba conducted by Urai [16] reported that there
was no change in the seawater color before the eruption and that there was a large change
in the seawater color immediately after. In fact, in 2020, no eruptions were observed at
Nishinoshima Island after August, but discolored seawater continued to appear, and it was
believed that a longer-span analysis (at least 5 years) was necessary.
5. Conclusions
The present study aimed to derive the relational model between the seawater color
and the chemical composition in the discolored seawater area using the XYZ colorimetric
system and to examine the predictability of volcanic activity in Nishinoshima Island by
GCOM-C SGLI. The following three results have been obtained:
1. A significant correlation was found between the seawater color (x) calculated using
the XYZ colorimetric system and the chemical composition such as x vs (Fe + Al)/Si,
y vs Si, y vs (Fe + Al)/Si, y vs Si% based on the modified dataset from a previous
study [18].
2. The fluctuation of the Himawari-8 maximum water temperature (Tmax) around
Nishinoshima Island at midnight corresponded well with the volcanic activity.
3. The discolored seawater around Nishinoshima Island, derived from SGLI, is mostly
blue at the dominant WL of approximately 475 nm, but we also observed data showing
a relatively high purity of green to red at approximately 535–615 nm.
4. The distribution of (Fe + Al)/Si in Nishinoshima Island, estimated from SGLI data,
fluctuated significantly just before the volcanic activity became active (approximately
one month prior).
It will be necessary in the future to validate the effectiveness of the method proposed
in this study. However, presently, it is extremely difficult to conduct a water sampling
survey in the field when eruptive activity is active, and therefore, it will be necessary to
verify the method in cooperation with institutions within the country that has jurisdiction.Water 2021, 13, 1100 14 of 15
Finally, we would like to perform a similar analysis on submarine volcanoes distributed
around the world to elucidate the relationship between volcanic activity and the seawater
color of the surrounding sea area.
Funding: This work was supported by JSPS KAKENHI Grant Number 17H04625,18H03731, 19H04292,
20KK0141.
Acknowledgments: I would like to thank Kento Hirase of Hiroshima University for helping me
with the satellite data processing that is the basis of this paper. The satellite data (Himawari-8 and
GCOM-C) was used in this paper was supplied by the P-Tree and the JASMES systems of JAXA.
(https://www.eorc.jaxa.jp/ptree/userguide.html (accessed on 26 March 2021), https://www.eorc.
jaxa.jp/JASMES/SGLI_STD/daily.html (accessed on 26 March 2021)).
Conflicts of Interest: The authors declare no conflict of interest.
References
1. Babu, A.; Kumar, S. InSAR coherence and backscatter images based analysis for the Anak Krakatau volcano eruption. Proceedings
2019, 24, 21. [CrossRef]
2. Yates, A.S.; Savage, M.K.; Jolly, A.D.; Caudron, C.; Hamling, I.J. Volcanic, coseismic, and seasonal changes detected at White
Island (Whakaari) volcano, New Zealand, using seismic ambient noise. Geophys. Res. Lett. 2019, 46, 99–108. [CrossRef]
3. Tamura, Y.; Ishizuka, O.; Sato, T.; Nichols, A.R. Nishinoshima volcano in the Ogasawara Arc: New continent from the ocean?
Island Arc 2019, 28, e12285. [CrossRef]
4. Scarpa, R.; Tilling, R.I. Monitoring and Mitigation of Volcano Hazards; Springer: Berlin/Heidelberg, Germany, 2012.
5. Delacourt, C.; Briole, P.; Achache, J.A. Tropospheric corrections of SAR interferograms with strong topography. Application to
Etna. Geophys. Res. Lett. 1998, 25, 2849–2852. [CrossRef]
6. Remy, D.; Bonvalot, S.; Briole, P.; Murakami, M. Accurate measurements of tropospheric effects in volcanic areas from SAR
interferometry data: Application to Sakurajima volcano (Japan). Earth Planet. Sci. Lett. 2003, 213, 299–310. [CrossRef]
7. Rothery, D.A.; Francis, P.W.; Wood, C.A. Volcano monitoring using short wavelength infrared data from satellites. J. Geophys. Res.
Solid Earth 1998, 93, 7993–8008. [CrossRef]
8. Kaneko, T.; Koyama, T.; Yasuda, A.; Takeo, M.; Yanagisawa, T.; Kajiwara, K.; Honda, Y. Low-altitude remote sensing of volcanoes
using an unmanned autonomous helicopter: An example of aeromagnetic observation at Izu-Oshima volcano, Japan. Int. J.
Remote Sens. 2011, 32, 1491–1504. [CrossRef]
9. Urai, M. Sulfur dioxide flux estimation from volcanoes using advanced spaceborne thermal emission and reflection radiometer—a
case study of Miyakejima volcano, Japan. J. Volcanol. Geotherm. Res. 2004, 134, 1–13. [CrossRef]
10. Prata, A.J.; Kerkmann, J. Simultaneous retrieval of volcanic ash and SO2 using MSG-SEVIRI measurements. Geophys. Res. Lett.
2007, 34. [CrossRef]
11. Simpson, J.J.; Hufford, G.; Pieri, D.; Berg, J. Failures in detecting volcanic ash from a satellite-based technique. Remote Sens.
Environ. 2000, 72, 191–217. [CrossRef]
12. Ellrod, G.P.; Connell, B.H.; Hillger, D.W. Improved detection of airborne volcanic ash using multispectral infrared satellite data.
J. Geophys. Res.: Atmos. 2003, 108. [CrossRef]
13. Nogami, K.; Yoshida, M.; Ossaka, J. Chemical composition of discolored seawater around Satsuma-Iwojima, Kagoshima, Japan.
Bull. Volcanol. Soc. Jpn. 1993, 38, 71–77.
14. Ossaka, J.; Adachi, N.; Tsuchide, N.; Nogami, K. Chemical compositions of discolored sea water around Izu-Oshimaat the 1986
Eruption. Bull. Volcanol. Soc. Jpn. 2000, 38, 71–77. (In Japanese)
15. Urai, M.; Machida, S. Discolored seawater detection using ASTER reflectance products: A case study of Satsuma-Iwojima, Japan.
Remote Sens. Environ. 2005, 99, 95–104. [CrossRef]
16. Urai, M. Time series analysis of discolored seawater reflectance observed by Advanced Visible and Near Infrared Radiometer
type 2 (AVNIR-2) at Fukutoku-Okonaba submarine volcano, Japan. J. Volcanol. Geotherm. Res. 2014, 269, 23–27. [CrossRef]
17. Ossaka, J.; Hirabayahi, J.; Nogami, K.; Tsuchide, M.; Adach, N. Chemical compositions of discolored sea water corresponding
to activity of Fukutoku-Oka-no-Ba submarine volcano. -As an index of submarine volcanism. Bull. Volcanol. Soc. Jpn. 1996,
3, 107–113. (In Japanese)
18. Watanabe, K. Comparison between chemical compositions and RGB values of discolored seawater around volcanoes. Rep.
Hydrogr. Oceanogr. Res. 2015, 52, 49–55. (In Japanese)
19. Ohsawa, S.; Kawamura, T.; Takamatsu, N.; Yusa, Y. Rayleigh scattering by aqueous colloidal silica as a cause for the blue color of
hydrothermal water. J. Volcanol. Geotherm. Res. 2002, 113, 49–60. [CrossRef]
20. Onda, Y.; Ohsawa, S.; Takamatsu, N. A colorimetric and geochemical study of the coloration factor of hyper-acid active crater
lakes. Jpn. J. Limnol. 2003, 64, 1–10. (In Japanese) [CrossRef]
21. Westland, S. Review of the CIE system of colorimetry and its use in dentistry. J. Esthet. Restor. Dent. 2003, 15, S5–S12. [CrossRef]
22. Sano, T.; Shirao, M.; Tani, K.; Tsutsumi, Y.; Kiyokawa, S.; Fujii, T. Progressive enrichment of arc magmas caused by the subduction
of seamounts under Nishinoshima volcano, Izu–Bonin Arc, Japan. J. Volcanol. Geotherm. Res. 2016, 319, 52–65. [CrossRef]Water 2021, 13, 1100 15 of 15
23. Japan Coast Guard. Nishinoshima Volcano. 2020. Available online: http://www1.kaiho.mlit.go.jp/GIJUTSUKOKUSAI/
kaiikiDB/kaiyo18-e1.htm (accessed on 26 March 2021).
24. Larrain, R.E.; Schaefer, D.M.; Reed, J.D. Use of digital images to estimate CIE color coordinates of beef. Food Res. Int. 2008,
41, 380–385. [CrossRef]
25. Japanese Standard Association. JIS Handbook; Japanese Standards Association: Tokyo, Japan, 2010; Volume 61. (In Japanese)
26. Tsuchide, M. Thermal distribution and chemical compositions of discolored waters derived from submarine volcanic activities.
Rep. Hydrogr. Oceanogr. Res. 1998, 34, 49–64. (In Japanese)
27. Kaneko, T.; Maeno, F.; Yasuda, A.; Takeo, M.; Takasaki, K. The 2017 Nishinoshima eruption: Combined analysis using Himawari-8
and multiple high-resolution satellite images. Earth Planets Space 2019, 71, 1–18. [CrossRef]
28. Wernand, M.R.; Van der Woerd, H.J. Spectral analysis of the Forel-Ule Ocean colour comparator scale. J. Eur. Opt. Soc. Rapid Publ.
2010, 5. [CrossRef]
29. Geospatial Information Authority of Japan. 2020. Available online: https://www.gsi.go.jp/BOUSAI/R1_nishinoshima.html
(accessed on 26 March 2021). (In Japanese).You can also read


