Towards integrated, interactive, and extensible text data analytics with
←
→
Page content transcription
If your browser does not render page correctly, please read the page content below
Towards integrated, interactive, and extensible text data analytics with
                                     L EAM
                                                Peter Griggs∗
                                                    MIT
                                             pgriggs@mit.edu

               Çağatay Demiralp∗                                    Sajjadur Rahman
                Sigma Computing                                        Megagon Labs
         cagatay@sigmacomputing.com                               sajjadur@megagon.ai

                       Abstract                                 The characteristics of online text make inter-
                                                             active workflows and visualizations essential for
     From tweets to product reviews, text is ubiqui-         rapid iterative analysis (Ittoo et al., 2016). There-
     tous on the web and often contains valuable in-
                                                             fore we focus on visual interactive text analysis
     formation for both enterprises and consumers.
     However, the online text is generally noisy and         (VITA hereafter) and related systems. Few com-
     incomplete, requiring users to process and an-          mercial and open-source tools can support different
     alyze the data to extract insights. While there         stages of VITA, e.g., spreadsheets, computational
     are systems effective for different stages of           notebooks, and visualization tools (Liu et al., 2018;
     text analysis, users lack extensible platforms          Smith et al., 2020). Customized visual text an-
     to support interactive text analysis workflows          alytics tools focus on specific use-cases like re-
     end-to-end. To facilitate integrated text an-
                                                             view exploration (Zhang et al., 2020a), sentiment
     alytics, we introduce L EAM, which aims at
     combining the strengths of spreadsheets, com-           analysis (Kucher et al., 2018), and text summa-
     putational notebooks, and interactive visual-           rization (Carenini et al., 2006). None of these
     izations. L EAM supports interactive analy-             solutions accommodate the inherently cyclic, trial-
     sis via GUI-based interactions and provides             and-error-based nature of VITA pipelines end-to-
     a declarative specification language, imple-            end (Drosos et al., 2020; Wu et al., 2020).
     mented based on a visual text algebra, to en-              Designing and building VITA systems can be
     able user-guided analysis. We evaluate L EAM
                                                             difficult. The primary challenge is the number and
     through two case studies using two popular
     Kaggle text analytics workflows to understand           diversity of the tasks that need to be supported.
     the strengths and weaknesses of the system.             Programmatic tools such as computational note-
                                                             books can provide extensibility and expressivity
1    Introduction                                            to incrementally build such support but they often
                                                             lack in interactivity and do not facilitate direct data
The growth of e-commerce has contributed to
                                                             manipulation, impeding analysis.
the proliferation of digital text, particularly user-
                                                                In response, we propose L EAM , that provides
generated text (reviews, Q&As, discussions),
                                                             an integrated environment for VITA. L EAM com-
which often contain useful information for improv-
                                                             bines the advantages of spreadsheets, computa-
ing the services and products on the web. Enter-
                                                             tional notebooks, and visualization tools by inte-
prises increasingly adopt text mining technologies
                                                             grating a Code Editor with interactive views of raw
to extract, analyze, and summarize information
                                                             (Data View) and transformed data (Chart View).
from such unstructured text data. However, online
                                                             Figure 1 shows a snapshot of L EAM. A key compo-
text collections are incomplete, ambiguous, and
                                                             nent in the design of L EAM is the instrumentation
often sparse in informational content. Cleaning,
                                                             of text analysis operations via VITAL, a python
featurizing, modeling, visualizing, extracting infor-
                                                             API. These built-in operations can also be used
mation from, and identifying topics in such text
                                                             directly from the interactive Operations Menu. To
collections can be daunting and time-consuming
                                                             evaluate L EAM, we conduct two case studies using
without integrated systems that take the whole text
                                                             two popular Kaggle text analytics workflows. The
analytics pipeline into account.
     DaSH-LA 2021, June 11, 2021, Virtual Conference.            *Work done while authors were at Megagon Labs.

                                                        52
       Proceedings of the 2nd Workshop on Data Science with Human in the Loop: Language Advances, pages 52–58
                             June 11, 2021. ©2021 Association for Computational Linguistics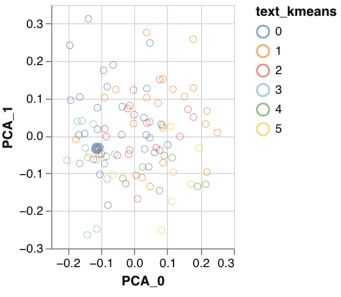
A

     B

     In[1]:   # Load dat aset and select t he "review " column
              dat a = VTA("review s.csv", st art ed=True)
                                                                   D   C
              col = dat a.get _column("review ")

     In[2]:   # creat e UDF
              col.project ().low ercase()
              col.project ().remove_punct uat ion()
              col.project ().remove_st opw ords()
              new _col = col.mut at e().t f _idf ()
              col2 = dat a.get _column(new _col)
              new _col = col2.project ().pca()
              col3 = dat a.get _column(new _col)
              col3.project ().indices([0,1])
              col2.mut at e().kmeans()

     In[3]:   # view barchart
              col2.aggregat e().w ord_scores("f eat ure_labels")
              col2.visualize("t w _barchart ", "t op_scores")

Figure 1: L EAM user interface. (A) Operations Menu enables users to perform visual interactive text analytics (VITA)
operations using drop-down menus, (B) Chart View holds a carousel of interactive visualizations created by users, (C) Data View
displays the data and its subsequent transformations, and (D) Code Editor allows users to compose and run VITA operations
using a declarative specification called VITAL.
study showed that participants preferred the inte-                              Computational notebooks. Computational note-
grated analysis environment and the ability to spec-                            books such as Jupyter (Jupyter, 2020) allow pro-
ify various workflows both interactively (via Oper-                             grammers to interleave code with visualizations.
ations Menu) and declaratively (via VITAL). How-                                This linear layout often introduces a physical dis-
ever, participants asked for enhanced workflow                                  tance between related charts, limiting an analyst’s
transparency and consistency of operations. We                                  ability to derives insights by visually comparing
have released the source-code of L EAM at https:                                different charts. Tools like B2 (Wu et al., 2020) and
//github.com/megagonlabs/leam.                                                  LUX (Lee, 2020), provide a non-linear interface
                                                                                where charts are placed in a separate visualization
2    Related Work                                                               pane. While L EAM shares the same principle, it
                                                                                additionally features a Data View and enables co-
L EAM draws from prior work on interactive text
                                                                                ordination between visualization and the data—a
analysis, computational notebook, and declarative
                                                                                desirable property of such interactive programming
specification of analysis workflows.
                                                                                environments (Chattopadhyay et al., 2020).
Interactive visual text analytics. Prior research
on visual text analytics have limitations in flexibil-                          Declarative data analysis and visualization.
ity and extensibility due to their fixed choices of                             Prior work on data analysis workflow specifica-
models, visualizations, and interactions (Kucher                                tion focused on several different stages, from data
et al., 2018; Liu et al., 2018). L EAM adopts the                               cleaning to exploration. To support data cleaning,
vision of a VITA system outlined in our prior                                   Wrangler (Kandel et al., 2011) combines a mixed-
work (Rahman et al., 2020). In this paper, we                                   initiative interface with a declarative transforma-
primarily focus on expressivity (e.g., declarative                              tion language. Text Extension python library (Co-
workflow specification), resusability (e.g., reusing                            dait, 2021) enables users to operate on intermedi-
operators and models), on-demand coordination                                   ate data, e.g., spans and tensors, in all phases of an
(e.g., linking visualizations and data), and trans-                             NLP workflow. Grammars of graphics like Vega-
parency (e.g., GUI interaction logging).                                        Lite (Satyanarayan et al., 2016) and ggplot2 (Wick-

                                                                           53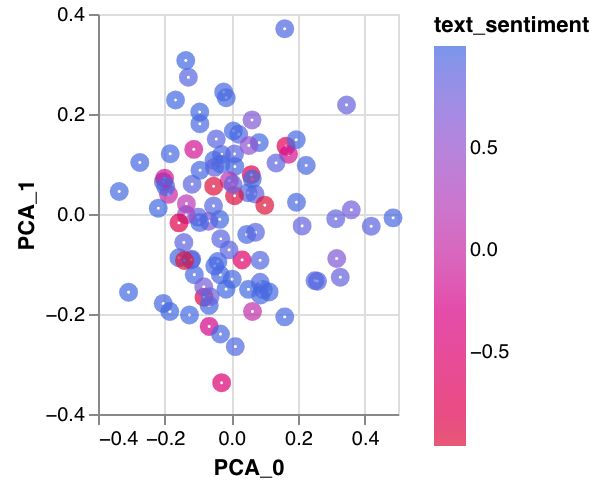
ham, 2016) support visualization specification via                            D5. Ensure transparency of operations. VITA
abstractions, e.g., JSON. However, users cannot                               systems should ensure transparency of interactions
dynamically add new interactions to the visual-                               on the interface—effect of direct manipulation and
izations using these abstractions. L EAM enables                              programmatic interactions should be immediately
users to add new interactions to visualizations and                           visible via visual cues or prompts.
create coordination among data and visualizations
on-the-fly using declarative specifications devel-                            4          L EAM User Interface
oped based on grammar for visual text analysis                                The four key components of the interface are a
introduced in our prior work (Rahman et al., 2020).                           Code Editor, an Operations Menu, a Data View,
                                                                              and a Chart View. We discuss how these compo-
3       Design Considerations
                                                                              nents enable integrated visual text analysis (D1).
We now outline our design considerations for cre-                                 In[1]: # Load dat aset and select t he "review " column
                                                                                         dat a = VTA("review s.csv", st art ed=True)
ating L EAM. Table 1 shows which of these de-                                            col = dat a.get _column("review ")

                                                                                                                                             Clean
sign considerations are supported by existing tools                               In[2]: # clean column cont ent
                                                                                         col.project ().st rip_ht ml()
                                                                                         col.project ().remove_emoji()
discussed in Section 2. These design consider-                                           col.project ().low ercase()
                                                                                         col.project ().correct _spellings()
                                                                                                                                                          (b) Cleaning operations
ations were informed by prior work on identify-                                   In[3]: # ceat e a new column w it h review t f - idf
                                                                                         new _col = col.mut at e().t f _idf ()
                                                                                                                                            Featurize

ing challenges related to live programming inter-                                        col2 = dat a.get _column(new _col)

                                                                                  In[4]: # access met adat a t o visualize t op w ords      Visualize

faces (Chattopadhyay et al., 2020; Rule et al., 2018;                                    col2.aggregat e().w ord_scores("f eat ure_labels")
                                                                                         col2.visualize("barchart ", "t op_scores")

Kery et al., 2020), studies on exploratory data sci-                                                   (a) VITAL commands                               (c) Featurization operations

ence practices (Alspaugh et al., 2018; Kery et al.,
                                                                              Figure 2: (a) Users writes scripts in Code Editor using the
2018; Zhang et al., 2020b), and guidelines for mul-                           VITAL API for cleaning, featurizing, and visualizing data.
tiple coordinated view design (Wang et al., 2000),                            Alternatively, users can also utilize the operators in Operations
                                                                              Menu, e.g., cleaning (b) and featurization (c).
and refined through our experiences working with
user-generated text data at M EGAGON L ABS:                                   Code Editor and Operations Menu. While the
                                                                              Code Editor design (see Figure 1C) is inspired by
         Design               Notebooks        Visualization    VITA
        Crietria        Jupyter   LUX     B2    Platforms      (L EAM)
                                                                              computational notebooks, it only supports writ-
    D1/D2. Code           X        X      X         x             X           ing, editing, and executing scripts—visualizations
    D1. Visualization     X        X      X         X             X
    D1. Data               x        x     x         x             X           and data tables are displayed separately in Chart
    D3. On-demand
    Coordination
                          x        x      x         x            x            View and Data View, respectively. The multi-
    D4. Reusability       x        x      x         x            X            view representation is intended to help users relate
    D5. Transparency      x        x      X         x            x
                                                                              their workflows with the underlying data and their
Table 1: Unlike existing tools, L EAM supports all of the
design considerations (D1 − D5) outlined in Section 3.                        visualizations—a benefit of multiple coordinated
                                                                              views. Users can write scripts in the Code Editor
D1. Enable integrated analytics. VITA systems
                                                                              in Python. We also implement a Python-based
should provide a single platform where users can
                                                                              visual interactive text analysis library, VITAL,
directly manipulate (spreadsheets) and visualize
                                                                              for issuing various text analysis and visualization
(visualization tools) data while writing codes (note-
                                                                              operations in the Code Editor (discussed in Sec-
books) without context switching between tools.
                                                                              tion 5). These operations are derived from an alge-
D2. Specify operations declaratively. VITA sys-                               bra for visual text analysis introduced in our prior
tems should provide an expressive specification                               work (Rahman et al., 2020). Users can also utilize
language to represent and communicate the entire                              the Operations Menu to execute built-in text analy-
breadth of workflows within the domain.                                       sis and visualization operations. Figure 2a shows
D3. Facilitate on-demand coordination. Within                                 an example workflow in the Code Editor consisting
an integrated environment, VITA systems should                                of data cleaning, featurization, and visualization
enable users to specify coordination between all                              operations. Users can also perform these opera-
the available views on demand.                                                tions from Operations Menu without writing any
D4. Ensure reusability of operations. Users                                   scripts (see Figure 2b, and 2c).
should be able to craft their analysis pipeline and                           Data View. Data View (see Figure 1C) shows a
share and reuse the workflow across use-cases.                                tabular representation of the underlying data. The

                                                                         54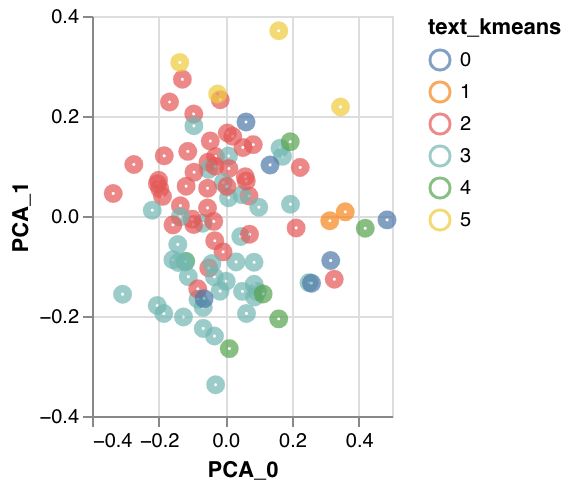
underlying data structure in L EAM is a dataframe. within the interface (coordination), and creat-
Data View is kept in sync with the dataframe— ing new operators by combining existing ones
any changes made to the dataframe is immediately (composition). The JSON-style specification for-
reflected in Data View (D3). For example, in Fig- mat of VTA is quite different from scripting lan-
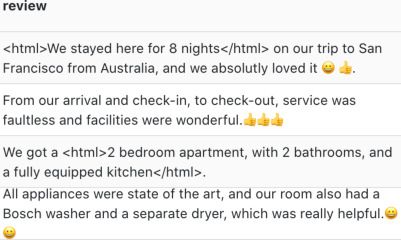
ure 3 when a user cleans the review column in guages widely used by analysts, such as R and
the dataframe, the corresponding cleaned data is Python. Composing operations in VTA can be
displayed in the Data View. In traditional script- cumbersome as users are required to specify multi-
based systems like computation notebooks, users ple nested objects. Therefore, we have developed
are required to explicitly specify a print operation VITAL for declaratively specifying VTA com-
to view and inspect data. mands in Code Editor of L EAM (D2). The VITAL
commands are compiled and executed by the back-
end Python runtime of L EAM. We show several
examples of VITAL commands that implement
the VTA operators as well as newly introduced
features next.
(a) Noisy text (b) Cleaned text
In[1]: # Load dat aset and select t he "review " column col2.visualize("barchart ", "t op_scores")
dat a = VTA("review s.csv", st art ed=True)
Figure 3: As (a) user performs various cleaning operations col = dat a.get _column("review")
on the “review” column as shown in Figure 2, (b) the cleaned In[2]: # creat e UDF
Create UDF
def get _ngrams(corpus, t op_k, n):
column data is immediately displayed in Data View (D3). vec = Count Vect orizer(ngram_range=(n, n)).f it (corpus)
bow = vec.t ransf orm(corpus)
sum_w ords = bow .sum(axis=0)
Chart View. L EAM enables users to generate vi- w ords_f req = [(w ord, int (sum_w ords[0, idx]))
f or w ord, idx in vec.vocabulary_.it ems()]
(b) Chart creation
dat a.get _vis(0).select ion("f unny")
w ords_f req = sort ed(w ords_f req,
sualizations either from the Code Editor or Oper- key = lambda x: x[1], reverse = True)
ret urn dict (w ords_f req[:t op_k])
ations Menu and displays those visualizations in In[3]: # add and t hen apply UDF Apply UDF
dat a.udf ().add(get _ngrams)
the Chart View (see Figure 1B). Unlike compu- col.udf ().apply("get _ngrams", 10, 2, md_t ag="ngrams")
(b) UDF creation (c) Single bar selection
tation notebooks, where analyzing visualizations
in distant cells can be cumbersome, the side-by- Figure 4: Declarative specification (D2): (a) using VITAL
user creates and applies a UDF to compute top-K n-grams of
side presentation of charts in Chart View enables reviews. Transparency (D5): (b) user generates a barchart of
users to compare and analyze related visualization top words from Operation Menu which is logged as a VITAL
script in Code Editor. Coordination (D3): (c) a user selected
without scrolling. We create the visualizations by bar is highlighted on-demand.
extending Vega-Lite (Satyanarayan et al., 2016).
These visualizations can be generated from Oper- 5.2 Towards Integrated Text Analysis
ations Menu or using VITAL commands and can We now explain how users can perform text analy-
be dynamically updated to add new interactions sis in L EAM.
(discussed in Section 5).
5.2.1 User-guided Analysis
5 Visual Text Analysis Using L EAM In Figure 2, we show how a user can analyze a text
reviews dataset using various VITAL commands
The text analysis operations in L EAM are devel- or menu operations like project (data cleaning)
oped based on a visual text algebra, VTA (Rahman and mutate (featurization). Moreover, users can
et al., 2020). L EAM provides a Python API called also combine multiple existing operators to declar-
visual interactive text analysis library, VITAL, that atively specify user-defined operators (D2). For
enables users to write VTA commands in Code example, as shown in Figure 4, a user creates a
Editor. We now briefly introduce VTA and then new function to generate top n-grams in a given
demonstrate the corresponding specification library text corpus and then uses VITAL to load and then
VITAL that we have developed. apply the UDF. Users can use the visualize com-
mand to create visualizations of the underlying
5.1 VTA Operators and VITAL
data (see Figure 4b) and interactions (Figure 4c).
VTA supports various operators for selecting a
subset of the data (selection), transforming se- 5.2.2 Programmatic Coordination
lected data into various representations for analysis A key feature of L EAM is the ability to dynami-
(transformation), coordinating different views cally add coordination to existing visualizations
55using VITAL (D3). Existing libraries like Vega- 6 L EAM Architecture
Lite only allow users to predefine the visualization
and corresponding interactions without supporting L EAM is developed as a web application and is
any dynamic coordination specification. implemented using ReactJS and Flask framework.
We depict the architecture in Figure 6. L EAM client
is responsible for capturing user input, and for
rendering the views based on results returned by
the back-end. Given any user interaction on the
front end, the L EAM Request Processor issues a
request to the backend L EAM Controller. This
barchart .bi_link("t able") controller manages the uploaded data and sessions
barchart .select("gif t ")
while propagating user interactions to the session
manager.
Figure 5: To relate a word in the chart with reviews both in
Data View and the scatterplot (D3), the user issues a VITAL CLIENT SERVER
command in Code Editor (see inset). Clicking a bar in the System-X Contr oller VITAL Compiler
barchart filters reviews in Data View and highlights relevant
reviews in the scatterplot. VITAL Scr ipts Fr ontend
Session Manager VITAL Executor
Visual Inter actions Request
Menu Oper ations
Pr ocessor
As shown in Figure 4c, users can update the Data Oper ations
selection type of the barchart in Figure 4b to en- Session Var iables
Task Queue
able single bar selection. Moreover, using VITAL, data = VTA(" xyz" ) DataFr ame
Metadata
users can also dynamically specify external coordi- c1 = data.get_col()
c1.pr oject().clean() View Cache
nations (a) among charts in the Chart View and (b) c1.mutate().tf_idf() Coor dination Gr aph
between Data View and charts. Vega-Lite does not
provide a formal interaction grammar for such ex- Figure 6: L EAM architecture. The front-end is a web ap-
plication. The back-end features various components such as
ternal coordination. For example, Figure 5 shows task queue, coordination graph, VITAL compiler, and execu-
how users can enable coordination between the tor to handle and execute user requests.
barchart, scatterplots, and data. Such dynamicity
The session manager interprets the user
allows users to augment the visualizations instead
interaction—any interactions on the Operations
of recreating charts and connect different views on
Menu is sent to a lightweight VTA Compiler while
demand to investigate data relationships. L EAM
the VITAL commands on the Code Editor are
maintains a coordination graph to keep track of the
pushed in a task queue. The VTA compiler trans-
linked views, which we discuss in Section 4.
lates the user-selected operator to a VITAL com-
5.2.3 Reusability and Transparency mand which is then executed by the VTA Execu-
Both VITAL and Operation Menu enable users tor. L EAM backend employs a Task Queue to
to issue both analysis and coordination operations keep track of the VITAL commands in Code Edi-
across different projects and workflows. More- tor. L EAM session manager also employs a View
over, users can add their UDFs as new operators Cache to track the states of the front end views.
to VITAL and menu operations using the add_UDF L EAM employs a Coordination Graph to manage
command (see Figure 4a), thus ensuring reusabil- coordination among linked views—for any inter-
ity (D4). Users can also upload pre-trained models action on a view, all the views in its adjacency list
(e.g., classification, regression) from Operations are updated. For example, selecting a bar in the
Menu and then access and reuse the models using barchart in Figure 5 updates the scatterplot and
the get_model and predict commands. To en- Data View in its adjacency list.
sure transparency of the user interactions (D5) on
the Operation Menu, L EAM logs the corresponding 7 Case Studies
VITAL command in a new cell in Code Editor (see
Figure 4b). The logging feature enables users to To assess the impact of L EAM in performing vi-
track their interactions, debug the logs if required, sual text analysis and collect early feedback, we
and re-execute those interactions. evaluated it through two case studies.
567.1 Study Design and Tasks
Design. The study consisted of three phases: (a)
an introductory phase to help participants familiar-
ize themselves with L EAM, (b) a workflow execu-
tion phase where the participants used L EAM to Figure 7: Bigram visualizations on Tweets dataset (Kaggle,
implement a text analysis workflow, and (c) a semi- 2021a) cleaned with a UDF. Users can immediately see the
structured interview to collect qualitative feedback impact of the cleaning operation: (a) before and (b) after
applying the UDF.
regarding L EAM.
Participants also appreciated the ability to vi-
Participants. We recruited two participants within sualize the impact of their operations. Figure 7a
our professional network. Participant Pa was a re- displays a bi-gram visualization of the unprocessed
searcher in natural language processing with exten- tweets. After applying the cleaning operator on the
sive experience in review analysis and designing tweets, the visualization was automatically updated
personal assistants and conversational bots. Partic- (see Figure 7b). Such dynamic coordination high-
ipant Pb was a software engineer with experience lights the importance of supporting context switch-
in NLP pipelines and text analysis. ing between stages in the data science pipeline,
Tasks. We selected a spam detection work- such as cleaning and visualization.
flow (Kaggle, 2021b) and a tweet analysis work- Participants also provided feedback for improve-
flow (Kaggle, 2021a) from Kaggle, that are related ment. The most frequently raised issue was the
to analyzing user-generated text as the respective need for improved communication of errors and
tasks of our use cases. We chose the workflows the support for debugging, a requirement identi-
based on their popularity and relevance to every- fied in earlier work (Chattopadhyay et al., 2020).
day text data analytics workflows in practice. For Moreover, participants were occasionally confused
both the workflows, participants were provided pre- about the effects of their operations, suggesting
trained models. They were asked first to explore the need for visual guidance and better cues. Re-
and preprocess a separate test dataset and then clas- cent work explores such error detection methods
sify the data using the respective pre-trained model. for computational notebooks (Macke et al., 2021).
For the preprocessing tasks, participants had to cre- Participants also pointed out a few syntactic incon-
ate a UDF. Participants were free to use any feature sistencies of VITAL commands and suggested a
of L EAM or write code in Code Editor. more consistent design for ease of learning.
7.2 Observations 8 Conclusion and Future Work
Both participants were able to complete their tasks This paper presents L EAM, a tool that enables users
with varying degrees of help from the experi- to perform interactive text analysis in-situ. Our
menters. Participants appreciated the ability to per- declarative specification API VITAL provides sup-
form the analysis both using Operations Menu (in- port for a suite of operators to author diverse VITA
teractive) and Code Editor (declarative). They also workflows on-demand and enable different modes
found the user interface of L EAM more structured, of interactive coordination among views. Prelim-
commenting on the “messiness” of analysis using inary evaluation of L EAM highlights the benefits
computational notebooks, also highlighted in prior of integrating multiple views, supporting both in-
work (Alspaugh et al., 2018). Moreover, partici- teractive and declarative specification of tasks, en-
pants found having visualizations within their eye- abling reusability of operations, and ensuring trans-
sight without the need for scrolling up and down parency of interactions. While the initial results
useful, a benefit of integrating multiple views (Rah- are promising, there is room for improvement in
man et al., 2021). They appreciated the ability to adding more transparency and providing wider op-
specify interactive coordination between visual- erations coverage. L EAM can further benefit from
izations and Data View using VITAL. Pa appreci- addressing challenges related to scalability, work-
ated the ability to reuse operations from Operations flow optimization, and version control that related
Menu for bootstrapping the analysis. work also explores.
57References Liu et al. 2018. Bridging text visualization and mining:
A task-driven survey. IEEE TVCG, 25(7):2482–
Sara Alspaugh, Nava Zokaei, Andrea Liu, Cindy Jin, 2504.
and Marti A Hearst. 2018. Futzing and moseying:
Interviews with professional data analysts on explo- Stephen Macke, Hongpu Gong, Doris Lee, Andrew
ration practices. IEEE transactions on visualization Head, Doris Xin, and Aditya Parameswaran. 2021.
and computer graphics, 25(1):22–31. Fine-grained lineage for safer notebook interactions.
Proceedings of the VLDB Endowment, 14(6):1093–
Carenini et al. 2006. Interactive multimedia sum- 1101.
maries of evaluative text. In IUI, pages 124–131.
Sajjadur Rahman, Mangesh Bendre, Yuyang Liu,
Souti Chattopadhyay, Ishita Prasad, Austin Z Henley, Shichu Zhu, Zhaoyuan Su, Karrie Karahalios, and
Anita Sarma, and Titus Barik. 2020. What’s wrong Aditya Parameswaran. 2021. Noah: Interactive
with computational notebooks? pain points, needs, spreadsheet exploration with dynamic hierarchical
and design opportunities. In Proceedings of the overviews. Proceedings of the VLDB Endowment,
2020 CHI Conference on Human Factors in Com- 14(6):970–983.
puting Systems, pages 1–12.
Sajjadur Rahman, Peter Griggs, and Çağatay Demiralp.
Codait. 2021. Text extensions for pandas. 2020. Leam: An interactive system for in-situ visual
text analysis. In Conference on Innovative Data Sys-
Ian Drosos, Titus Barik, Philip J Guo, Robert De- tems Research.
Line, and Sumit Gulwani. 2020. Wrex: A unified
programming-by-example interaction for synthesiz- Adam Rule, Aurélien Tabard, and James D Hollan.
ing readable code for data scientists. In ACM Hu- 2018. Exploration and explanation in computational
man Factors in Computing Systems (CHI), pages 1– notebooks. In Proceedings of the 2018 CHI Con-
12. ference on Human Factors in Computing Systems,
pages 1–12.
Ashwin Ittoo, Antal van den Bosch, et al. 2016. Text
analytics in industry: Challenges, desiderata and Satyanarayan et al. 2016. Vega-lite: A grammar of
trends. Computers in Industry. interactive graphics. IEEE TVCG, 23(1):341–350.
Project Jupyter. 2020. Project jupyter. Smith et al. 2020. The machine learning bazaar: Har-
nessing the ml ecosystem for effective system devel-
Kaggle. 2021a. Basic eda, cleaning and glove. opment. In ACM SIGMOD, pages 785–800.
Kaggle. 2021b. Simple eda with data cleaning & Wang et al. 2000. Guidelines for using multiple views
glove. in information visualization. In Proceedings of the
working conference on Advanced visual interfaces,
Sean Kandel, Andreas Paepcke, Joseph Hellerstein, pages 110–119. ACM.
and Jeffrey Heer. 2011. Wrangler: Interactive vi-
sual specification of data transformation scripts. In Hadley Wickham. 2016. ggplot2: elegant graphics for
Proceedings of the SIGCHI Conference on Human data analysis. springer.
Factors in Computing Systems, pages 3363–3372.
Yifan Wu, Joe Hellerstein, and Arvind Satyanarayan.
Mary Beth Kery, Marissa Radensky, Mahima Arya, 2020. B2: Bridging code and interactive visualiza-
Bonnie E John, and Brad A Myers. 2018. The story tion in computational notebooks. In ACM UIST.
in the notebook: Exploratory data science using a lit-
erate programming tool. In Proceedings of the 2018 Zhang et al. 2020a. Teddy: A system for interactive
CHI Conference on Human Factors in Computing review analysis. In SIGCHI, pages 1–13.
Systems, pages 1–11.
Ge Zhang, Mike A Merrill, Yang Liu, Jeffrey Heer,
Mary Beth Kery, Donghao Ren, Kanit Wongsupha- and Tim Althoff. 2020b. Coral: Code represen-
sawat, Fred Hohman, and Kayur Patel. 2020. The tation learning with weakly-supervised transform-
future of notebook programming is fluid. In Ex- ers for analyzing data analysis. arXiv preprint
tended Abstracts of the 2020 CHI Conference on Hu- arXiv:2008.12828.
man Factors in Computing Systems, pages 1–8.
Kucher et al. 2018. The state of the art in sentiment
visualization. In Computer Graphics Forum, vol-
ume 37, pages 71–96. Wiley Online Library.
Doris Lee. 2020. Lux: A python api for intelligent
visual discovery.
58You can also read


