Workflow model for big data analysis and visualization
←
→
Page content transcription
If your browser does not render page correctly, please read the page content below

ISSN: 2766-9823                                                                                                Volume 3, 2021

              Workflow model for big data analysis and
                          visualization
                                                              Stella Vetova
                                                         Department Informatics
                                                       Technical University of Sofia
                                                             Sofia, Bulgaria
                                                         vetova.bas@gmail.com

    Abstract—The presented report includes workflow model for               time and providing ease of decision making in the process of
biomedical data. The proposed model is a solution for the case study        disease diagnosis and treatment, classification and detection.
of two-dimensional data classification. The experiments are
conducted using distance computing techniques: Euclidean distance,              On the other hand, as a part of hosting (Amazon), big data
Manhattan Distance, Cosine Distance. The result values show the             is also protected against threats in the cloud [5] and the
percentage of accurately classified images for the three distance           network [6], [7] through encryption algorithms.
measures. In addition, the paper also presents a workflow model as a
solution for prediction problems. The experiments are performed to              The following paper presents a brief overview of the
compute efficiency and probability of heart disease occurrence using        methods and algorithms for big data workflow analysis,
Logistic Regression, Decision Tree, Random Forest and Naïve Bayes           visualization and interpretation in the field of biomedicine. It
techniques. The results show the advantages and disadvantages of the        is organized as follows. Section 2 is divided into two
included methods.                                                           subsections: Subsection A introduces methods and algorithms
    Keywords—biomedicine, bioinformatics, big data workflow,                for big data workflow analysis in biomedicine and subsection
3D model, workflow analysis, biomedical data analysis and                   B introduces methods and algorithms for visualization and
visualization                                                               interpretataion of big data workflows in biomedicine. Section
                                                                            3 presents the workflow models for biomedical data
                       I. INTRODUCTION                                      processing for the cases of Distance-Based Image
    The development of high technology, science, business,                  Classification and Prediction-Based Workflow Model along
medicine, biomedicine [1], bioinformatics [2], agriculture,                 with the experiments performed and obtained results in
biology [3], etc. leads to the emergence of big data. It is a               subsections A and B respectively. Section 4 concludes the
generated heterogeneous amount of data used for future                      paper.
processing. Big data has four basic features: complexity,                                       II. RELATED WORK
variety, volume and application opportunities. In the field of
medicine big data is gained on the base of the separate                     A. Methods and Algorithms for Big Data Workflow
components of clinical workflow such as laboratory results,                     Analysis in Biomedicine
clinical test and patients’ exams, symptoms data captured by                    The applied methods for ML models design are based on
the means of telemedicine, etc. The technical apparatuses                   groups of methods referring clustering, instance computation,
needed for image information gathering varies in a great                    decision making, deep learning (DL) [8], [9] which is largely
range. Up to date ones of the most often used methods are: X-               used in finding solution of the biomedicine problems,
Ray, Ultrasound, Magnetic Resonance Imaging (MRI) and                       Bayesian models, image compression, etc. More particularly
Computed Tomography (CT) producing images in DICOM                          the groups include k-Means partitioning algorithm, k-medoids
format. In this case, big data requires technical support and               algorithm [10], k-Nearest Neighbor (KNN), hierarchical
devices capable of fast data processing and interpretation                  clustering [11] including Unweighted Pair Group Method
which is hard to be reached using the traditional tools. Thus,              with Arithmetic Mean (UPGMA), the NeighborJoining (NJ)
being in help of the physicians, workflows for big data                     method, and the Fitch and Kitsch method [10], Self-
analysis and visualization can be designed integrating the                  Organizing Map (SOM), Conditional Decision Trees, KD-
methods of Artificial Intelligence (AI) and Machine Learning                Trees data structure [12], Deep Boltzmann Machine (DBM),
(ML).                                                                       Convolutional Neural Network (CNN) [13], Support Vector
    Workflow for science is a sequence of functions defined                 Machine (SVM) [14]. In regard to image compression
to perform single task. United in a system scientific workflow              losseless image compression is preferable since in medicine
computes complex tasks and represents a complex software                    domain the slightest detail is of great importance. This
application which may require a long period of time to do the               compression group includes entropy encoding, such as the
calculations [4]. Its basic stages, specifically in the                     Shannon-Fano algorithm, Huffman coding, arithmetic coding,
biomedicine, bioinformatics, biology domain, etc. include                   Lempel-Ziv-Welch algorithm [14].
data visualization and analysis based on the principles of                      In addition, Eric P. Xing, Qirong Ho, Pengtao Xie, Dai
segmentation, diagnosis and therapy. Using the obtained data,               Wei [15], make an overview of the design principles of the
workflows are applied for complex automatic analysis in the                 distributed ML systems. They point out iterative-convergent
strive to improve the interpretation and reporting, reducing                ML group of algorithms including the structured sparse

                                                                       99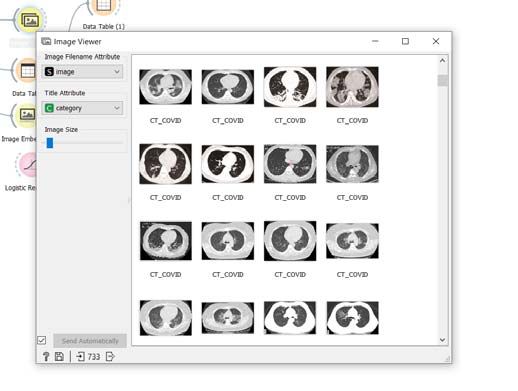
ISSN: 2766-9823                                                                                                Volume 3, 2021

regression ML algorithm family and particularly Lasso                       private cloud is constructed to contain images and the option
regression. The second algorithm they discuss is Latent                     for work with workflow platforms Galaxy, Chipster and
Dirichlet allocation from the graphical models ML algorithm                 GPCR-ModSim. For the feature counting and quality
family. In their work the authors also pay attention to the                 assessment tasks in RNA-seq analysis a solution is offered
properties of ML programs such as error tolerance necessary                 based on the extension of HTSeq packet using the tools of
for ML programs to avoid errors, dependency structure, non-                 Hadoop and MapReduce. On the other hand, for running
uniform convergence as properties providing balance between                 pipelines the author points out that Make is applied for both
speed, programmability and correctness. Furthermore, the                    cases of use local and cluster. Snakemake is chosen to be
authors discuss the principles of ML system design such as:                 applied for scientific tests because of its ease of workflow
dependency structures in ML programs, scheduling in ML                      transfer to a cluster, the option for parallelization, Bash code
programs, compute prioritization in ML programs, balancing                  portability, integration with such programming languages as
workloads in ML programs, structure aware parallelization.                  Python, etc. Furthermore, Chipster is declared to be used for
As a part of the continuous communication strategy update                   the scenario of analysis of RNA-seq data and ChIP-seq data.
prioritization, parameter storage and communication
topologies are described.                                                       In [31] performance evaluation of scientific workflows is
                                                                            discussed. A lightweight metric for evaluation of synthetic
    In its traditional form a workflow design starts with the               workflow performance is proposed and tested in two different
data inputs and continues through a sequence of functions                   cases of in situ workload execution using GROMACS
which computations result in data outputs. A main drawback                  molecular dynamic application.
of the workflows is the lack of opportunity for reusing
workflows. Typical workflow design tools include: Galaxy                        Michael T.Krieger et al. [32] discuss two ideas. The first
[16], [17], [18], the sharing workflow platform                             one refers to the notion to construct full cloud stack including
myExperiment, Taverna [19], [20] MapReduce, Hadoop,                         IaaS, PaaS, SaaS on an open source technology. In addition,
Spark, GraphLab, Pregel [15], Closha [21], Preglix [22],                    the authors propose a strategy to design workflows using
GraphX [23], and PEGASUS [24], [25], Kepler, Chipster                       Galaxy framework. The feasibility and performance
[26], Disco [27], Tavaxy [28], e UGENE Workflow Designer                    guaranteed using the proposed method are demonstrated
[29].                                                                       through applications for the cases of bioinformatics and
                                                                            biomedicine.
    In [25] Riazi and Norris present a toolkit for workflow
design called GaphFlow. It is based on tools compatible with                   TABLE I.      METHOS, ALGORITHMS AND TOOLS FOR BIG DATA
Galaxy and allows conducting science experiments with                                                 ANALYSIS
complex data where Spark components are used for the
workflow design. To process data, the proposed architecture
relies on a cluster system using a Spark master node. The                                                           k-medoids
GraphFlow includes I/O tools, tools for performing graph                                                            algorithm;
analysis, relational tools, plotting tools. A feature of
GraphFlow is returning a log output file. It is a text file                                                         k-Means
compatible with Galaxy containing output dataframes and the                                                         partitioning
tool execution log. The architecture is designed to convert                                                         algorithm;
single file data into dataframes and vice versa. It has the ability                                                 k-Nearest Neighbor
to use the metafile constructed on the base of the users’ data                                                      (KNN);
for the cases when users upload their data to the cloud storage.
                                                                                                   Clustering       Unweighted   Pair
In this case the MetaLoader component of I/O tools is
provided. Furthermore, to generate and process graphs the                                                           Group Method with
proposed architecture uses nine specified algorithms such as:                                                       Arithmetic  Mean
GraphGen, PageRank used for rank assessment, DegreeCount                                                            (UPGMA);
for degree computation, TriangleCount used for triangle count                                                       Neighbor-Joining
computation, SubGraph applied for the cases when a subgraph                     Methods                             (NY) method;
of the original graph is needed to be constructed, LargestCC
used to output the designed subgraph of the largest connected                                                       Fitch and      Kitsch
elements of the original one. For the cases of clustering the                                                       method;
GraphFlow is based on the algorithms GraphCluster,
ClusterEval for assessment of the clustering quality,                                                               Euclidean distance;
GraphCoarsen for simplifying a big graph, PIC, spectral                                                             Hamming distance;
                                                                                                   Instance
clustering, label propagation. On the other hand, components
                                                                                                 computation        Manhattan distance;
of the relational tools are responsible for the transformation of
dataframes. Relational tools are based on SQLwhen it comes                                                          Minkowski distance;
to query. The statistics tools of the GraphFlow has the task to
gather statistics data from the dataframe where cumulative                                                          Self-Organizing
density function (CDF) is used for data distribution analysis.                                      Decision        Map (SOM);
As plotting tools ScatterPlot and HistogramPlot are                                                 Making
added[25].                                                                                                          Conditional
                                                                                                                    Decision Trees;
   Spjuth [26] states that for the bioinformatics data
processing the scripting languages Bash, Perl [30] and Python
are most often used for automate analysis. In addition, a

                                                                      100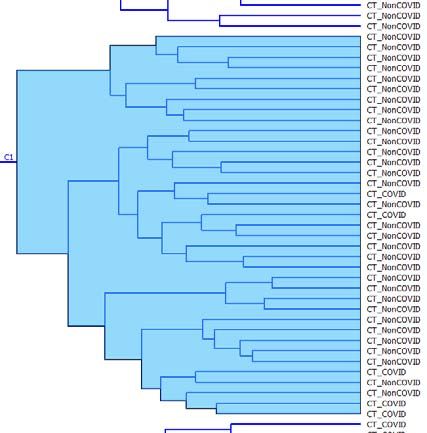
ISSN: 2766-9823                                                                                              Volume 3, 2021

                                       Convolutional                 B. Methods and Algorithms for Visualization and
                                       Neuron Networks                   Interpretataion of Big Data Workflows in Biomedicine
                Deep Learning          (CNN);                            The emergence and growth of big data, especially in the
                                       Deep     Boltzmann            fields of medicine, biomedicine, bioinformatics, require its
                                       Machine;                      visualization. This provokes the design of visualization tools.
                                                                     In workflow analysis there are four basic stages of data
                                       Regularized                   processing. They include: data storage, data processing,
                      Bayesian         Bayesian models;              querying, data analysis and classification, visualization [33].
                       models          Nonparametric                      Julien Wist [34] presents a web solution for big data
                                       Bayesian models;              processing and visualization working in offline mode. To this
                                                                     end, data and a constructed function for visualization are
                Relational DBs         SQL;
                                                                     needed where the programming languages for data analysis
                      Data             Cumulative                    and for visualization can be different. The visualizer package
                  Distribution         Distribution                  includes also the general concept to process and change the
                   Analysis            Analysis (CDF);               input data and to store the result as an output variable. In
                                                                     addition, for the cases when relation between the objects exists
                The structured                                       it is possible to add the same unique tag and thus tracing the
                    sparse                                           position of the mouse. The proposed approach is based on Java
                regression ML          Lasso regression;             Script.
                  algorithm
ML Groups           family                                               Rubens et al. [35] present an open-source web tool for
of algorithms                                                        bioimage analysis workflows called BIFLOWS. In addition,
                 The graphical                                       they illustrate a comparison of seven nuclei segmentation
                  models ML            Latent      Dirichlet         workflows. BILFLOWS is dedicated to work with aforetime
                  algorithm            allocation;                   annotated multidimensional microscope visual data. It is a
                    family                                           framework with the following main features: first, import of
                                   Galaxy;                           image databases containing annotation and their organization
                                                                     as bioimage analysis tasks. Second, bioimage analysis
                             myExperiment                            workflow encapsulation, third, image processing and
                                                                     visualization in combination with the results and finally,
                                   Taverna
                                                                     automatic evaluation of the workflows performance.
                                 MapReduce                                In [36] the authors present FAN-C which is a framework
                                   Hadoop                            combining matrix generation, analysis and visualization in the
                                                                     field of bioinformatics. To perform fast matrix access and Hi-
                                    Spark                            C matrix transformations the framework is designed with
                                  GraphLab                           hierarchical storage architecture. Also, FAN-C enables the
                                                                     import of variety of text-based matrix inputs. In regard to
Workflow                            Pregel                           pipelining, the framework supports the option for adaptation
platforms and                                                        of the automated FASTQ-to-matrix pipeline to the
design tools                        Closha
                                                                     requirements of the scientific experiments and Hi-C analysis
                                    Preglix                          performed. Furthermore, the framework enables the running
                                                                     of the pipeline functions separately and enables individual
                                   Pegasus                           setting for each of them. In addition, the users can choose
                                    Kepler                           filters through the Python API which is a component of the
                                                                     framework. It also offers automatically generated diagnostic
                                   Chipster                          plots with filtering statistics which task is informing the user
                                                                     of issues.
                                    Mike
                                                                         Bergenstråhle et al. [37] present the R-based STU utility
                                  GraphFlow                          for bioinformatics. It has the ability to identify spatial patterns
                                   Gromacs                           alignment of tissue images and visualization. As input data the
                                                                     utility works with RNA count and images. The functionality
Storage                      Cloud storage;                          of STU utility covers data analysis, image processing stage
Environment                      Local storage                       and visualization. During the process of image processing a
                                                                     masking procedure to eliminate the background is used. The
                                     Bash                            method applied transforms the low-level image representation
Programming                                                          into superpixels. Then, the K-means clustering algorithm is
                                      R
Languages                                                            performed to classify the areas inside and outside of the tissue.
                                     Perl                            In addition, an iterative closest point algorithm (ICP) is used
                                                                     for the automatic alignment function. For the cases when the
                                    Python                           described function fails manual image alignment is provided.
                                                                     In addition, the aligned images can be organized to construct
                                                                     a 3D model of the tissue on the base of cell segmentation thus,
                                                                     capturing the its morphological structure. As a method for

                                                               101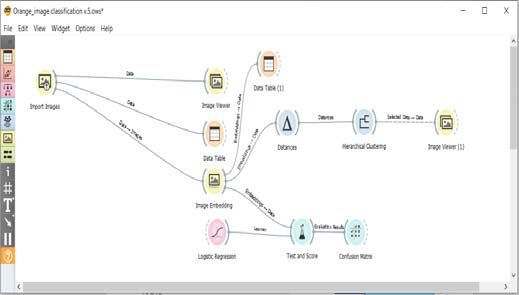
ISSN: 2766-9823                                                                                                       Volume 3, 2021

identification and extraction of neighboring capture-spots and                images respectively. They are distinguished for JPEG and
as a test to rank genes Non-negative Matrix Factorization is                  PNG format. The second one is table-based structured in 14
used for analysis performed.                                                  attributes describing the current state of patients with heart
                                                                              disease.
    Wollman et al. [16] propose workflows for image
processing and analysis for large scale experiments in the field                  The tests are performed in accordance with the tasks for a
of biology. The authors use KNIME and Galaxy as workflow                      framework design for biomedicine via the software for data
systems for the proposed method.                                              visualization, machine learning, data mining and data analysis
                                                                              Orange v. 3.27 on personal computer with the following
   In Fig. 1 and Fig. 2 the visualization tools and methods for               configuration: Intel (R) Core (TM) 2 Duo 2,40 GHz, 64-bit
biomedical image processing are graphically illustrated.                      Operating System. The experiments present two models of
                                                                              workflows for the goal of:
                                    Java Script                                   1.   image classification based on distance computing
                                    web‐vased                                          with three of the most often used metrics: Euclidean
                                       API
                                                                                       distance, Manhattan, Cosine distance and efficiency
                                                                                       evaluation using cross validation method presented in
                                                                                       Fig.3.;
                                                                                  2.   decision tree-based data prediction and logistic
                                                                                       regression-based prediction techniques presented in
                                   Visualization                                       Fig. 13.
        STU‐utility                                           BIFLOWS
                                       tools
                                                                                  With regard to this we computed the percentage of
                                                                              correctly classified instances, ROC AUC area, Classification
                                                                              Accuracy (CA), F1, Precision, Recall and Confusion matrix
                                                                              for the first workflow model and ROC AUC area,
                                                                              Classification Accuracy (CA), F1, Precision, Recall and the
                                                                              occurrence probability for the second workflow model.
                                      FAN‐C
                                                                              A. Distance-Based Workflow Model
                                                                                  For the workflow performance, first the Covid test image
                                                                              database is loaded (Fig. 4). It can be visualized using a
                      Fig. 1. Big data visualization tools
                                                                              visualization tool and its metadata can be displayed using the
                                                                              module Data Table. In the image preprocessing stage features
                                                                              extraction process for image description through deep
                                     Non‐negative Matrix
                                        Factorization
                                                                              network embedding with the Image Embedding component is
                                                                              conducted. The obtained results can be displayed with Data
                                                                              Table where along with image metadata, the image feature
                                     Hierarchical storage
                                         architecture                         vectors are listed (Fig. 5). For the phase of image
                                                                              classification, first cross validation on the base of logistic
                                     Diagnostic Plots with
                                                                              regression method is designed. As a result, the efficiency is
                                      Filtering Statistics                    computed by the measures: ROC AUC area, Classification
                                                                              Accuracy (CA), F1, Precision, Recall and Confusion matric
                      Methods

                                  Conversion from low‐level                   for results interpretation. Similarity computing is performed
                                   images into superpixels                    on the base of three components: Distances which allow the
                                                                              choice of distance measure, Hierarchical Clustering, Image
                                     K‐means clustering                       viewer for classification result visualization.
                                         algorithm

                                    Iterative Closest Point
                                        Algorithm (ICP)

                                      Cell segmentation

                                 Image Lossless Compression

           Fig. 2. Methods for biomedical image processing

    III. WORKFLOW MODELS FOR BIOMEDICAL DATA
                   PROCESSING                                                 Fig. 3. Distance-based image classification workflow with Orange
    For the goal of the experiments conducted, two test image
databases are used: the first one contains 758 Covid images in
grayscale color space. The images are classified into two
groups: Covid positive and Covid negative with 361 and 397

                                                                        102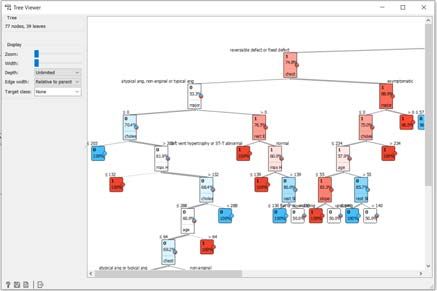
ISSN: 2766-9823                                                                                                            Volume 3, 2021

                                                                                                           Fig. 7. Confusion matrix

                    Fig. 4. Covid test image database

                                                                                          Fig. 8. Covid image classification using Euclidean distance

                  Fig. 5. Image meta data and feature vectors

    According to the results obtained on the base of logistic
regression the efficiency evaluation demonstrates high values
with AUC = 0,852; CA=0,779; F1=0,779, Precision=0,779;
Recall=0,779 as presented in Fig. 6. Fig. 7 presents the
number of correctly predicted number of Covid positive and
Covid negative cases. In addition, Fig. 8 presents the result of
image classification based on Euclidean distance. The result
shows nearly 75% correctly classified items graphically
displayed in Fig. 9. Similarly, in Fig. 10, Fig. 11 and Fig. 12                     Fig. 9. Visualization of Euclidean-based Covid image classification
the results of Manhattan and Cosine distance are presented.
The comparative analysis based on the three distance metrics
show that the classification results are highest using Cosine
distance where the percent of correctly classified items is
approximately 93.75% vs 87.5% for Manhattan.

    Fig. 6. Efficiency evaluation results for distance-based workflow model
                                                                                         Fig. 10. Covid image classification using Manhattan distance

                                                                              103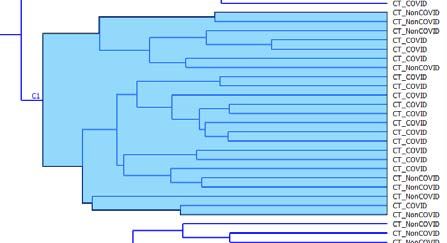
ISSN: 2766-9823                                                                                                             Volume 3, 2021

   Fig. 11.   Visualization of Manhattan-based Covid image classification

                                                                                                Fig. 13.    Prediction-Based Workflow Model

                                                                                             Fig. 14.      Data classification using decision tree

   Fig. 12.   Covid image classification using Cosine distance

B. Prediction-Based Workflow Model
    The goal of the second developed workflow (Fig.13) is to
predict the probability of heart disease for a patient. First, the
test data base is loaded and data is displayed using the Data
Table component. To perform classification and realize the
stage of decision making, Decision Tree is added and the                             Fig. 15.      Probability computation using decision tree, logistic
result is visualized as Fig. 14 shows. To make a prediction                                     regression, random forest and Naïve Bayes
correctly the prediction model is built using four methods. The
first one is built on Decision Tree connected to the Prediction
component. The second one is based on Logistic Regression
connected to the Prediction component performing the
process of prediction. Similarly, the Random Forest and Naïve
Bayes are connected to the prediction component to compute
the probability if heart disease. The final prediction results for
the four approaches are graphically illustrated in Fig. 15. The
results show similar probability values for the Decision Tree,
Logistic Regression and the Random Forest. Naïve Bayes
demonstrates higher probability values approaching 1. In
addition, the results obtained on the base of the described
methods the efficiency evaluation is computed. According to
the results, Logistic Regression demonstrates the highest
values with AUC = 0,908; CA=0,845; F1=0,844,
Precision=0,846; Recall=0,845 followed by Naïve Bayes
method as follows: AUC = 0,907; CA=0,835; F1=0,835,
Precision=0,835; Recall=0,835. The Decision Tree
                                                                                  Fig. 16.   Efficiency evaluation results for prediction-based workflow
demonstrates the lowest efficiency values as shown in Fig. 16.                                                  model

                                                                            104
ISSN: 2766-9823 Volume 3, 2021
CONCLUSION [11] Chojnowski, G., Walen´, T., Bujnick, J., “RNA Bricks—a database of
RNA 3D motifs and their interactions,” Nucleic Acids Research, 2014,
In the presented paper two workflow models for Vol. 42, Database issue, pp. D123–D131.
biomedical data processing are described. The first one offers [12] Walen´, T., Chojnowski, G., Gierski, P., Bujnicki, J., “ClaRNA: a
solution to the problems for the case study of two-dimensional classifier of contacts in RNA 3D structures based on a comparative
data classification. The performed experiments are based on analysis of various classification schemes,” Nucleic Acids Research,
2014, Vol. 42, No. 19 pp. e151.
three of the most used distance computing techniques:
Euclidean distance, Manhattan Distance, Cosine Distance. [13] Cirillo, D., Valencia, A., “Big data analytics for personalized
medicine,” Current Opinion in Biotechnology, Volume 58, August
The experiments demonstrate best results for image 2019, Pages 161-167.
classification using Cosine distance with nearly 93.75% [14] Kouanoua, A., Tchiotsopb, D., Kengnea, R., Zephirind, D., Armelea,
accurately classified images followed by the result for N., Tchinda, R., “An optimal big data workflow for biomedical image
Manhattan distance – approximately 87.5% and 75% for analysis,” Informatics in Medicine Unlocked 11 (2018) pp.68-74.
Euclidean Distance. In addition, the applied Logic Regression [15] Xing, E., Ho, Q., Xie, P., Wei, D., “Strategies and Principles of
function provides the option for modelling the probability of Distributed Machine Learning on Big Data,” Engineering 2 (2016) pp.
occurrence of the two image classes where the correct 179–195.
predicted instances are marked in blue in the confusion matrix. [16] Wollmann, T., Erfle, H., Eils, R., Rohr, K., Gunkel, M., “Workflows
for microscopy image analysis and cellular phenotyping,” Journal of
The second workflow is designed to offer solution to the Biotechnology, Vol. 261, 10 November 2017, pp. 70-75.
prediction problems. In this case, the probability of heart [17] Garza, L., Veit, J., Szolek, A., Röttig, M., Aiche, S., Gesing, S.,
disease occurrence is computed through Logistic Regression, Reinert, K., Kohlbacher, O., “From the desktop to the grid: scalable
bioinformatics via workflow conversion,” BMC Bioinformatics (2016)
Decision Tree, Random Forest and Naïve Bayes techniques. 17:127.
Regarding the disease probability computation the Decision [18] Kanwal, S., Khan, F., Lonie, A., Sinnott, R., “Investigating
Tree, Logistic Regression and the Random Forest generate reproducibility and tracking provenance – A genomic workflow case
similar results unlike Naïve Bayes which demonstrates higher study,” BMC Bioinformatics (2017) 18:337.
probability values approaching 1. On the other hand, the [19] Wolstencroft, K., Haines, R., Fellows, D.,, Williams, A., Withers, D.,
Logistic Regression shows the highest values for efficiency Owen, S., Soiland-Reyes, S., Dunlop, I., Nenadic, A., Fisher, P.,
followed by Naïve Bayes, the Random Forest and the Bhagat, J., Belhajjame, K., Bacall, F., Hardisty, A., de la Nieva
Hidalga, A., Balcazar Vargas, MP, Sufi, S., Goble, C., “The Taverna
Decision Tree. workflow suite: designing and executing workflows of Web Services
on the desktop, web or in the cloud,” Nucleic Acids Res 2013, 41(Web
ACKNOWLEDGMENT Server issue):W557–W561.
Primary funding for the presented work was provided by [20] Hettne, K., Dharuri, H., Zhao, J., Wolstencroft, K., Belhajjame, K.,
the National Science Fund, Ministry of Education and Soiland-Reyes, S., Mina, E., Thompson, M., Cruickshank, D., Verdes-
Montenegro, L., Garrido, J., Roure, D., Corcho, O., Klyne, G.,
Science, Republic of Bulgaria under contract KP-06-N37/24, Schouwen, R., Hoen, P., Bechhofer, S., Goble, C., Roos, M.,
research project “Innovative Platform for Intelligent “Structuring research methods and data with the research object model:
Management and Analysis of Big Data Streams Supporting genomics workflows as a case study,” Journal of Biomedical Semantics
Biomedical Scientific Research”. 2014, 5:41.
[21] Ko, G., Kim, P., Yoon, J., Han, G., Park, S., Song, W., Lee, B.,
REFERENCES “Closha: bioinformatics workflow system for the analysis of massive
[1] Kordasht, H., Hasanzadeh, M., “Biomedical analysis of exosomes sequencing data,” BMC Bioinformatics 2018, 19(Suppl 1):43.
using biosensing methods: recent progress,” Journal Analytical [22] Bu, Y., Borkar, V., Jia, J., Carey, M., Condie, T., “Pregelix: Big(ger)
Methods, Issue 22, 2020, pp. 2795-2811. graph analytics on a dataflow engine,” Proceedings of the VLDB
[2] Carretero, J., Krefting, D., “New Parallel and Distributed Tools and Endowment, vol. 8, no. 2, pp. 161–172, 2014.
Algorithms for Life Sciences,” Future Generation Computer Systems, [23] Gonzalez, J., Xin, R.S., Dave, A., Crankshaw, D., Franklin, M. J.,
Vol. 112, November 2020, pp. 1174-1176. Stoica, I., “GraphX: Graph processing in a distributed dataflow
[3] V. Gancheva, “SOA based multi-agent approach for biological data framework,” Proceedings of the 11th USENIX Conference on
searching and integration,” International Journal of Biology and Operating Systems Design and Implementation, ser. OSDI 14,
Biomedical Engineering, ISSN: 1998-4510, Vol. 13, 2019, pp. 32-37. Broomfield, CO, USA, 2014, pp. 599–613.
[4] Talia, D.. “Workflow Systems for Science: Concepts and Tools.” [24] Kang, U., Tsourakakis, C., Faloutsos, C., “PEGASUS: A peta-scale
International Scholarly Research Notices 2013 (2013): 1-15. graph mining system implementation and observations,” Proceedings
of the 9th IEEE International Conference on Data Mining, ser. ICDM
[5] Ivanov, I., “Basic Cloud Security Threats,” Proceedings of Annual
’09, Miami, FL, USA, 2009, pp. 229–238.
University Science Conerence, vol. 6, Veliko Tarnovo, Bulgaria, May
2020, pp. 143 – 147. [25] Riazi, S., Norris, B., “GraphFlow: Workflow-based Big Graph
Processing,” 2016 IEEE International Conference on Big Data (Big
[6] Ivanov, I., “Entry Points for Cyberatacs,” International Science
Data), December 2016, DOI: 10.1109/BigData.2016.7840993, pp.
Conference “Wide Security”, vol. 2, New Bulgarian University, Sofia,
3336-3343.
March, 2020m pp. 336 – 341, ISBN 978-619-7383-19-5.
[26] Spjuth, O., Bongcam-Rudloff, E., Hernández, G., Forer, L.,
[7] Ivanov, I., “Analysis of vulnerabilities in web applications,”
Giovacchini, M., Guimera, R., Kallio, A., Korpelainen, E., Kanduła,
Proceeding of Science Conference “Current Security Issues,“ Veliko
M., Krachunov, M., Kreil, D., Kulev, O., Łabaj, P., Lampa, S., Pireddu,
Tarnovo, vol. 6, 2020, pp. стр. 233 – 236. ISSN 2367-7465.
L., Schönherr, S., Siretskiy, A., Vassilev, D., “Experiences with
[8] Rodriguez, J., Rinschen, M., Floege, J., Kramann, R., “Big science and workflows for automating data-intensive bioinformatics,” Biology
big data in nephrology,” Kidney International, Vol. 95, Issue 6, 2019, Direct (2015) 10:43.
pp. 1326-1337, ISSN 0085-2538.
[27] Merelli, I., Pérez-Sánchez, H., Gesing, S., D’Agostino, D., “Managing,
[9] Jahan, F., Khan, P., Sapkal, R., Vinod V.C, Mehetre, V., “Biomedical Analysing, and Integrating Big Data in Medical Bioinformatics: Open
Image Analysis and Deep Learning,” IOSR Journal of Dental and Problems and Future Perspectives,” BioMed Research International
Medical Sciences (IOSR-JDMS) e-ISSN: 2279-0853, p-ISSN: 2279- Volume 2014, Article ID 134023.
0861. Vol. 19, Issue 2 Ser.15 (February. 2020), pp. 32-36.
[28] Abouelhoda, M., Issa, Sh., Ghanem, M., “Tavaxy: Integrating Taverna
[10] Lord, E., ,Diallo, A., Makarenkov, V., “Classification of bioinformatics and Galaxy workflows with cloud computing support,” BMC
workflows using weighted versions of partitioning and hierarchical Bioinformatics 2012, 13:77.
clustering algorithms,” . BMC Bioinformatics (2015) pp. 16:68.
105ISSN: 2766-9823 Volume 3, 2021
[29] Venco, F., Vaskin, Y., Ceol, A., Muller, H., “SMITH: a LIMS for [34] Wist, J., “HastaLaVista, a web-based user interface for NMR-based
handling next-generation sequencing workflows,” BMC untargeted metabolic profling analysis in biomedical sciences:
Bioinformatics 2014, 15(Suppl 14):S3. towards a new publication standard”, Journal of Cheminformatics,
[30] Raj-Kumar, PK., Liu, J., Hooke, JA., Kovatich, AJ., Kvecher, L., (2019) 11:75.
Shriver, CD., Hu, H., “PCA-PAM50 improves consistency between [35] Rubens, U., Mormont, R., Paavolainen, L.,Backer, V., Pavie, B.,
breast cancer intrinsic and clinical subtyping reclassifying a subset of Scholz, L., Michiels, G., Maska, M., U¨nay, D., Ball, G., Hoyoux, R.,
luminal A tumors as luminal B,” Sci Rep. 2019 May 28;9(1):7956. doi: Vandaele, R., Golani, O., Stanciu, S., Sladoje, N., Paul-Gilloteaux, P.,
10.1038/s41598-019-44339-4. PMID: 31138829; PMCID: Mare, R., Tosi, S., “BIAFLOWS: A Collaborative Framework to
PMC6538748. Reproducibly Deploy and Benchmark Bioimage Analysis Workflows,”
[31] AnhDo, T., Pottier, L., Caíno-Lores, S., Ferreira da Silva, R., Cuendet, Patterns, Vol.1, Issue 3, 12 June 2020, 100040.
M., Weinstein, Estrada, T., Taufer, M., Deelman, E., “A lightweight [36] Kruse, K., Hug, C., Vaquerizas, J., “FAN-C: a feature-rich framework
method for evaluating in situ workflow efficiency,” Journal of for the analysis and visualisation of chromosome conformation capture
Computational Science, Vol. 48, January 2021, 101259. data,” Genome Biology (2020) 21:303.
[32] Krieger, M., Torreno, O., Trelles, O., Kranzlmüller, D., “Building an [37] Bergenstråhle, J., Larsson, L., Lundeberg, J., “Seamless integration of
open source cloud environment with auto-scaling resources for image and molecular analysis for spatial transcriptomics workflows,”
executing bioinformatics and biomedical workflows,” Future BMC Genomics (2020) 21:482.
Generation Computer Systems, Vol. 67, February 2017, pp. 329-340.
[33] Mattingly, W., Kelley, R., Chariker, J., Weimken, T., Ramirez, J., “An
iterative workflow for creating biomedical visualizations using
Inkscape and D3.js,” BMC Bioinformatics 2015, 16(Suppl 15):P10.
106You can also read