Department of Defense Contractor and Troop Levels in Afghanistan and Iraq: 2007-2020 - Updated February 22, 2021
←
→
Page content transcription
If your browser does not render page correctly, please read the page content below
Department of Defense Contractor and Troop
Levels in Afghanistan and Iraq: 2007-2020

Updated February 22, 2021

                             Congressional Research Service
                              https://crsreports.congress.gov
                                                     R44116
SUMMARY
R44116
Department of Defense Contractor and Troop
February 22, 2021
Levels in Afghanistan and Iraq: 2007-2020 Heidi M. Peters
Throughout its history, the Department of Defense (DOD) has relied on contractors to support a Analyst in U.S. Defense
wide range of military operations. Operations over the last thirty years have highlighted the Acquisition Policy
critical role that contractors play in supporting U.S. troops—both in terms of the number of
contractors and the types of work they perform. During recent U.S. military operations in Iraq
and Afghanistan, contractors often accounted for 50% or more of the total DOD presence in-
country.
For the fourth quarter of fiscal year (FY) 2020, U.S. Central Command (USCENTCOM) reported 43,809 contractor
personnel working for DOD within its area of responsibility, which included 27,388 individuals located in Afghanistan, Iraq,
and Syria. From FY2011 to FY2019, obligations for all DOD-funded contracts performed within the Iraq, Syria, and
Afghanistan areas of operation totaled approximately $187 billion in FY2021 dollars.
In late 2017, the DOD stopped reporting the number of U.S. military personnel deployed in support of operations in
Afghanistan, Iraq, and Syria as part of its quarterly manpower reports and in other official releases. These data remain
withheld.
Congressional Research ServiceDepartment of Defense Contractor and Troop Levels in Afghanistan and Iraq: 2007-2020
Contents
Introduction ..................................................................................................................................... 1
The Role of Contractors in Military Operations.............................................................................. 1
Tracking Contractors During Contingency Operations ............................................................. 1
Force Management Levels for Deployed U.S. Armed Forces................................................... 2
DOD Usage of Contractors During Ongoing Military Operations ........................................... 3
Private Security Contractors in Afghanistan and Iraq ............................................................... 4
U.S. Armed Forces and DOD-Funded Contractor Personnel in Afghanistan.................................. 5
U.S. Armed Forces and DOD-Funded Contractor Personnel in Iraq (2007-) and Syria
(2018-) ......................................................................................................................................... 11
Analytical Methodology ................................................................................................................ 18
U.S. Armed Forces and Private Security Contractor Personnel in Afghanistan and Iraq ....... 18
Afghanistan ....................................................................................................................... 18
Iraq .................................................................................................................................... 18
Obligations within the Iraq and Afghanistan Areas of Operations .......................................... 19
Use of beta.SAM.gov Data Bank ...................................................................................... 19
Figures
Figure 1. U.S. Armed Forces and DOD-Funded Contractor Personnel in Afghanistan .................. 6
Figure 2. U.S. Armed Forces and DOD-Funded Contractor Personnel in Iraq (2007-) and
Syria (2018-) .............................................................................................................................. 12
Tables
Table 1. U.S. Armed Forces and DOD-Funded Contractor Personnel in Afghanistan .................... 7
Table 2. U.S. Armed Forces and DOD-Funded Private Security Contractor Personnel
in Afghanistan .............................................................................................................................. 9
Table 3. U.S. Armed Forces and DOD-Funded Contractor Personnel in Iraq (2007-) and
Syria (2018-) .............................................................................................................................. 13
Table 4. U.S. Armed Forces and Private Security Contractors in Iraq .......................................... 16
Table 5. DOD Contract Obligations in Iraq and Afghanistan Areas of Operations (AO) ............. 17
Contacts
Author Information........................................................................................................................ 20
Congressional Research ServiceDepartment of Defense Contractor and Troop Levels in Afghanistan and Iraq: 2007-2020
Introduction
This report provides general background information and data for Congress on the levels of
Department of Defense (DOD) military servicemembers and DOD-funded contractor personnel
deployed in support of prior and ongoing military operations in Iraq and Afghanistan. For more
information on DOD’s use of contractor personnel, see CRS Report R43074, Department of
Defense’s Use of Contractors to Support Military Operations: Background, Analysis, and Issues
for Congress, by Heidi M. Peters.
The Role of Contractors in Military Operations
Throughout its history, DOD has relied on contractors to support a wide range of military
operations. Operations over the past 30 years have highlighted the critical role that contractors
play in supporting U.S. military servicemembers, both in terms of the number of contractors and
the type of work they perform. During recent U.S. military operations in Iraq and Afghanistan,
contractors frequently averaged 50% or more of the total DOD presence in-country.
Definition: Defense Contractors
Tracking Contractors During The Code of Federal Regulations defines a defense
contractor as “any individual, firm, corporation,
Contingency Operations partnership, or other legal non-federal entity that
Since 2008, U.S. Central Command enters into a contract directly with the DOD to furnish
services, supplies, or construction.”1
(USCENTCOM) has published quarterly
Within the defense policy community, the term
contractor census reports that provide contractor is commonly used in two different contexts.
aggregated data – including elements such as The word can describe the private companies with
mission category and nationality – on which DOD contracts to obtain goods and services. It
contractors employed through DOD-funded can also describe individuals hired by DOD – usually
contracts who are physically located within through private companies, which are also considered
contractors in the previous context – to perform
the USCENTCOM area of responsibility.2 specific tasks. The term contractor does not refer to
Analysts and observers have previously raised military servicemembers, civilian DOD career
employees, or civilian political appointees.
questions about the reliability of the data
This report uses contractor to describe individual
gathered by DOD regarding the number of contractors hired through DOD-funded contracts.
contractors it employs in theater in support of These individuals may provide a wide range of services
military operations.3 DOD officials, however, to the DOD, including transportation, construction,
have stated that since 2009, the Department base support, intelligence analysis, translation,
has implemented a variety of mechanisms to interpretation, and private security support.
improve the reliability of contractor data it
1 See 32 C.F.R. 158.3, “Definitions;” see also DOD Instruction 3020.41, Operational Contract Support (OCS), August
31, 2018, p. 48, at https://www.esd.whs.mil/Portals/54/Documents/DD/issuances/dodi/302041p.pdf.
2 DOD policymakers and experts define area of responsibility as the “geographical area associated with a combatant
command within which a geographic combatant commander has authority to plan and conduct operations.”
USCENTCOM’s area of responsibility includes Egypt, Jordan, Syria, Iraq, Kuwait, Saudi Arabia, Bahrain, Qatar, the
United Arab Emirates, Oman, Yemen, Iran, Turkmenistan, Lebanon, Uzbekistan, Kazakhstan, Kyrgyzstan, Tajikistan,
Afghanistan, and Pakistan. See CRS In Focus IF11428, United States Central Command, by Kathleen J. McInnis and
Brendan W. McGarry.
3 See, for example, U.S. Government Accountability Office, Iraq and Afghanistan: DOD, State and USAID Face
Continued Challenges in Tracking Contracts, Assistance Instruments, and Associated Personnel, GAO-11-1, October
1, 2010.
Congressional Research Service 1Department of Defense Contractor and Troop Levels in Afghanistan and Iraq: 2007-2020 gathers. Those improvements include modifications to information technology and data collection systems, such as the joint Synchronized Predeployment and Operational Tracker (SPOT) database; updates and changes to related departmental policies; and changes in “leadership emphasis” within DOD and the combatant commands.4 For the fourth quarter of Fiscal Year (FY) 2020, U.S. Central Command reported 43,809 contractor personnel working for DOD within its area of responsibility, which included 27,388 individuals located in Afghanistan, Iraq, and Syria (see Figure 1 and Figure 2). From FY2011 to FY2019, obligations for all DOD-funded contracts performed within the Iraq and Afghanistan areas of operation totaled approximately $187 billion in FY2021 dollars (see Table 5).5 Force Management Levels for Deployed U.S. Armed Forces Force management levels, sometimes also described as troop caps, troop ceilings, or force manning levels, have historically been used by the United States to establish bounds on the number of military personnel that may be deployed in a country or region. The executive and legislative branches of the U.S. government have used force management levels to guide the execution of certain overseas U.S. military operations, as well as the associated presence of DOD personnel. During the 1980s, for example, Congress used provisions within annual appropriations legislation to establish force management levels limiting the number of active duty U.S. military personnel stationed in Europe.6 The Obama Administration used force management levels to manage its drawdown of the U.S. military presence in Afghanistan, and to manage the U.S. military presence in Iraq and Syria under Operation Inherent Resolve.7 The Trump Administration reportedly delegated the authority to establish force management levels for Afghanistan, Iraq, and Syria to the Secretary of Defense.8 It remains unclear how the Biden Administration will establish and adjust force management levels for ongoing and future military operations—however, Congress, as discussed in this report’s overview of “U.S. Armed Forces 4 Email correspondence with DOD official, received by CRS on September 7, 2016. 5 Iraq areas of operation are defined by CRS as Iraq, Bahrain, Kuwait, Qatar, Saudi Arabia, Turkey, the United Arab Emirates, Oman, and Jordan. Afghanistan areas of operation are defined by CRS as Afghanistan, Kazakhstan, Kyrgyzstan, Pakistan, Turkmenistan, Tajikistan, and Uzbekistan. See “Analytical Methodology” for a discussion of how these areas of operation were defined and related caveats. 6 See for example Section 799A of P.L. 97-377, enacted December 21, 1982. This provision was enacted in the larger context of congressional debate at the time regarding the perception that the United States’ NATO allies should assume a greater percentage of the mutual defense investment burden. 7 Established force management levels may be adjusted in response to operational needs or changing circumstances within a country or region, such as the Obama Administration’s decision in July 2016 to maintain approximately 8,400 troops in Afghanistan through January 2017. See White House Office of the Press Secretary, “Statement by the President on Afghanistan,” July 6, 2016, available at https://obamawhitehouse.archives.gov/the-press-office/2016/07/ 06/statement-president-afghanistan. 8 See Luis Martinez, “Trump Gives Pentagon Authority to Set Troop Levels in Syria and Iraq,” ABC News, April 26, 2017; Jim Garamone, “President Gives Mattis Authority to Set U.S. Troop Strength in Afghanistan,” Defense Media Activity, June 14, 2017; and U.S. Department of Defense Press Release, “Statement by Secretary of Defense Jim Mattis on Afghanistan Troop Levels,” June 14, 2017. In a March 30, 2017, Los Angeles Times article, a DOD spokesperson reportedly noted that “[i]n order to maintain tactical surprise, ensure operational security and force protection, the coalition will not routinely announce or confirm information about the capabilities, force numbers, locations, or movement of forces in or out of Iraq and Syria.” Congressional Research Service 2
Department of Defense Contractor and Troop Levels in Afghanistan and Iraq: 2007-2020

and DOD-Funded Contractor Personnel in Afghanistan” has placed some limitations on
adjustments to force management levels in Afghanistan.
In August 2017, the DOD announced that it was revising its force management level accounting
and reporting practices for Afghanistan to also include U.S. Armed Forces personnel in-country
for short-duration missions, personnel in a temporary duty status, personnel assigned to combat
support agencies, and forces assigned to the material recovery element and the Resolute Support
sustainment brigade in reported totals.9 Some observers noted that not accounting for these
personnel categories in reported force management levels prior to August 2017 might have
misrepresented the actual number of U.S. Armed Forces in Afghanistan during that period.10
In late 2017, the DOD stopped reporting the number of U.S. military personnel deployed in
support of operations in Afghanistan, Iraq, and Syria as part of its quarterly manpower reports and
in other official releases. Some DOD officials asserted that withholding this data provided an
additional layer of operational security for deployed U.S. forces. Then-Secretary of Defense
James Mattis contended that providing public access to detailed deployment data could
potentially allow U.S. adversaries to “take advantage of that kind of data, seeing trends at certain
times of the year, and what they can expect in the future.”11 Other observers viewed the
withdrawal of this information as part of a pattern of decreased “transparency” by DOD under the
Trump Administration.12
These data remained withheld during the Trump Administration, leading to criticism from some
observers and Members of Congress.13 Under the Biden Administration, it remains unclear if
DOD will resume reporting the number of U.S. military personnel deployed in support of ongoing
or future military operations.

DOD Usage of Contractors During Ongoing Military Operations
Some observers and experts argued that external “resource limits” of force management levels
may have increased DOD’s “reliance on…contractor and temporary duty personnel” to
effectively execute ongoing military operations in Afghanistan, Iraq, and Syria.14 In February

9 See U.S. Department of Defense, Press Operations, “Department of Defense Afghanistan Force Management Level
Accounting and Reporting Practices Briefing by Pentagon Chief Spokesperson White and Joint Staff Director
Lieutenant General McKenzie in the Pentagon Briefing Room,” transcript, August 30, 2017.
10 See Wesley Morgan, “Pentagon Finally Comes Clean on Afghanistan Troop Levels,” Politico, August 30, 2017; see

also Alex Horton, “The Pentagon Struggles to Provide Accurate Numbers for Deployed Troops,” The Washington Post,
November 27, 2017.
11 See remarks, the Honorable James N. Mattis, during U.S. Congress, House Committee on Armed Services, The

Fiscal Year 2019 National Defense Authorization Budget Request from the Department of Defense, full committee
hearing, 115th Cong., 2nd sess., April 8, 2018. See also David Welna, “Pentagon Questioned Over Blackout On War
Zone Troop Numbers,” NPR Morning Edition, July 3, 2018, and Tara Copp, “Pentagon Strips Iraq, Afghanistan, Syria
Troop Numbers From Web,” MilitaryTimes, April 9, 2018.
12 Loren DeJonge Schulman and Alice Friend, “The Pentagon’s Transparency Problem: Why Accurate Troop Levels

Are So Hard to Find,” Foreign Affairs, May 2, 2018.
13 CRS October 26, 2018, correspondence with DOD officials; David Welna, “Pentagon Questioned over Blackout on

War Zone Troop Numbers,” NPR, July 3, 2018; and Tara Copp, “Pentagon strips Iraq, Afghanistan, Syria troop
numbers from web,” Military Times, April 9, 2018.
14 See for example the statement as delivered and the prepared statement of Cary Russell, Director, Defense

Capabilities and Management, GAO, “Overseas Contingency Operations: Observations on the Use of Force
Management Levels in Afghanistan, Iraq, and Syria,” before the U.S. Congress, House Committee on Armed Services,
Subcommittee on Oversight and Investigations, Force Management Levels in Iraq and Afghanistan: Readiness and
Strategic Considerations, 114th Cong., 2nd sess., December 1, 2016.

Congressional Research Service                                                                                3
Department of Defense Contractor and Troop Levels in Afghanistan and Iraq: 2007-2020

2017, U.S. Army General John Nicholson, then Commander of the NATO Resolute Support
Mission and United States Forces–Afghanistan, testified before the Senate Armed Services
Committee that DOD had to “substitute contractors for soldiers in order to meet the force
manning levels” in Afghanistan.15 While the drawdown of U.S. forces contributed to a
demonstrable increase in the ratio of contractors to uniformed servicemembers in Afghanistan
between 2012 and 2017, it is difficult to assess if the increased ratio supported General
Nicholson’s assertion.
The House-passed version of the FY2018 National Defense Authorization Act (NDAA, H.R.
2810) contained a provision (Section 923) that would have expressed the sense of Congress that
the DOD should discourage the practice of substituting contractor personnel for available
members of the Armed Forces when a unit deploys to Afghanistan. This section also would have
required the Secretary of Defense to provide a related briefing to the congressional defense
committees. A similar provision was not included in the Senate amendment to H.R. 2810. While
the House receded in conference, the conferees directed the Secretary of Defense to provide a
briefing detailing steps taken by DOD to revise deployment guidelines to ensure readiness, unit
cohesion, and maintenance were prioritized, as well as the Secretary of Defense’s plan to
establish a policy to avoid the practice of directly substituting contractor personnel for U.S.
military personnel when practicable in the future.
Concern about DOD’s use of contractors in contingency operations predates the recent usage of
force management levels. For example, the Commission on Wartime Contracting in Iraq and
Afghanistan, in its 2011 final report to Congress, expressed its view that operations in Iraq and
Afghanistan between FY2002 and FY2011 had led to an “unhealthy over-reliance” on contractors
by DOD, Department of State, and USAID.16

Private Security Contractors in Afghanistan and Iraq
In Iraq and Afghanistan, armed and unarmed private security contractors have been used by DOD
to provide services such as protecting fixed locations; guarding traveling convoys; providing
security escorts; and training police and military personnel. The number of private security
contractor employees working for DOD in Iraq and Afghanistan has fluctuated significantly over
time, and is dependent on a variety of factors, including current force management levels in-
country and U.S. operational needs.
Since 2008, the presence of DOD-funded private security contractors peaked in Afghanistan in
2012 at more than 28,000 individuals and in Iraq in 2009 at more than 15,000 individuals. For the
fourth quarter of FY2020, DOD reported 4,164 DOD-funded private security contractors in
Afghanistan, with 1,813 categorized as armed private security contractors (see Table 2). DOD
reported 96 DOD-funded security contractor personnel in Iraq and Syria during the same period,
none of whom were identified as armed private security contractors (see Table 4).

15 U.S. Congress, Senate Committee on Armed Services, Situation in Afghanistan, 115th Cong., 1st sess., February 9,
2017. This concern was also echoed in a hearing before the House Armed Services Committee’s Subcommittee on
Oversight and Investigations in December 2016, and in a hearing before the House Armed Services Committee’s
Subcommittee on Readiness on March 8, 2017.
16 Commission on Wartime Contracting in Iraq and Afghanistan, “Transforming Wartime Contracting: Controlling

Costs, Reducing Risks,” final report of the Commission to Congress, August 2011, pp. 18-21. Available at
https://cybercemetery.unt.edu/archive/cwc/20110929213922/http://www.wartimecontracting.gov/docs/
CWC_FinalReport-highres.pdf.

Congressional Research Service                                                                                        4
Department of Defense Contractor and Troop Levels in Afghanistan and Iraq: 2007-2020

U.S. Armed Forces and DOD-Funded Contractor
Personnel in Afghanistan
As of the fourth quarter of FY2020, 22,562 DOD-funded contractor personnel were located in
Afghanistan (see Table 1).17 Approximately 35% of DOD’s reported individual contractors were
U.S. citizens (7,856), approximately 43% were third-country nationals (9,639), and roughly 22%
were local nationals (5,067). Of the 22,562 DOD contractor personnel, about 8% were armed
private security contractors (1,813).
On November 17, 2020, Acting Secretary of Defense Christopher Miller announced, “we will
implement President Trump's orders to continue our repositioning of forces from” Afghanistan,
and that the number of U.S. forces there would reach 2,500 by January 15, 2021.18 As of
December 2020, there were reportedly approximately 4,000 U.S. troop in Afghanistan, with the
level “dropping quickly” to meet the 2,500 level by mid-January.19 Section 1215 of the FY2021
NDAA (H.R. 6395; P.L. 116-238) established a limitation on the use of FY2020 and FY2021
DOD funds to make any change to the total number of U.S. Armed Forces deployed to
Afghanistan that would result in (1) the reduction of the total number of deployed forces below
4,000 (or the total number deployed as of the date of the FY2021 NDAA’s enactment); or (2) the
reduction of the total number of deployed forces below 2,000. This limitation could be lifted upon
the Secretary of Defense’s submission to Congress of a report containing a number of specified
elements, such as a risk assessment for the reduction in deployed forces and an assessment of the
impact of U.S. troop reductions on counterterrorism, Afghan military capabilities, the NATO-led
training mission, and other U.S. policy priorities. The President may waive the reporting
requirement with the submission of a written determination that such a waiver is in U.S. national
security interests, together with a “detailed explanation” of how it furthers those interests.

17 See Department of Defense, Contractor Support of U.S. Operations in the USCENTCOM Area of Responsibility,
October 2020, at https://www.acq.osd.mil/log/PS/.CENTCOM_reports.html/FY20_4Q_5A_Oct2020.pdf.
18 Department of Defense, “Acting Secretary Miller Announces Troop Levels in Afghanistan and Iraq,” transcript,

November 17, 2020, available at https://www.defense.gov/Newsroom/Transcripts/Transcript/Article/2418641/acting-
secretary-miller-announces-troop-levels-in-afghanistan-and-iraq/. For further discussion of U.S. operations in
Afghanistan under Operation Freedom’s Sentinel (OFS), which includes the NATO-led Resolute Support mission, see
CRS Report R45122, Afghanistan: Background and U.S. Policy: In Brief, by Clayton Thomas.
19 Hope Hodge Seck, “In First, NATO Forces Now Outnumber US Troops in Afghanistan,” Military.com, December

21, 2020, available at https://www.military.com/daily-news/2020/12/21/first-nato-forces-now-outnumber-us-troops-
afghanistan.html.

Congressional Research Service                                                                                     5
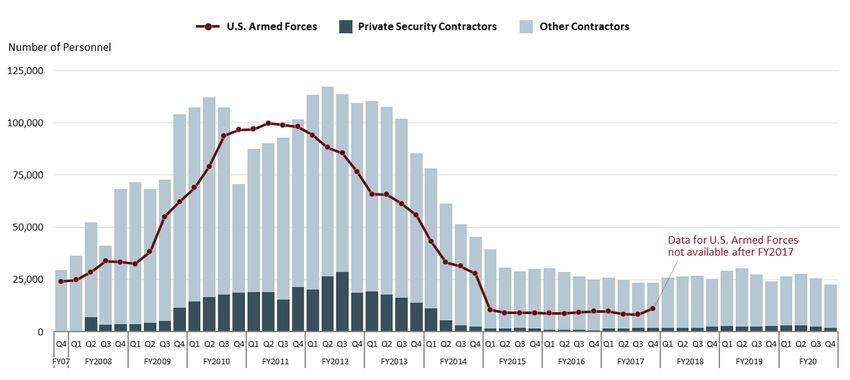
Figure 1. U.S. Armed Forces and DOD-Funded Contractor Personnel in Afghanistan
                                                                  Q4 FY2007-Q4 FY2020

   Source: Created by CRS. Contractor levels drawn from USCENTCOM Quarterly Contractor Census Reports; U.S. Armed Forces levels through Q4 FY2017 drawn
   from “Boots on the Ground” monthly reports to Congress.
   Notes: DOD began releasing data on contractors in USCENTCOM in Q4 FY2007. U.S. Armed Forces levels from FY2007 to FY2017 included all active and reserve
   component personnel. After FY2017, DOD began withholding U.S. Armed Forces levels from public release.

CRS-6
Department of Defense Contractor and Troop Levels in Afghanistan and Iraq: 2007-2020
Table 1. U.S. Armed Forces and DOD-Funded Contractor Personnel in Afghanistan
(Q4 FY2007-Q4 FY2020)
Contractors
Quarter (Q) and
U.S. Armed Forces Foreign and Host
Fiscal Year (FY) U.S. National
Country National Total Contractors
Contractors
Contractors
Q4 FY2007 24,056 3,387 26,086 29,473
Q1 FY2008 24,780 5,153 31,367 36,520
Q2 FY2008 28,650 4,220 48,116 52,336
Q3 FY2008 33,902 4,724 36,508 41,232
Q4 FY2008 33,450 5,405 62,847 68,252
Q1 FY2009 32,500 5,960 65,795 71,755
Q2 FY2009 38,350 9,378 58,819 68,197
Q3 FY2009 55,100 10,036 62,932 73,968a
Q4 FY2009 62,300 9,322 94,779 104,101
Q1 FY2010 69,000 10,016 97,276 107,292
Q2 FY2010 79,100 16,081 96,011 112,092
Q3 FY2010 93,800 19,103 88,376 107,479
Q4 FY2010 96,600 20,874 49,725 70,599
Q1 FY2011 96,900 19,381 68,102 87,483
Q2 FY2011 99,800 20,413 69,926 90,339
Q3 FY2011 98,900 23,294 69,824 93,118
Q4 FY2011 98,200 23,190 78,599 101,789
Q1 FY2012 94,100 25,287 88,204 113,491
Q2 FY2012 88,200 34,765 82,462 117,227
Q3 FY2012 85,600 30,568 83,168 113,736
Q4 FY2012 76,500 31,814 77,750 109,564
Q1 FY2013 65,800 33,444 76,960 110,404
Q2 FY2013 65,700 33,107 74,689 107,796
Q3 FY2013 61,300 32,442 69,413 101,855
Q4 FY2013 55,800 27,188 58,340 85,528
Q1 FY2014 43,300 23,763 54,373 78,136
Q2 FY2014 33,200 20,865 40,587 61,452
Q3 FY2014 31,400 17,404 34,085 51,489
Q4 FY2014 27,800 17,477 27,872 45,349
Q1 FY2015 10,600 14,222 25,387 39,609
Q2 FY2015 9,100 12,033 18,787 30,820
Q3 FY2015 9,060 10,019 18,912 28,931
Q4 FY2015 9,100 10,347 19,864 30,211
Congressional Research Service 7Department of Defense Contractor and Troop Levels in Afghanistan and Iraq: 2007-2020
Contractors
Quarter (Q) and
U.S. Armed Forces Foreign and Host
Fiscal Year (FY) U.S. National
Country National Total Contractors
Contractors
Contractors
Q1 FY2016 8,930 10,151 20,304 30,455
Q2 FY2016 8,730 9,640 18,986 28,626
Q3 FY2016 9,365 8,837 17,598 26,435
Q4 FY2016 9,800 9,142 16,055 25,197
Q1 FY2017 9,200 9,474 16,548 26,022
Q2 FY2017 8,400 9,522 15,378 24,900
Q3 FY2017 8,300 9,436 14,089 23,525
Q4 FY2017 11,100b 9,418 14,241 23,659
Q1 FY2018 Not Available 10,189 15,854 26,043
Q2 FY2018 Not Available 10,891 15,756 26,647
Q3 FY2018 Not Available 10,128 16,794 26,922
Q4 FY2018 Not Available 10,989 14,250 25,239
Q1 FY2019 Not Available 11,606 17,783 29,389
Q2 FY2019 Not Available 12,247 18,314 30,561
Q3 FY2019 Not Available 10,648 16,809 27,457
Q4 FY2019 Not Available 10,750 13,452 24,202
Q1 FY2020 Not Available 10,530 16,015 26,545
Q2 FY2020 Not Available 10,711 16,930 27,641
Q3 FY2020 Not Available 9,776 15,874 25,650
Q4 FY2020 Not Available 7,856 14,706 22,562
Sources: Contractor levels drawn from USCENTCOM Quarterly Contractor Census Reports; U.S. Armed
Forces levels through Q4 FY2017 drawn from “Boots on the Ground” monthly reports to Congress.
Note: DOD began releasing data on contractors in USCENTCOM in Q4 FY2007. U.S. Armed Forces levels
from FY2007 to FY2017 included all active and reserve component personnel. After FY2017, DOD began
withholding U.S. U.S. Armed Forces levels from public release.
a. DOD-reported total; note that for Q3 FY2009, DOD reported 10,036 contractors who were U.S. citizens;
11,806 contractors who were third country nationals; and 51,126 contractors who were local/host country
nationals. The source of the discrepancy between the DOD-reported total and the sum of the reported
contractor country of origin categorizations (73,968 vs. 72,968) is unclear.
b. In August 2017, DOD revised its force management level accounting and reporting practices for Afghanistan
to include U.S. Armed Forces personnel in-country for short-duration missions, personnel in a temporary
duty status, personnel assigned to combat support agencies, and forces assigned to the material recovery
element and the Resolute Support sustainment brigade in reported totals. See U.S. Department of Defense,
Press Operations, “Department of Defense Afghanistan Force Management Level Accounting and Reporting
Practices Briefing by Pentagon Chief Spokesperson White and Joint Staff Director Lieutenant General
McKenzie in the Pentagon Briefing Room,” transcript, August 30, 2017.
Congressional Research Service 8Department of Defense Contractor and Troop Levels in Afghanistan and Iraq: 2007-2020
Table 2. U.S. Armed Forces and DOD-Funded Private Security Contractor Personnel
in Afghanistan
(Q2 FY2008-Q4 FY2020)
Contractors
Quarter (Q) and Foreign and Host
U.S. Armed Forces U.S. National Total Private
Fiscal Year (FY) Country National
Private Security Security
Private Security
Contractors Contractorsa
Contractors
Q2 FY2008 28,650 167 6,815 6,982
Q3 FY2008 33,902 5 3,532 3,537
Q4 FY2008 33,450 9 3,838 3,847
Q1 FY2009 32,500 15 3,674 3,689
Q2 FY2009 38,350 17 4,356 4,373
Q3 FY2009 55,100 19 5,179 5,198
Q4 FY2009 62,300 76 11,347 11,423
Q1 FY2010 69,000 114 14,325 14,439
Q2 FY2010 79,100 140 16,593 16,733
Q3 FY2010 93,800 152 17,780 17,932
Q4 FY2010 96,600 197 18,672 18,869
Q1 FY2011 96,900 250 18,669 18,919
Q2 FY2011 99,800 250 18,721 18,971
Q3 FY2011 98,900 693 14,612 15,305
Q4 FY2011 98,200 603 20,941 21,544
Q1 FY2012 94,100 570 19,805 20,375
Q2 FY2012 88,200 519 26,093 26,612
Q3 FY2012 85,600 480 28,206 28,686
Q4 FY2012 76,500 2,014 16,850 18,914b
Q1 FY2013 65,800 2,094 17,320 19,414
Q2 FY2013 65,700 1,378 16,615 17,993
Q3 FY2013 61,300 873 15,345 16,218
Q4 FY2013 55,800 844 13,212 14,056
Q1 FY2014 43,300 1,007 10,325 11,332
Q2 FY2014 33,200 641 4,950 5,591
Q3 FY2014 31,400 424 2,753 3,177
Q4 FY2014 27,800 252 2,220 2,472
Q1 FY2015 10,600 317 1,194 1,511
Q2 FY2015 9,100 398 1,127 1,525
Q3 FY2015 9,060 421 1,358 1,779
Q4 FY2015 9,100 312 1,343 1,655
Q1 FY2016 8,930 176 907 1,083
Congressional Research Service 9Department of Defense Contractor and Troop Levels in Afghanistan and Iraq: 2007-2020
Contractors
Quarter (Q) and Foreign and Host
U.S. Armed Forces U.S. National Total Private
Fiscal Year (FY) Country National
Private Security Security
Private Security
Contractors Contractorsa
Contractors
Q2 FY2016 8,730 125 747 872
Q3 FY2016 9,365 174 848 1,022
Q4 FY2016 9,800 145 668 813
Q1 FY2017 9,200 473 1,249 1,722
Q2 FY2017 8,400 436 1,380 1,816
Q3 FY2017 8,300 449 1,246 1,695
Q4 FY2017 11,100 493 1,336 1,829
Q1 FY2018 Not Available 426 1,441 1,867
Q2 FY2018 Not Available 416 1,516 1,932
Q3 FY2018 Not Available 746 1,256 2,002
Q4 FY2018 Not Available 364 2,033 2,397
Q1 FY2019 Not Available 432 2,415 2,847
Q2 FY2019 Not Available 612 1,955 2,567
Q3 FY2019 Not Available 608 2,031 2,639
Q4 FY2019 Not Available 688 2,196 2,884
Q1 FY2020 Not Available 728 2,289 3,017
Q2 FY2020 Not Available 739 2,234 2,973
Q3 FY2020 Not Available 649 1,788 2,437
Q4 FY2020 Not Available 456 1,357 1,813
Sources: Contractor levels drawn from USCENTCOM Quarterly Contractor Census Reports; U.S. Armed
Forces levels through Q4 FY2017 drawn from “Boots on the Ground” monthly reports to Congress.
Notes: DOD began releasing data on private security contractor personnel levels within Afghanistan in Q2
FY2008. U.S. Armed Forces levels from FY2007 to FY2017 included all active and reserve component personnel.
After FY2017, DOD began withholding U.S. U.S. Armed Forces levels from public release.
a. Includes most subcontractors and service contractors, armed and unarmed, hired by prime contractors
under DOD contracts.
b. DOD-reported total; note that for Q4 FY2012, DOD reported 2,014 private security contractors who
were U.S. citizens; 1,437 private security contractors who were third country nationals; and 15,413 private
security contractors who were local/host country nationals. The source of the discrepancy between the
DOD-reported total and the sum of the reported private security contractor country of origin
categorizations (18,914 vs. 18,864) is unclear.
Congressional Research Service 10Department of Defense Contractor and Troop Levels in Afghanistan and Iraq: 2007-2020 U.S. Armed Forces and DOD-Funded Contractor Personnel in Iraq (2007-) and Syria (2018-) DOD ceased publicly reporting numbers of DOD contractor personnel working in Iraq in December 2013, following the conclusion of the U.S. combat mission in Iraq (Operation Iraqi Freedom and Operation New Dawn), and the subsequent drawdown of DOD contractor personnel levels in Iraq. In late 2014, in response in part to developing operations in the region, DOD reinitiated reporting broad estimates of DOD contractor personnel deployed in Iraq in support of Operation Inherent Resolve (OIR). As the number of DOD contractor personnel in Iraq increased over the first six months of 2015, DOD resumed reporting exact numbers and primary mission categories of OIR contractor personnel in June 2015. In the second quarter of FY2018, DOD began reporting a combined total of contractor personnel physically located in Iraq and Syria. As of FY2020, DOD reports the quarterly number of contractors with a mission category of “security” in Iraq and Syria, but does not identify any individuals within this category as specifically armed private security contractors. As of the fourth quarter of FY2020, DOD reported it had 4,826 contractor personnel in Iraq and Syria (see Table 3). Approximately 53% of DOD’s reported individual contractors were U.S. citizens (2,558), approximately 34% were third-country nationals (1,632); and roughly 13% were local/host-country nationals (636).20 As of December 2020 observers and analysts estimated the number of U.S. Armed Forces personnel in Iraq to be approximately 3,000.21 Reports in late 2020 indicated the Trump Administration intended to drawdown in-country U.S. forces to 2,500 by January 15, 2021.22 20 See Department of Defense, Contractor Support of U.S. Operations in the USCENTCOM Area of Responsibility, October 2020, at https://www.acq.osd.mil/log/PS/.CENTCOM_reports.html/FY20_4Q_5A_Oct2020.pdf. 21 Jim Garamone, “U.S. Will Draw Down Forces in Afghanistan, Iraq, Acting Secretary Says,” Defense News, November 17, 2020, available at https://www.defense.gov/Explore/News/Article/Article/2418416/us-will-draw-down- forces-in-afghanistan-iraq-acting-secretary-says/. 22 Ibid.; For further discussion of the U.S. and its coalition partners' efforts to combat the Islamic State in Iraq and Syria under OIR, see CRS Report RL33487, Armed Conflict in Syria: Overview and U.S. Response, coordinated by Carla E. Humud and CRS In Focus IF10404, Iraq and U.S. Policy, by Christopher M. Blanchard Congressional Research Service 11
Figure 2. U.S. Armed Forces and DOD-Funded Contractor Personnel in Iraq (2007-) and Syria (2018-)
                                                           (Q4 F72007-Q1 FY2014; Q1 FY2015-Q4 FY2020)

   Source: Contractor levels drawn from USCENTCOM Quarterly Contractor Census Reports and depicts the number of DOD-funded armed private security
   contractors as a subset of all reported DOD-funded contractors; U.S. Armed Forces levels from Q4 FY2007-Q1 FY2012 drawn from “Boots on the Ground” monthly
   reports to Congress. U.S. Armed Forces levels for Q1 FY2015-Q1 FY2017 drawn from White House semiannual “War Powers Resolution Report” to Congress.
   Notes: DOD began releasing data on DOD-funded private security contractor personnel in USCENTCOM in Q1 FY2008, and ceased reporting data on DOD-funded
   private security contractor personnel in Iraq in Q4 FY2013. Between Q1 FY2014 and Q4 FY2014, no data on any DOD-funded contractor personnel in Iraq was
   released. In Q2 FY2018, DOD began reporting a combined total of contractor personnel physically located in Iraq and Syria. U.S. Armed Forces levels for Q4 FY2007-
   Q1 FY2012 included all active and reserve component personnel. Following the conclusion of the U.S. combat mission in Iraq in 2011, the “Boots on the Ground”
   reports ceased providing separate force levels for Iraq. Beginning in 2014, in support of U.S. military operations against the Islamic State, additional U.S. military personnel
   were deployed to Iraq. See Table 3 for further discussion of recent U.S. Armed Forces and contractor levels in Iraq.

CRS-12
Department of Defense Contractor and Troop Levels in Afghanistan and Iraq: 2007-2020
Table 3. U.S. Armed Forces and DOD-Funded Contractor Personnel in Iraq (2007-)
and Syria (2018-)
(Q4 FY2007-Q1 FY2014; Q1 FY2015-Q4 FY2020)
Contractors
Quarter (Q) and U.S. Armed
Foreign and Host
Fiscal Year (FY) Forces U.S. National
Country National Total Contractors
Contractors
Contractors
Q4 FY2007 165,607 26,869 127,956 154,825
Q1 FY2008 161,783 31,325 132,266 163,591
Q2 FY2008 159,700 29,351 120,027 149,378
Q3 FY2008 153,300 29,611 132,817 162,428
Q4 FY2008 146,900 28,045 135,401 163,446
Q1 FY2009 148,500 39,262 108,788 148,050
Q2 FY2009 141,300 36,061 96,549 132,610
Q3 FY2009 134,500 31,541 88,165 119,706
Q4 FY2009 129,200 29,944 83,787 113,731
Q1 FY2010 114,300 27,843 72,192 100,035
Q2 FY2010 95,900 24,719 70,742 95,461
Q3 FY2010 88,320 22,761 56,860 79,621
Q4 FY2010 48,410 20,981 53,125 74,106
Q1 FY2011 47,305 19,943 51,199 71,142
Q2 FY2011 45,660 18,393 45,860 64,253
Q3 FY2011 46,010 18,900 43,789 62,689
Q4 FY2011 44,755 16,054 36,583 52,637
Q1 FY2012 11,445 11,237 12,649 23,886a
Q2 FY2012 — 3,260 7,707 10,967a
Q3 FY2012 — 2,493 4,843 7,336a
Q4 FY2012 — 2,314 6,686 9,000a
Q1 FY2013 — 2,356 6,093 8,449a
Q2 FY2013 — 2,125 5,780 7,905a
Q3 FY2013 — 1,898 5,837 7,735a
Q4 FY2013 — 1,626 4,998 6,624a
Q1 FY2014 — 820 2,414 3,234a
No Data on Contractors Released by DOD from Q2 FY2014-Q4 FY2014
Q1 FY2015 Up to 3,100b No Data Available No Data Available 250 (est.)
Q2 FY2015 Up to 3,100b No Data Available No Data Available 600 (est.)
Q3 FY2015 Up to 3,550c 1,140 209 1,349
c
Q4 FY2015 Up to 3,550 1,098 305 1,403
Congressional Research Service 13Department of Defense Contractor and Troop Levels in Afghanistan and Iraq: 2007-2020
Contractors
Quarter (Q) and U.S. Armed
Foreign and Host
Fiscal Year (FY) Forces U.S. National
Country National Total Contractors
Contractors
Contractors
Q1 FY2016 Up to 3,550d 1,392 636 2,028
Q2 FY2016 Up to 3,550d 1,564 1,055 2,619
Q3 FY2016 Up to 4,087e 1,605 880 2,485
Q4 FY2016 Up to 4,087e 1,823 1,169 2,992
Q1 FY2017 Up to 5,262f 2,035 1,557 3,592
Q2 FY2017 Up to 5,262f 2,149 1,206 3,795
Q3 FY2017 Up to 5,262g 2,424 2,061 4,485
Q4 FY2017 Up to 5,262g 2,644 1,965 4,609
Q1 FY2018 Not Availableh 2,767 2,160 4,927
DOD-Funded Contractor Personnel in Iraq and Syria
Q2 FY2018 Not Available 2,869 2,639 5,508
Q3 FY2018 Not Available 2,651 2,672 5,323
Q4 FY2018 Not Available 3,086 3,232 6,318
Q1 FY2019 Not Available 2,850 3,370 6,220
Q2 FY2019 Not Available 3,362 3,567 6,929
Q3 FY2019 Not Available 3,229 4,246 7,475
Q4 FY2019 Not Available 3,152 4,003 7,155
Q1 FY2020 Not Available 2,903 3,683 6,586
Q2 FY2020 Not Available 2,679 3,609 6,288
Q3 FY2020 Not Available 2,938 3,613 6,551
Q4 FY2020 Not Available 2,558 2,268 4,826
Sources: U.S. Armed Forces levels from Q4 FY2007-Q1 FY2012 are drawn from the DOD’s “Boots on the
Ground” monthly reports to Congress, and include all active and reserve component personnel. Force levels for
Q1 FY2015-Q4 FY2017 are drawn from the White House’s semiannual “War Powers Resolution Report” to
Congress and are force management levels. All listed contractor levels are drawn from USCENTCOM Quarterly
Contractor Census Reports.
Notes: DOD began releasing data on contractors in USCENTCOM in the second half of 2007, and initially
ceased reporting data on DOD contractor personnel in Iraq in December 2013.
Following the conclusion of the U.S. combat mission in Iraq, the “Boots on the Ground” reports ceased
providing separate force levels for Iraq. However, a residual U.S. force remained in county to provide embassy
security and security cooperation assistance. Beginning in June 2014, in support of U.S. military operations against
the Islamic State, additional U.S. military personnel were deployed to Iraq through OIR to advise and train Iraqi
forces, serve as observers, and secure U.S. personnel and facilities.
In Q1 FY2015, DOD resumed releasing data on DOD-funded contractor personnel in Iraq. As the “Boots on
the Ground” reports did not provide OIR force levels, CRS used the force management levels for Iraq reported
biannually by the White House between December 2014 and June 2017, beginning with the December 2014 “Six
Month Consolidated War Powers Resolution Report” and ending with the June 2017 “Supplemental
Consolidated War Powers Resolution Report,” to provide an indication of the number of U.S. forces estimated
to be in Iraq during that period. As of December 2017, the “Supplemental Consolidated War Powers Resolution
Report” no longer provides current force management levels for Iraq or Syria.
Congressional Research Service 14Department of Defense Contractor and Troop Levels in Afghanistan and Iraq: 2007-2020
As of Q2 FY2018, DOD reported a combined total of DOD-funded contractor personnel physically located in
Iraq and Syria.
a. DOD reported that DOD-funded contractors in Iraq from Q1 FY2012 through Q1 FY2014 were
supporting both U.S. Mission Iraq and the Office of Security Cooperation-Iraq.
b. Force Management Level for Iraq, as reported by the White House Office of the Press Secretary, “Letter
from the President—Six Month Consolidated War Powers Resolution Report,” December 11, 2014, at
https://www.obamawhitehouse.archives.gov/the-press-office/2014/12/11/letter-president-six-month-
consolidated-war-powers-resolution-report.
c. Force Management Level for Iraq, as reported by the White House Office of the Press Secretary, “Letter
from the President—Six Month Consolidated War Powers Resolution Report,” June 11, 2015, at
https://www.obamawhitehouse.archives.gov/the-press-office/2015/06/11/letter-president-six-month-
consolidated-war-powers-resolution-report.
d. Force Management Level for Iraq, as reported by the White House Office of the Press Secretary, “Letter
from the President—War Powers Resolution,” December 11, 2015, at
https://obamawhitehouse.archives.gov/the-press-office/2015/12/11/letter-president-war-powers-resolution.
e. Force Management Level for Iraq, as reported by the White House Office of the Press Secretary, “Letter
from the President—War Powers Resolution,” June 13, 2016, at https://obamawhitehouse.archives.gov/the-
press-office/2016/06/13/letter-president-war-powers-resolution.
f. Force Management Level for Iraq, as reported by the White House Office of the Press Secretary, “Letter
from the President—Supplemental 6-month War Powers Letter,” December 5, 2016, at
https://obamawhitehouse.archives.gov/the-press-office/2016/12/05/letter-president-supplemental-6-month-
war-powers-letter.
g. Force Management Level for Iraq, as reported by the White House, “Letter from the President to the
Speaker of the House of Representatives and the President Pro Tempore of the Senate,” June 6, 2017, at
https://trumpwhitehouse.archives.gov/briefings-statements/text-letter-president-speaker-house-
representatives-president-pro-tempore-senate/.
h. Beginning in December 2017, the “Supplemental Consolidated War Powers Resolution Reports” no longer
provide current force management levels for Iraq or Syria. See for example “Letter from the President to
the Speaker of the House of Representatives and the President Pro Tempore of the Senate,” December 11,
2017, at https://trumpwhitehouse.archives.gov/briefings-statements/text-letter-president-speaker-house-
representatives-president-pro-tempore-senate-2/.
Congressional Research Service 15Department of Defense Contractor and Troop Levels in Afghanistan and Iraq: 2007-2020
Table 4. U.S. Armed Forces and Private Security Contractors in Iraq
(Q1 FY2008-Q4 FY2013)
Contractors
Quarter (Q) and U.S. Armed Foreign and Host
U.S. National Total Private
Fiscal Year (FY) Forces Country National
Private Security Security
Private Security
Contractors Contractorsa
Contractors
Q1 FY2008 161,783 830 9,122 9,952
Q2 FY2008 159,700 515 6,744 7,259
Q3 FY2008 153,300 1,540 6,164 7,704
Q4 FY2008 146,900 886b 9,560 10,446
Q1 FY2009 148,500 727b 7,974 8,701
Q2 FY2009 141,300 681 12,261 12,942
Q3 FY2009 134,500 802 14,477 15,279
Q4 FY2009 129,200 670 12,014 12,684
Q1 FY2010 114,300 776 10,319 11,095
Q2 FY2010 95,900 1,081 10,529 11,610
Q3 FY2010 88,320 1,030 10,383 11,413
Q4 FY2010 48,410 1,017 10,611 11,628
Q1 FY2011 47,305 791 7,536 8,327
Q2 FY2011 45,660 917 8,290 9,207
Q3 FY2011 46,010 935 9,479 10,414
Q4 FY2011 44,755 844 8,710 9,554
Q1 FY2012 11,445 751 8,244 8,995
Q2 FY2012 — 288 3,289 3,577
Q3 FY2012 — 116 2,291 2,407
Q4 FY2012 — 102 2,014 2,116
Q1 FY2013 — 235 2,046 2,281
Q2 FY2013 — 259 2,100 2,359
Q3 FY2013 — 217 1,931 2,148
Q4 FY2013 — 147 2,262 2,409
Sources: Contractor levels drawn from USCENTCOM Quarterly Contractor Census Reports; U.S. Armed
Forces levels from Q1 FY2008-Q1 FY2012 drawn from “Boots on the Ground” monthly reports to Congress.
Notes: DOD began releasing data on DOD-funded private security contractor personnel levels in
USCENTCOM in Q1 FY2008, and ceased reporting data on DOD-funded private security contractor personnel
in Iraq in Q4 FY2013. See Table 3 for further discussion of recent U.S. Armed Forces and contractor levels in
Iraq.
a. DOD reported that DOD-funded contractors in Iraq from December 2011 through December 2013 were
supporting both U.S. Mission Iraq and the Office of Security Cooperation Iraq.
b. USCENTCOM Quarterly Census Reports from Q4 FY2008 and Q1 FY2009 also included private security
contractor personnel from NATO partner and ally countries in the reported totals of U.S. private security
contractor personnel.
Congressional Research Service 16Table 5. DOD Contract Obligations in Iraq and Afghanistan Areas of Operations (AO)
(FY2011-FY2019; in millions of FY2021 dollars)
Country FY2011 FY2012 FY2013 FY2014 FY2015 FY2016 FY2017 FY2018 FY2019 Total
Iraq $5,589 $460 $592 $85 $273 $753 $2,472 $2,759 $1,153 $14,135
Bahrain $567 $364 $960 $230 $608 $743 $871 $775 $551 $5,667
Kuwait $4,336 $2,845 $3,420 $1,962 $2,181 $1,972 $4,497 $4,909 $2,230 $28,351
Qatar $915 $948 $470 $191 $359 $279 $1,062 $2,272 $564 $7,060
Iraq AO
Saudi Arabia $337 $620 $1,048 $1,366 $2,269 $1,125 $2,086 $1,924 $1,382 $12,156
Turkey $203 $312 $209 $201 $222 $265 $417 $390 $156 $2,375
United Arab $1,157 $1,598 $2,578 $1,913 $1,430 $1,574 $2,852 $2,938 $1,095 $17,134
Emirates
Oman $155 $234 $249 $116 $136 $135 $154 $9 $27 $1,213
Jordan $44 $59 $193 $183 $222 $204 $321 $411 $208 $1,845
Total, Iraq AO $13,301 $7,439 $9,717 $6,246 $7,699 $7,050 $14,732 $16,385 $7,366 $89,936
Afghanistan $19,848 $21,326 $16,377 $6,818 $3,592 $2,361 $6,718 $7,755 $4,351 $89,145
Kazakhstan $82 $85 $102 $63 $85 $38 $72 $93 $23 $642
Afghanistan AO
Kyrgyzstan $987 $2,164 $2,202 $745 ($2) ($7) ($11) $2 $4 $6,082
Pakistan $71 $17 ($4) $26 $114 $58 $124 $97 $49 $552
Tajikistan $4 $10 $10 $8 $8 $0 $12 $5 ($1) $55
Turkmenistan $12 $5 $15 $2 $0 $0 ($1) $0 $0 $32
Uzbekistan $18 $26 $21 $24 $35 $12 $19 $0 $0 $155
Total, Afghanistan AO $21,020 $23,633 $18,722 $7,685 $3,831 $2,462 $6,931 $7,951 $4,427 $96,663
Total, Iraq and $34,322 $31,072 $28,440 $13,931 $11,530 $9,512 $21,664 $24,336 $11,793 $186,599
Afghanistan AOs
Sources: beta.SAM.gov Data Bank, as of January 28, 2021 for FY2011-FY2020 data; CRS adjustments for inflation using deflators for converting into FY2021 dollars
derived from Office of the Under Secretary of Defense (Comptroller), Department of Defense, National Defense Budget Estimates for FY2021, “Department of Defense
Deflators–TOA By Category ‘Total Non-Pay,’” Table 5-5, pp. 60-61, April 2020.
Notes: Numbers may not add due to rounding. See “Analytical Methodology” for additional discussion of CRS methodology in assembling this data table.
CRS-17Department of Defense Contractor and Troop Levels in Afghanistan and Iraq: 2007-2020 Analytical Methodology U.S. Armed Forces and Private Security Contractor Personnel in Afghanistan and Iraq Various factors may affect the exact number of U.S. Armed Forces personnel indicated to be located in a given location at a given point in time by the Department of Defense in official reports and other releases. Differences in methodological practices – such as which categories of personnel are included or excluded – may result in differences in the U.S. Armed Forces personnel totals provided through official sources. Afghanistan Reported U.S. Armed Forces levels from the fourth quarter of FY2007 through the fourth quarter of FY2017 were drawn from the DOD’s “Boots on the Ground” monthly reports to Congress as provided to CRS, and included all active and reserve component personnel. After FY2017, DOD began withholding U.S. Armed Forces levels in Afghanistan from public release. Under the Biden Administration, it remains unclear if DOD will resume reporting the number of U.S. military personnel deployed in support of military operations in Afghanistan. All listed contractor levels are drawn from the USCENTCOM Quarterly Contractor Census Reports, which provide data on contractors in the USCENTCOM area of responsibility going forward from the second half of 2007. Iraq Reported U.S. Armed Forces levels from the fourth quarter of FY2007 through the first quarter of FY2012 were drawn from the DOD’s “Boots on the Ground” monthly reports to Congress as provided to CRS, and included all active and reserve component personnel. U.S. Armed Forces levels for the first quarter of FY2015 through the fourth quarter of FY2017 were drawn from the White House’s semiannual “War Powers Resolution Report” to Congress and represent force management levels. As noted in the previous discussion of “Force Management Levels for Deployed U.S. Armed Forces” force management levels provide an upper bound on the number of military personnel that may be deployed in a country or region, and may not represent the actual number of personnel in country during the depicted period. CRS used the force management levels for Iraq reported biannually by the White House between December 2014 and June 2017, beginning with the December 2014 “Six Month Consolidated War Powers Resolution Report” and ending with the June 2017 “Supplemental Consolidated War Powers Resolution Report,” to provide an indication of the number of U.S. forces estimated to be in Iraq during that period. As of December 2017, the “War Powers Resolution Reports” released by the Trump Administration no longer provided current force management levels for Iraq or Syria. Under the Biden Administration, it remains unclear if DOD will resume reporting the number of U.S. military personnel deployed in support of ongoing or future military operations through the “War Powers Resolution Reports” or other official releases. All listed contractor levels are drawn from the USCENTCOM Quarterly Contractor Census Reports. DOD began releasing data on contractors in the USCENTCOM area of responsibility in the second half of 2007, and ceased reporting data on DOD contractor personnel specifically Congressional Research Service 18
Department of Defense Contractor and Troop Levels in Afghanistan and Iraq: 2007-2020

located in Iraq in December 2013. In the first quarter of FY2015, DOD resumed releasing data on
DOD-funded contractor personnel specifically located in Iraq.

Obligations within the Iraq and Afghanistan Areas of Operations
As used in the context of U.S. military operations, an area of operation can be understood as an
“operational area defined by a commander for land and maritime forces that should be large
enough to accomplish their missions and protect their forces.”23 For the purposes of this analysis,
CRS has defined the Iraq area of operation as Iraq, Bahrain, Kuwait, Qatar, Saudi Arabia, Turkey,
the United Arab Emirates, Oman, and Jordan. CRS further defined the Afghan area of operation
as Afghanistan, Kazakhstan, Kyrgyzstan, Pakistan, Turkmenistan, Tajikistan, and Uzbekistan. In
2008, the Congressional Budget Office (CBO) published a report that tracked the U.S.
government's obligations in the Iraqi area of operation from FY2005 through FY2007 using
Federal Procurement Data System-Next Generation (FPDS-NG) data that considered most
countries bordering Iraq, with the exception of Iran, to be part of the Iraqi area of operations.24
CRS replicated CBO's methodology for defining the Iraq areas of operation for the purposes of
this data analysis, and used a similar methodology in determining the approximate value of
annual contract obligations in the Afghanistan areas of operation. Note that there may be overlap
between each area of operation—for example, U.S. Air Force personnel stationed at Al Udeid Air
Base in Qatar may support U.S. military operations in both Iraq and Afghanistan.

Use of beta.SAM.gov Data Bank
Obligations occur when agencies enter into contracts with vendors, employ personnel, or
otherwise commit to expending appropriated funds. Many government policymakers and
procurement experts monitor money obligated on prime federal contracts through the publicly
accessible beta.SAM.gov Data Bank reporting tool (as of October 17, 2020, FPDS-NG data is
now only available through beta.SAM.gov as part of an ongoing General Services Administration
effort to consolidate and simplify information sources and data input portals related to U.S.
government procurement). There is no public database that report federal contract outlays (i.e.,
payments made by the U.S. federal government) as comprehensively as the beta.SAM.gov Data
Bank provides access to obligations data.25 The beta.SAM.gov Data Bank reports the net amount
of funds obligated or deobligated (i.e., a downward adjustment of reported contract obligations
due to factors such as reductions in material prices or the termination of some portion of
contracted activities) by a contract transaction. If the net amount of a transaction is a
deobligation, the transaction will be represented as a negative amount in the beta.SAM.gov Data
Bank.
The data used by CRS allocates place of performance based on the principal contract place of
performance as identified by the beta.SAM.gov Data Bank. Because the beta.SAM.gov Data
Bank only allows one country to be listed as the place of performance, contracts listed as being
performed in one country can also involve substantial performance in other countries. As such,
activities undertaken primarily in other countries excluded from the defined Afghanistan and Iraq
areas of operation in support of U.S. military activities, such as contracted activities undertaken at

23 Joint Chiefs of Staff, “Joint Operations,” Joint Publication 3-0, January 17, 2017, incorporating change 1 of October
22, 2018, available at https://www.jcs.mil/Portals/36/Documents/Doctrine/pubs/jp3_0ch1.pdf.
24 CBO, Contractors' Support of U.S. Operations in Iraq, August 12, 2008, available at

https://www.cbo.gov/publication/41728.
25 Contracting officials must report most contract actions to FPDS-NG, as required by the Federal Acquisition

Regulation (FAR).

Congressional Research Service                                                                                         19
You can also read


