Knowing our patch Equality related demographic profile for - zH Version control
←
→
Page content transcription
If your browser does not render page correctly, please read the page content below
zH   Knowing our patch
     Equality related demographic profile for

     Herefordshire and
     Worcestershire CCG
Version control
     Collated by MLCSU Equality and Inclusion Team
     July 2020

                                                     1
Date issued            July 2020
Date to be reviewed:   Periodically
Date to be reviewed:   July 2021
Document Summary       Provides information to help CCG
                       commissioners and CCG staff in
                       understanding the demographic picture
                       of their communities.
Version No:            1.0
Issued By:             MLCSU Equality and Inclusion team
Author(s)              Equality and Inclusion Team – Midlands
                       and Lancashire Commissioning Support
                       Unit
Review Date:

                                                                2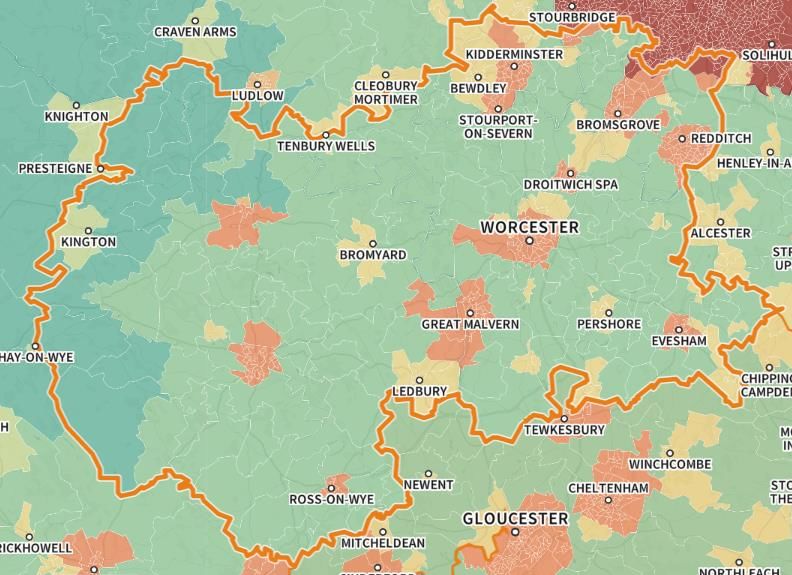
Contents
                                                                               Page
1.0 Introduction                                                                 4
2.0 Protected characteristic of Age                                              6
3.0 Protected characteristic of Disability and Carers                            8
4.0 Protected characteristic of Gender Reassignment                             12
5.0 Protected characteristic of Marriage and Civil Partnership                  13
6.0 Protected characteristic of Race                                            14
7.0 Protected characteristic of Religion and Belief                             16
8.0 Protected characteristic of Sex                                             17
9.0 Protected characteristic of Sexual Orientation                              18
10.0 Protected characteristic of Pregnancy and maternity                        19
11.0 Vulnerable groups: Deprivation                                             20
12.0 Vulnerable groups: Asylum and Refugees                                     23
13.0 Vulnerable groups: Homelessness                                            24
14.0 Vulnerable groups: Veterans and Military families                          25
15.0 Vulnerable groups: Rural Communities                                       27
16.0 Health Inequalities                                                        30
17.0 Other health related data – from Public Health England – fingertip data    33
18.0 Evaluation of data sets                                                   39
19.0 List of data sources                                                       39

                                                                                  3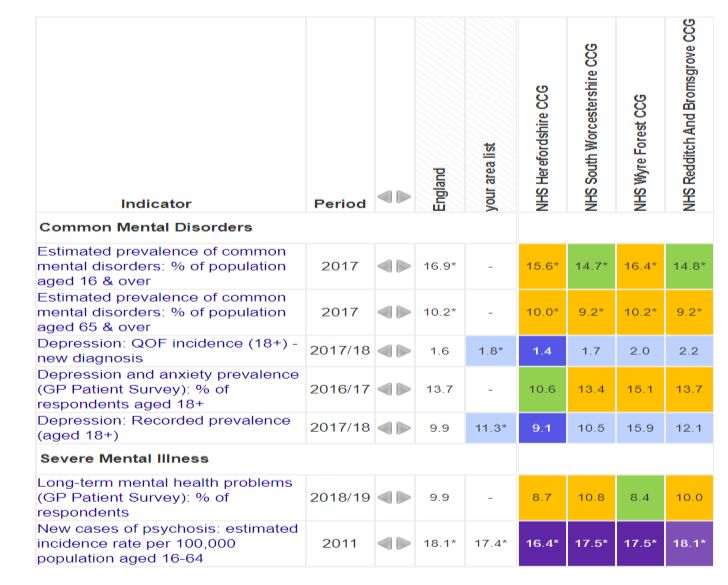
1.0 Introduction
When considering service design / policy changes, CCGs are required by legislation
to consider the needs and requirements of each protected characteristic group and
ensure that appropriate involvement / consultation takes place with these groups.
Consideration of requirements relating to protected characteristic groups at the
beginning of service redesign process will help to identify any potential negative
impact that may arise relating to protected characteristic and will help demonstrate
‘due regard’ to the Public Sector Equality Duty.
CCGs are better equipped to understand the needs of their communities by being
able to understand the demographic profiling of their area. This helps understand the
make-up of different groups within the CCG area and identify the potential barriers
for access / particular needs of different groups.
This report provides data on the following:
• Demographic profiles for the area
• Health inequality information from public health and JSNA data
All data sources and links are contained within section 19.0.
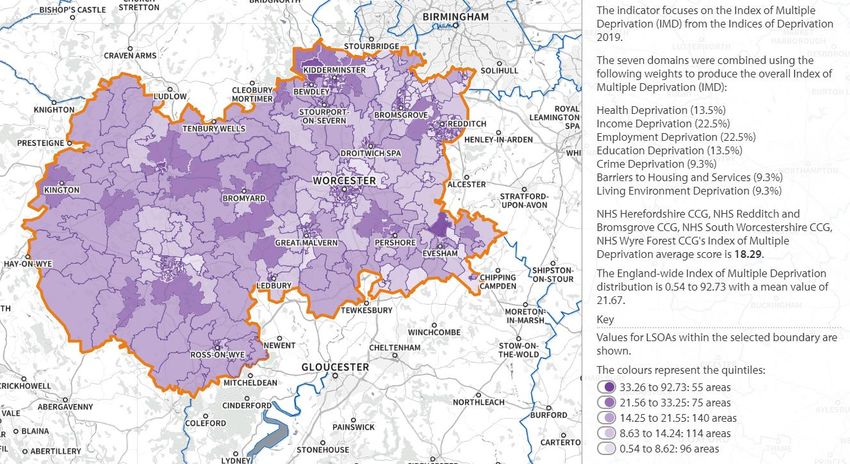
The Herefordshire and Worcestershire area
NHS Herefordshire and Worcestershire CCG is located in the midlands of England
and are part of the Herefordshire and Worcestershire Sustainability and
Transformation Partnership (NHS STP).
Prior to April 2020, the CCG boundary consisted of the following CCGs:
NHS Herefordshire CCG
NHS Redditch and Bromsgrove CCG
NHS South Worcestershire CCG
NHS Wyre Forest CCG
Due to the date and data sets available, these previous boundaries may be used to
collate data sets.
The CCG has a membership of 84 GP practices and serves a patient population of
approximately 802,441. Currently, there are 16 primary care networks established
across the area.
The main NHS service providers in the CCG area include:
• Gloucestershire Health and Care NHS Foundation Trust
• West Midlands Ambulance Service University NHS Foundation Trust
• Worcestershire Acute Hospitals NHS Trust
4
•   Worcestershire Health and Care NHS Trust
•   Wye Valley NHS Trust

Local authority areas that fall within the area are:
•   Bromsgrove
•   County of Herefordshire
•   Malvern Hills
•   Redditch
•   Worcester
•   Wychavon
•   Wyre Forest
Key transport links include the M5 and M50 motorways. Other key infrastructure in
the CCG area include 279 care homes, over 320 schools, one university, and two
prisons.

Map of the Herefordshire and Worcestershire area:

Source: SHAPE © Crown copyright and database rights 2018 Ordnance Survey 100016969 accessed
28/5/2020

                                                                                              5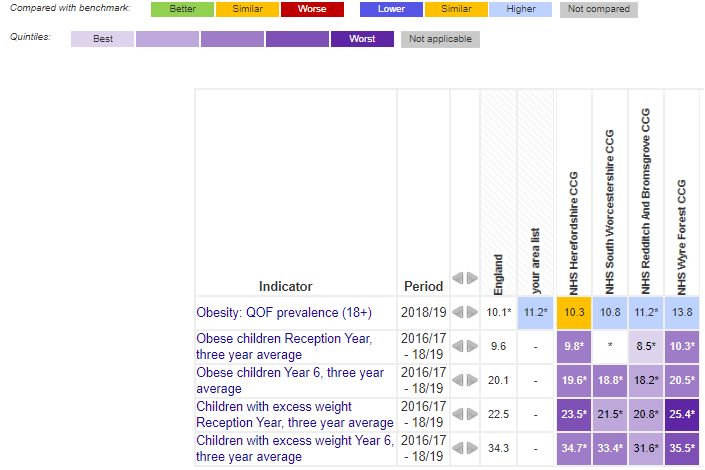
2.0 Protected characteristic of Age

The following age profiles are shown for each CCG with male and female population:

Source: Public Health England. Public Health Profiles. [01/06/2020] https://fingertips.phe.org.uk ©
Crown copyright 2020

Analysis:
  • Across the area, there is variation in age with the population being slightly older
      than the national rate overall with significantly higher rates of people aged 50
      and over in Herefordshire, South Worcestershire and the Wyre Forest areas

                                                                                                      6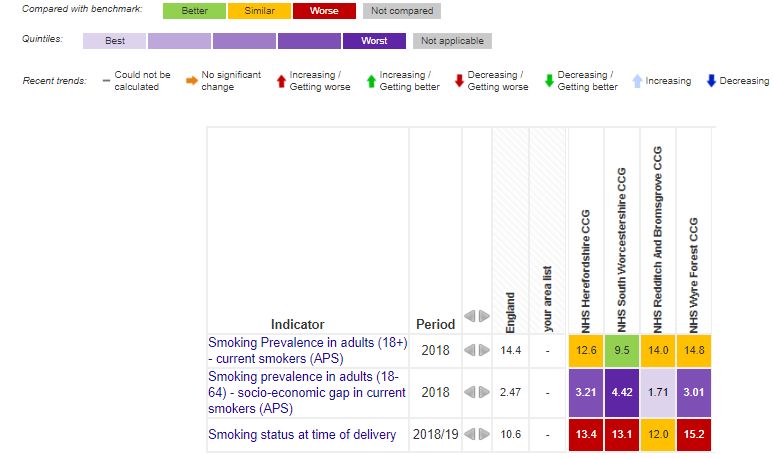
•   There are significantly lower rates of people between the age groups of 20-24
       and 40-44
   •   The Herefordshire and Wyre Forest areas have significantly higher rates of
       older people and significantly lower rates of younger people – this will affect the
       demand of and type of health care provision in the area, especially for services
       related to age including long term health conditions, disabilities including sight
       and hearing loss, pregnancy, maternity and child services and health
       inequalities
   •   There are also lower numbers of people between age 20-24 and 40-44 living in
       the South Worcestershire and Redditch and Bromsgrove areas

Equality considerations relating to age:
  • Aging population may add additional pressures on existing services
  • Certain health conditions are more prevalent in particular age groups e.g.
      dementia rates are higher in over 65s
  • There may be links with disability for older age groups due to issues such as
      long-term health conditions and frailty
  • Older people are more likely to develop hearing and sight impairments
  • Older people and younger people are less likely to have access to a car and
      therefore may rely on public transport to access services
  • Older people are more likely to be widowers and experience social isolation
  • Working age groups may experience barriers to accessing services during
      working hours
  • Cross referencing with disability, young men are more likely to commit suicide

                                                                                        7
3.0 Protected characteristic of Disability

Learning disability / long term conditions / carers:

Source: Public Health England. Public Health Profiles. 27/4/2020 https://fingertips.phe.org.uk ©
Crown copyright 2020

Analysis:

    •   The prevalence of patients with a disability is fairly in line with the national
        prevalence with some small variations across the CCG area
    •   The prevalence of patients with long term health conditions is higher than the
        national prevalence
    •   The percentage of carers in the area is slightly higher than the national rate

                                                                                                   8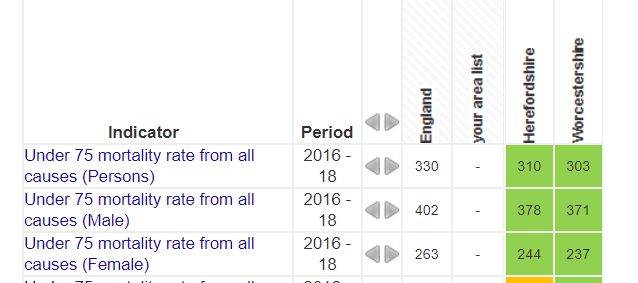
Disability prevalence:

 Government data shows that:

  Disability prevalence by region/country
  2017/18, United Kingdom

                                                            Millions of
                                                                                           Percentage of people
  Region/Country                                                people

  United Kingdom                                                     13.3                                    21
  Country
    England                                                          10.9                                    20
  Region
    North West                                                         1.6                                   23
    East Midlands                                                      1.0                                   22
    West Midlands                                                      1.2                                   21

  https://www.gov.uk/government/statistics/family-resources-survey-financial-year-201718

 Physical disabilities

 Visual impairment:

  2020 data set: RNIB                                                           England              Newly
                                                                                                     merged
                                                                                                     CCG
  Number of people living with sight                                            182,000              61,400
  loss
  Percentage of people from population                                          3.21%                3.46%
  with sight loss

 Best fit data – Local Authority level. Worcestershire and Herefordshire data used.
 Further data available on sight data on age, ethnic group.

 Best fit data – Local Authority and District level. Further visual impairment data is
 available on age, ethnic group.

 Hearing impairment:

Estimated prevalence (%) of hearing loss of 25 dBHL or more in the adult
population (people aged 18 and over)

                                                                                                                  9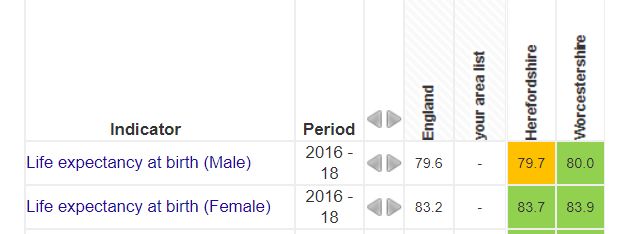
CCG (previous CCGs)            2015         2020        2025          2030        2035

Herefordshire                  25           27          28            30          31
Redditch and
Bromsgrove                     23           24          26            27          29
South Worcestershire           24           26          27            29          30
Wyre Forest                    25           27          29            30          31
England                        21           22          23            24          25
 Source: https://www.england.nhs.uk/publication/joint-strategic-needs-assessment-toolkit/

 Dementia:
 Data table showing prevalence of dementia diagnosis:

                  England Newly            Hereford South          Wyre                 Redditch
                          merged                    Worcestershire Forest               and
                          CCG                                                           Bromsgrove
  Dementia        0.8%    0.9%             1.0%         0.8%                 0.9%       0.8%
  prevalence
  all ages
 Source: Public Health England. Public Health Profiles. [01/06/2020] https://fingertips.phe.org.uk ©
 Crown copyright 2020

 Mental Health:

 Source: Public Health England. Public Health Profiles. [01/06/2020] https://fingertips.phe.org.uk ©
 Crown copyright 2020

                                                                                                       10
Analysis:
• There is some variation across the CCG area, but overall prevalence of
common mental health conditions are similar or better than England rates
• Prevalence rate for depression is highest in the Wyre Forest area
• Severe mental health problems are similar to England rates
Equality considerations relating to disability:
• Access to services
• Language needs and information needs – accessible information e.g. large
font, Easy Read, BSL
• Reasonable adjustments
• Physical environment
• Travel and parking
• Facilities
• Carers and support
Equality considerations for carers:
The health needs of this carers are highlighted in a report by Carers UK – State of
Caring 2017. This report is important in highlighting significant disadvantages faced
by carers nationally. The report highlights:
• Caring can have a significant impact on health – both physically and mentally
• GP patient surveys found that 3 in 5 carers have a long term health condition
• Health conditions in 40% of young carers (aged 18-24 years) compared to
29% of non-carers in the age group
• Back and mobility health problems are often acerbated by lack of access to
proper lifting equipment and aids
• Carers health often compromised by lack of time to attend medical check-up
for their own wellbeing
• 6 out of 10 carers (61%) reported that their physical health has worsened due
to caring
• 7 out of 10 carers (70%) reported that their mental health had worsened due
to caring
• Worsening health reporting was more prevalent in carers providing more than
50 hours per week
• Carers looking after a disabled child were most likely to suffer from
depression – 54%
• Carers report that keeping healthy is more difficult due to difficulty in finding
time for exercise and maintaining a healthy diet
114.0 Protected characteristic of Gender
Reassignment
Population data for this group is not collected within national census data, however, estimate
figures are thought to be in the region of 0.5%
NHS Herefordshire and Worcestershire CCG serves a population of 800,888 people,
therefore, the local trans population is estimated at approximately 4000.
Estimated figures also suggest that around 1% of the population identify as non-binary.
Equality considerations relating to Gender Reassignment/Trans:
• LGBT rights charity Stonewall published a report on transgender experiences
in 2018. The report highlights that a significant number of trans people face
inequalities and discrimination when accessing healthcare services, despite
the legal duty of all health and social care organisations to provide equal
treatment and tackle discrimination
• Poorer experiences of health care – staff attitudes and understanding
• More likely to experience poor mental health/more likely to attempt suicide
• Lower rates of health screening e.g. cervical
• More likely to be a victim of hate crime
• Fear of prejudice can create a barrier to access services
• More likely to be a victim of domestic abuse
125.0 Protected characteristic of Marriage and Civil
Partnership
In a registered same-
Area Married
sex civil partnership
England 46.6 0.2
NHS Herefordshire 51.8 0.2
NHS Redditch and Bromsgrove 51.8 0.2
NHS South Worcestershire 51.3 0.2
NHS Wyre Forest 49.8 0.1
The protected characteristic relates only to employment and not service provision.
Within the context of this assessment the impact can relate to workforce issues.
Across the area,
• there are higher rates of marriage compared to the national rate
• The rate of civil partnerships are similar / same as the national rate
Equality considerations for marriage and civil partnership:
• Discrimination in the workplace/lack of promotion opportunities and
unfavourable treatment
• Flexible working arrangements
136.0 Protected characteristic of Race
NHS South NHS NHS Redditch
Ethnic Group England NHS Wyre Forest
Worcestershire Herefordshire and Bromsgrove Combined area
number % number % number % number % number % number %
All usual 53,012,456 100.0 290,343 100.0 183,477 100.0 177,851 100.0 97,975 100.0 749646 100.0
residents %
White 45,281,142 85.4 279,592 96.3 180,169 98.2 167,193 94.0 95,273 97.2 722227 96.3%
White: 42,279,236 79.8 268,869 92.6 171,922 93.7 161,231 90.7 92,822 94.7 694844 92.7%
English/Welsh/
Scottish/North
ern
Irish/British
White: Irish 517,001 1.0 1,488 0.5 709 0.4 1,533 0.9 459 0.5 4189 0.6%
White: Gypsy 54,895 0.1 706 0.2 363 0.2 84 0.0 375 0.4 1528 0.2%
or Irish
Traveller
White: Other 2,430,010 4.6 8,529 2.9 7,175 3.9 4,345 2.4 1,617 1.7 21666 2.9%
White
Mixed/multiple 1,192,879 2.3 2,996 1.0 1,270 0.7 3,051 1.7 998 1.0 8315 1.1%
ethnic groups
Mixed/multiple 415,616 0.8 1,005 0.3 407 0.2 1,684 0.9 461 0.5 3557 0.5%
ethnic groups:
White and
Black
Caribbean
Mixed/multiple 161,550 0.3 360 0.1 146 0.1 157 0.1 75 0.1 738 0.1%
ethnic groups:
White and
Black African
Mixed/multiple 332,708 0.6 1,015 0.3 415 0.2 763 0.4 275 0.3 2468 0.3%
ethnic groups:
White and
Asian
Mixed/multiple 283,005 0.5 616 0.2 302 0.2 447 0.3 187 0.2 1552 0.2%
ethnic groups:
Other Mixed
Asian/Asian 4,143,403 7.8 6,397 2.2 1,439 0.8 5,954 3.3 1,390 1.4 15180 2.0%
British
Asian/Asian 1,395,702 2.6 1,537 0.5 490 0.3 1,798 1.0 299 0.3 4124 0.6%
British: Indian
Asian/Asian 1,112,282 2.1 2,050 0.7 80 0.0 2,801 1.6 133 0.1 5064 0.7%
British:
Pakistani
Asian/Asian 436,514 0.8 573 0.2 32 0.0 231 0.1 512 0.5 1348 0.2%
British:
Bangladeshi
Asian/Asian 379,503 0.7 915 0.3 277 0.2 518 0.3 168 0.2 1878 0.3%
British:
Chinese
14Asian/Asian 819,402 1.5 1,322 0.5 560 0.3 606 0.3 278 0.3 2766 0.4%
British: Other
Asian
Black/African/ 1,846,614 3.5 852 0.3 331 0.2 1,306 0.7 214 0.2 2703 0.4%
Caribbean/Bla
ck British
Black/African/ 977,741 1.8 412 0.1 160 0.1 270 0.2 85 0.1 927 0.1%
Caribbean/Bla
ck British:
African
Black/African/ 591,016 1.1 345 0.1 103 0.1 825 0.5 105 0.1 1378 0.2%
Caribbean/Bla
ck British:
Caribbean
Black/African/ 277,857 0.5 95 0.0 68 0.0 211 0.1 24 0.0 398 0.1%
Caribbean/Bla
ck British:
Other Black
Other ethnic 548,418 1.0 506 0.2 268 0.1 347 0.2 100 0.1 1221 0.2%
group
Other ethnic 220,985 0.4 115 0.0 105 0.1 107 0.1 14 0.0 341 0.0%
group: Arab
Other ethnic 327,433 0.6 391 0.1 163 0.1 240 0.1 86 0.1 880 0.1%
group: Any
other ethnic
group
Analysis:
• Across the area, representation from people from White British backgrounds are
significantly higher than the England rate
• Representation from BME backgrounds are significantly lower than the England
rate with only 2.0% from Asian backgrounds compared to England 7.8%
• There is no significant variation across the area in terms of BME percentage
• For traveller community, there is some variation with slightly higher rates
compared to the England rate. Within the area, Wyre Forest area has highest
representation with 0.4% population
Equality considerations for race:
• Access to language support
• Cultural considerations
• Certain health conditions affect different ethnic groups e.g. diabetes
prevalence in South East Asian men
• Health inequalities in relation to BAME groups – cross reference with
deprivation
• Poorer experiences of healthcare for BAME groups
• Poorer experiences of BAME groups in the workplace
• Health needs of BAME groups often not well understood
• BAME groups more likely to be a victim of hate crime
157.0 Protected characteristic of Religion and Belief
NHS
NHS NHS South
Redditch and NHS Wyre Combined
Religion Herefordshire Worcestershi England
Bromsgrove Forest CCG CCGs
CCG re CCG
CCG
Christian 67.8% 66.3% 67.9% 68.7% 67.6% 59.4%
Buddhist 0.3% 0.2% 0.3% 0.2% 0.2% 0.5%
Hindu 0.1% 0.3% 0.2% 0.1% 0.2% 1.5%
Jewish 0.1% 0.1% 0.1% 0.0% 0.1% 0.5%
Muslim
0.2% 1.9% 1.2% 0.7% 1.0% 5.0%
(Islam)
Sikh 0.0% 0.5% 0.2% 0.1% 0.2% 0.8%
Other religion 0.5% 0.3% 0.4% 0.3% 0.4% 0.4%
No religion 22.8% 23.8% 23.0% 23.1% 23.2% 24.7%
Religion not
8.2% 6.6% 6.9% 6.7% 7.1% 7.2%
stated
Source: Census 2011 data, NOMIS official labour market statistics, https://www.nomisweb.co.uk/
Please note the data in the table above relates to the 2011 Census, and therefore
may not reflect current populations in CCG areas.
Analysis
• The most common religious affiliation in the CCG area is Christianity, with the
proportion of people identifying as Christian higher than the England comparator
• The data highlights that the area is less diverse in terms of the strands of religion
and belief followed compared to England in general – the proportion of people
who identify as following religions other than Christianity in the Herefordshire and
Worcestershire CCG area is lower than the national equivalents (particularly in
terms of people who identify as Muslim and Hindu)
Equality considerations relating to religion and belief:
• Facilities e.g. prayer rooms / changing rooms
• End of life plans – spiritual needs of patients considered
• Chaplaincy service
• Human resource policies relating to religious festivals/needs e.g. Ramadan
• Workforce considerations - dress
• Belief impacting on how patients view their care
• Ingredients of medication/compatibility of religious belief
• Cultural considerations for care – chaperone
• Dietary requirement
168.0 Protected characteristic of Sex
Cross reference with Age section which contains population profiles for male and
females cross referenced with age.
Chart showing males and females with comparison of national population.
Population sex profile (GP registered population)
NHS Combined
NHS
NHS NHS South Redditch Herefordshire
Wyre
Herefordshire Worcestershire and and England
Forest
CCG CCG Bromsgrove Worcestershire
CCG
CCG CCGs
Male 93,112 155,860 89,269 58,289 396,530 29,849,678
Female 94,741 158,746 89,484 58,735 401,706 29,909,960
Total 187,853 314,606 178,753 117,024 798,236 59,759,638
Source: Public Health England. Public Health Profiles. [08/06/2020] https://fingertips.phe.org.uk ©
Crown copyright 2020
Analysis:
• Across the area, there are more females than males – this is in line with the
national sex demographic
• Each individual CCG area has more females than males living in the area
• There are 5176 more females living across the Herefordshire and
Worcestershire area in comparison to males
Equality considerations relating to Sex:
• Certain conditions affect males/females
• Females have longer life expectancy compared to males
• Workforce considerations:
o Human resource policies – menopause, caring responsibilities
o Gender pay gap
o Flexible working arrangements
• Personal safety
• Facilities – single sex changing rooms etc.
• Chaperone services
• Young men are more likely to experince mental health issues/commit suicide
• Health promotion and screening
179.0 Protected characteristic of Sexual Orientation
Table showing estimated Lesbian, Gay and Bisexual population:
Estimate source % LGB Estimate population who % heterosexual
are Lesbian, gay and
bisexual
England – 5-7% - 93-95%
Stonewall
England - ONS 2.2% - 94.6%
CCG 2.2 to 7% 17,560 to 55,800 -
In terms of age and sexual orientation, ONS data shows that people aged 16-24
were more likely to identify as LGB compared to other age groups. The proportion of
people identifying as LGB decreases in each successive age group.
Equality considerations relating to sexual orientation:
• National research notes that the LGB community face barriers and
disadvantage when accessing health and social care
• Stonewall found that 52% of people surveyed in 2018 had experienced
depression in the previous year, and 31% of LGB people had thought about
taking their own life
• 15% of people surveyed by Stonewall in 2018 smoked almost every day,
which is slightly higher compared to ONS data regarding the proportion of the
general population (14.7%)
• Stonewall’s 2018 report found that one in six LGBT (16%) people surveyed
drank alcohol every day, compared with one in ten people in the general
population. 13% of LGBT people surveyed took drugs at least once a month
• Information from Public Health England suggests that cancer screening
coverage is lower in LGB and T communities. In particular, lesbian and
bisexual women are less likely to attend cervical screening: 15% of lesbian
and bisexual women over 25 have never had a test, compared to 7% of the
general population
• Barriers to accessing healthcare include;
o Fear, or experience, of discrimination when accessing services
o Assumptions of sexuality
o Inappropriate curiosity and insensitive questions
o Lack of understanding from healthcare staff regarding LGB health needs
1810.0 Protected characteristic of Pregnancy and
maternity
The table below shows best fit pregnancy and birth data captured from the PHE
Fingertips website:
NHs
NHS
NHS Redditch NHS South
Wyre
Indicator Year Herefordshire and Worcesters England
Forest
CCG Bromsgrove hire CCG
CCG
CCG
Percentage of deliveries to 2018/
2.8% 8.6% 4.8% 5.7% 20.6%
mothers from BME groups 19
58.2 per 61.1 per 58.5 per 62.1 per 61.2 per
General fertility rate 2017
1000 1000 1000 1000 1000
2018/
Caesarean section 33.1% 29.3% 29.2% 30.5% 29.7%
19
12.2 per 14.2 per 15.9 per 13.2 per 15.9 per
Multiple births 2017
1000 1000 1000 1000 1000
Low birth weight of all
2017 6.6% 7.5% 7.1% 8.3% 7.4%
babies
Very low weight of all
2017 0.98% 1.82% 1.14% 1.60% 1.14%
babies
2016- 2.7 per 4.1 per 3.8 per 3.9 per 4.2 per
Stillbirth rate
18 1000 1000 1000 1000 1000
Admissions of babies 2018/ 95.1 per 61.3 per 57.0 per 42.9 per 75.0 per
under 14 days 19 1000 1000 1000 1000 1000
2018/ Data not Data not
Teenage mothers 0.6% 0.7% 0.6%
19 available available
Baby’s first feed 2018/
68.3% 61.3% 60.9% 51.7% 67.4%
breastmilk 19
Source: Public Health England. Public Health Profiles. [01/06/2020] https://fingertips.phe.org.uk ©
Crown copyright 2020
Analysis
• Across the Herefordshire and Worcestershire CCG area, the proportion of births
to mothers from BAME groups is significantly lower than the national rate
• The general fertility rate in the CCG area is largely in line with the national
comparitor
• There is a slightly higher incidence of caesarean section births in the
Herefordshire locality than the rest of the CCG area, and England in general
• The prevalence of low / very low birth weight rate is in line with national values,
however the Wyre Forest area experiences a slightly higher rate of low birth
weights compared with the rest of the CCG area and England in general
19• The rate of stillbirth is generally in line with England in general, however the
Herefordshire area sees a significantly lower rate compared to the other localities
of the CCG and England as a whole
• the CCG area generally sees better outcomes in terms of the incidence of
hospital admissions for babies under 14 days old – the Herefordshire area of the
CCG is an exception, where the rate of hospital admission is higher than the
national figure
Equality considerations for pregnancy and maternity:
• Workforce issues: Human resource policies – pregnancy, maternity and
paternity
• Facilities such as baby changing, parent and child parking, breast feeding
rooms, pram space/parking
• Better Births Report – disproportionate experiences for BAME mothers and
mothers from lower income backgrounds
• Cultural considerations – link with care plans
• Link to certain conditions during perinatal period e.g. post-natal depression
2011.0 Vulnerable groups: Deprivation
Deprivation data for the area:
Source: Public Health England. Public Health Profiles. [01/06/2020] https://fingertips.phe.org.uk ©
Crown copyright 2020
Higher deprivation areas denoted by darker shades of purple:
Source: Public Health England. Public Health Profiles. [01/06/2020] https://fingertips.phe.org.uk ©
Crown copyright 2020
21Analysis:
• There is variation in deprivation levels across the CCG area with overall lower
deprivation compared to England
• Highest deprivation levels are near Evesham area, Kidderminister
• Across the old CCG boundaries, deprivation score is highest for Wyre Forest
which is slightly higher than the England rate
See section on health inequalities for details on link between health outcomes and
deprivation.
2212.0 Vulnerable groups: Asylum and Refugees
Asylum and Refugee (ASR) population information
As at 31 December 2019, there were 43,549 asylum seekers in receipt of Section 95
support in the UK. Best fit local authority level data for the local area shows that
there were approximately 5 asylum seekers in receipt of Section 95 support:
Number of ASR in receipt of Section 95 support in CCG area as at 31
December 2019
England 35,997
West Midlands region 5236
County of Herefordshire 0
Redditch 5
Bromsgrove 0
Malvern Hills 0
Worcester 0
Wychavon 0
Wyre Forest 0
Further information regarding the ASR programme in the local area is available via
Herefordshire Council and Worcestershire County Council websites. Information
regarding the ASR local area e.g. population trends is available via The Migrant
Observatory Local Data Guide (links below).
Asylum and Refugee health related information
People claiming asylum or holding refugee status are recognised as being at risk of
experiencing complex health problems. The most common health problems are:
• Communicable diseases (e.g. hepatitis, TB, HIV / AIDS, malaria)
• Chronic diseases (e.g. COPD, cardiovascular disease, diabetes)
• Sexual health related needs
• Dental conditions
• Injury due to torture
• Poor mental health / psychosomatic disorders. Compared to the general
population, the incidence of mental illness is higher in this group
• Women’s health issues and disability issues
2313.0 Vulnerable groups: Homelessness
Owed a prevention /
Total Assessment relief of duty Rough sleepers
ENGLAND 75,520 71,570 2466
Worcester 200 199 19
Herefordshire, County of 128 121 29
Redditch 119 117 2
Wyre Forest 108 108 6
Bromsgrove 69 66 3
Best data set data used where available
People who don’t have a home are described as homeless; this is not just people
living on the streets. Homelessness can include people:
• Staying with friends or family
• Staying in a hostel or bed & breakfast accommodation
• Squatting
• At risk of violence or abuse in their home
• People living in poor conditions that affects their health
• Living apart from their family because they don’t have a place to live together
There is no single reason why someone can end up without a home. Personal
circumstances and wider factors both play their part. Homelessness can be
devastating, dangerous and isolating for those who experience it.
2414.0 Vulnerable groups: Veterans and Military
families
Military Veterans data set:
A veteran is someone who has served in the armed forces for at least one day.
2017
% Veterans % Non-veterans
2,401,000 48,903,000
UK 5% 95%
Herefordshire 8% 92%
Worcestershire 5% 95%
Data is best fit.
Royal British Legion produce the national household survey which summarises data
and needs of military veterans. Summary data includes:
• 90% of veterans are male.
• Veterans are less likely to be single (10%) and more likely to be widowed (16%)
compared to non-veterans (10%).
• Veterans are predominantly white (98%). Although 2% of veterans are from Black
and Minority Ethnic groups (BAME) this may include Gurkhas – from Nepal served
in the British Army
• Herefordshire has a significantly higher percentage of veterans compared to the
UK rate.
Age profile percentage - veterans compared to non
veterans
20.0%
15.0%
10.0%
5.0%
0.0%
16-19 20-24 25-29 30-34 35-39 40-44 45-49 50-54 55-59 60-64 65-69 70-74 75-79 80-84 85-89 90+
Key: Purple: veterans. Green: Non veterans
25General health of veterans:
General health of veterans
compared to non veterans aged
16-64
60%
40%
20%
0%
Very Good Good Fair Bad Very Bad
Veterans % Non veterans %
General health for veterans and
non veterans aged over 65
50%
40%
30%
20%
10%
0%
Very Good Good Fair Bad Very Bad
Veterans >65 % Non veterans >65 %
Analysis:
• 2016: there were estimated 2.5 million UK Armed Forces veterans.
• UK Veteran population is elderly and declining in size. 49% of veterans are
aged over 75 compared to non-veterans 8%
• The high rate of older veterans can be related to those who undertook
National Service which officially ended at the end of 1960
Key information about Armed Forces can be found at:
https://www.local.gov.uk/sites/default/files/documents/1.17%20LAs%20Mythbuster%20resource_v06.
pdf
2615.0 Vulnerable groups: Rural Communities
The Office for National Statistics rural-urban classification (RUC2011) allows for a
consistent approach when viewing rural/urban datasets.
Output areas are defined as rural if there is a population size of 10,000 or less.
Output areas with a population size of over 10,000 are classed as urban. Further
information regarding the rural-urban classification is available on the ONS website.
Map showing NHS Herefordshire and Worcestershire CCG’s area rural-urban
population
SHAPE © Crown copyright and database rights 2018 Ordnance Survey 100016969 accessed
28/5/2020
9.5 million (17% of population) people live in areas defined as rural in England. It is
challenging to fully understand rural areas as available data is limited and less
specific in focus compared to urban data.
27Graph showing percentage of population within age bands by rural-urban
classification (LSOA) in England, 2018:
Analysis:
• In terms of ethnicity, the proportion of BME groups has risen slightly over the
last five years in rural areas, however 97.6% of the rural population in
England falls into White ethnic groups
• The NHS Herefordshire and Worcestershire CCG area is largely rural,
including dispersed populations in sparse rural settings in the west of the
CCG area. There are pockets of urban towns and cities, including Worcester,
Redditch, Bromsgrove and Kidderminster.
Rural communities health related information
As there is complexity and diversity in rural areas that make it difficult to understand
rural areas as a whole, caution must be taken when considering rural communities.
However, available data highlights that there are general demographic and health-
related considerations for this vulnerable group:
• Population pattern – outward migration of young people and inward migration of
older people, are leading to a rural population that is increasingly older than the
urban population, with accompanying health and social care needs
• Access to health and social care services e.g. longer travel distances, increased
travel costs and scarcity of public transport links to access services
28• Digital exclusion resulting from a combination of older population and the
unavailability of high-speed broadband / mobile phone networks are leading to an
increasing digital gap
• Social isolation / exclusion. This may also include marginalisation and lack of
social connections felt by protected groups such as LGBT and/or people living
with a disability, as well as those who are divorced or living alone
• Health impacts of rural housing and/or fuel poverty
• In terms of ethnicity, the proportion of BME groups has risen slightly over the last
five years in rural areas, however 97.6% of the rural population in England falls
into White ethnic groups
Equality considerations relating to vulnerable groups listed above:
• People living in deprived areas are more likely to have poorer health
outcomes
• Veterans – mental illness, MSK, hearing loss and liver, kidney and digestion
problems. Veterans are more likely to smoke compared to non veterans
• Asylum and Refugees – social invisibility, stereotyping, social stigma, cultural
considerations, language/communication needs, barriers to accessing
services, healthcare needs related to ASR status (as detailed in section 12.0)
• People experiencing homelessness – complex and multiple health needs,
poorer health outcomes, lower life expectancy, barriers to accessing primary
care services, lack of understanding of health and social care entitlements,
stigma and stereotyping
• Rural communities – social isolation, barriers to accessing health and social
care due to longer travel distances, poor public transport links and/or digital
exclusion
2916.0 Health Inequalities
Health is determined by a complex mix of factors including income, housing and
employment, lifestyles and access to health care and other services. Significant
inequalities in health exist between individuals and different groups in society. In
particular, there is a ‘social gradient’ in health; neighbourhood areas with higher
levels of income deprivation typically have lower life expectancy and disability-free
life expectancy.
Key themes relating to health inequalities include:
Life expectancy
Best fit data used for Local Authority areas.
Mortality profiles
Table showing Under 75 mortality rates from all causes:
3031
Source: Public Health England. Public Health Profiles. [29/05/2020] https://fingertips.phe.org.uk ©
Crown copyright 2020

Analysis:
•   Nationally and locally, there is variation across life expectancy for males and female
•   Males have higher mortality rates across all causes compared to females
•   Across Herefordshire and Worcestershire areas, life expectancy is either better or similar
    to the England rate
•   Across the area, mortality and causes are better than the England rates with no
    significant worse mortality causes

Further information can be found within the Rightcare Health Equality and Inequality
report: https://www.england.nhs.uk/publication/equality-and-health-inequalities-packs-2018-north/

                                                                                                      32
17.0 Other health related data – from Public Health
England – fingertip data
Child health data set:
Source: Public Health England. Public Health Profiles. [01/06/2020] https://fingertips.phe.org.uk ©
Crown copyright 2020
Analysis:
• Across the CCG, infant mortality rates are similar to England rates
• Immunisation rates across the CCG are better than England (MMR)
33• Obesity rates for children in year 6 are similar to England
• There is variation for breastfeeding rates with poorest rates in Wyre Forest area
Diabetes data set:
Source: Public Health England. Public Health Profiles. [03/07/2020] https://fingertips.phe.org.uk ©
Crown copyright 2020
Analysis:
• Across the area, there are higher rates of diabetes prevalence when
compared with the England rate
• NHS Redditch and Bromsgrove has a significantly higher rate of diabetes
prevalence than England
• There are higher rates of diabetes prevalence in each area within the region
with the exception of NHS Herefordshire which has similar rates to England
Sexual Health data sets:
Source: Public Health England. Public Health Profiles. [17/06/2020] https://fingertips.phe.org.uk ©
Crown copyright 2020
34Analysis:
• Across the area, there is variation in the rates of Chlamydia diagnosis
• Overall, there are lower rates of Chlamydia diagnosis compared with England
• The diagnostic rate of Chlamydia is highest in the Worcester area
• Wyre Forest has the lowest rates of Chlamydia diagnosis across the area
• Across the area, there are lower rates of people testing positive for STIs overall
when compared to England
• Redditch has the highest rate of positive STI testing across the area – this rate is
similar to the England rate
Smoking and Tobacco data set:
Source: Public Health England. Public Health Profiles. [11/06/2020] https://fingertips.phe.org.uk ©
Crown copyright 2020
Analysis:
• Across the area, there is variation in smoking prevalence
• Overall, the rates of smoking prevalence across the area are slightly lower than
the national rate
• NHS South Worcestershire has particularly low rates of smoking prevalence
compared with the national rate
• There are significantly high rates of socio-economic gaps and smoking
prevalence across the area with significantly high rates in the NHS Wyre Forest
area
35Obesity data set:
Source: Public Health England. Public Health Profiles. [12/06/2020] https://fingertips.phe.org.uk ©
Crown copyright 2020
Analysis:
• Across the area, there are slightly higher rates of obesity prevalence compared to
the national rate
• NHS Wyre Forest has the highest (worst) rate of obesity prevalence across the
area and when compared to the national rate
• There are slightly higher (worse) rates of obese children in Reception
• Across the area, the rates of obese children in year 6 is slightly lower than the
national rate
• There are generally higher (worse) rates of the number of children with excess
weight across the area
36Alcohol and substance misuse data set:
Source: Public Health England. Public Health Profiles. [29/05/2020] https://fingertips.phe.org.uk ©
Crown copyright 2020
Analysis:
• There is some variation across the area
• Substance misuse data is across the is similar to the England rate for people
living in Herefordshire.
• People in Worcestershire have significantly lower rates of contact with misuse
services and misuse related hospital admissions for people aged 15-24.
Equality considerations relating to public health data in this section:
• Child health: children and young people living in households experiencing
deprivation are more likely to have poor health outcomes
• Adverse child experiences that may relate to poorer health outcomes. A
child’s health can be impacted by environmental, social, economic and health-
related factors
• Health and wellbeing of women before and during pregnancy is associated
with health outcomes for infants e.g. substance abuse, smoking, and poor diet
before and during pregnancy are associated with adverse health outcomes for
infants
• Diabetes may be a ‘hidden disability’ that requires workplace consideration
e.g. reasonable adjustments such a flexibility of break times to eat, safe space
to inject insulin, and adjustments relating to diabetes-related health conditions
including modified equipment for visual impairment
• Sexual health inequalities such as variability to access can impact upon an
individual’s general health, wellbeing and upon their quality of life.
37Considerations in relation to culture, religion, sexual orientation and age
should be given.
• Smoking and tobacco: link between likelihood of smoking and level of
deprivation in area, impact of smoking and tobacco on health and availability
of health services, consideration of age, sex, ethnicity (men more likely to be
smokers than women)
• Obesity and prevalence of associated health conditions (e.g. hypertension,
cardiovascular disease, diabetes, mental health conditions etc.) are closely
linked to deprivation
• Alcohol and substance misuse: impact upon individual health and wellbeing –
health conditions related to alcohol/substance misuse may fall under definition
of disability, consideration of prevalence by age, sex, level of deprivation in
area and links to higher prevalence in certain protected groups e.g. younger
men, LGB
3818.0 Evaluation of data sets:
• Collation of the data has used both Public Health Profiles, JSNA and ONS
• The majority of data sets is not current however is the latest available
Data collated by Equality and Inclusion Project Team July 2020
19.0 List of data sources
Sexual orientation sources
Student Frequently Asked Questions https://www.stonewall.org.uk/help-
advice/student-frequently-asked-questions-faqs
Office for National Statistics Sexual Orientation, UK: 2018,
https://www.ons.gov.uk/peoplepopulationandcommunity/culturalidentity/sexuality/bull
etins/sexualidentityuk/2018
Office for National Statistics, adult smoking habits in the UK: 2018,
https://www.ons.gov.uk/peoplepopulationandcommunity/healthandsocialcare/healtha
ndlifeexpectancies/bulletins/adultsmokinghabitsingreatbritain/2018
Public Health England, Addressing inequalities in LGBT cancer screening coverage,
https://phescreening.blog.gov.uk/2019/03/15/addressing-inequalities-in-lgbt-cancer-
screening-coverage/
Government Equalities Office, National LGBT Survey Summary Report, 2018,
https://assets.publishing.service.gov.uk/government/uploads/system/uploads/attach
ment_data/file/722314/GEO-LGBT-Survey-Report.pdf
Pregnancy/Maternity sources
https://fingertips.phe.org.uk/profile/child-health-
profiles/data#page/1/gid/1938133222/pat/15/par/E92000001/ati/165/are/E38000078/i
id/92974/age/1/sex/2/cid/4/page-options/car-do-0_eng-vo-0_eng-do-
Asylum seekers sources
MLCSU Commissioning guidance for Asylum Seekers and Refugees,
https://www.midlandsandlancashirecsu.nhs.uk/download/publications/equality_and_i
nclusion/Asylum-Guidance.pdf
39Section 95 support by local authority, https://www.gov.uk/government/statistical-
data-sets/asylum-and-resettlement-datasets
Health needs assessment of asylum seekers and refugees in Lancashire,
https://www.lancashire.gov.uk/media/902306/hna_asylum-seekers-and-
refugees_lancashire.pdf
Migrant Health Guide, Public Health England, https://www.gov.uk/topic/health-
protection/migrant-health-guide
The Migration Observatory Local Data Guide,
https://dataguide.migrationobservatory.ox.ac.uk/
Rural Communities sources
https://www.ons.gov.uk/methodology/geography/geographicalproducts/ruralurbancla
ssifications/2011ruralurbanclassification
https://shapeatlas.net/place/
Source: Statistical Digest of Rural England, March 2020,
https://assets.publishing.service.gov.uk/government/uploads/system/uploads/attach
ment_data/file/875793/03_Statistical_Digest_of_Rural_England_2020_March_editio
n.pdf
Health and Wellbeing in Rural Areas, https://www.local.gov.uk/health-and-wellbeing-
rural-areas
Older People in Rural Areas: Vulnerability Due to Poor Health Paper,
https://ruralengland.org/wp-content/uploads/2015/12/Final-report-Poor-Health.pdf
Rural Ageing, https://www.ageuk.org.uk/globalassets/age-uk/documents/policy-
positions/housing-and-homes/ppp_rural_ageing_uk.pdf
An evidence summary of health inequalities in older populations in coastal and rural
areas, https://www.gov.uk/government/publications/health-inequalities-in-ageing-in-
rural-and-coastal-areas
Health inequality sources
Sources: https://www.gov.uk/government/publications/health-profile-for-
england/chapter-5-inequality-in-health
https://www.england.nhs.uk/wp-content/uploads/2016/02/national-maternity-review-
report.pdf
40Map data
https://shapeatlas.net/place/
Age data
https://fingertips.phe.org.uk/profile/child-health-
profiles/data#page/12/gid/1938133222/pat/15/par/E92000001/ati/165/are/E3800007
8/iid/92266/age/179/sex/2/cid/4/page-options/map-ao-4_tre-ao-0_tre-do-0_tre-so-
0_car-do-0_cin-ci-4_eng-vo-0_eng-do-0_ovw-tdo-0
Disability data
https://www.rnib.org.uk/professionals/knowledge-and-research-hub/key-information-
and-statistics/sight-loss-data-tool
https://www.england.nhs.uk/publication/joint-strategic-needs-assessment-toolkit/
https://fingertips.phe.org.uk/search/dementia#page/0/gid/1/pat/46/par/E39000033/ati/
165/are/E38000078/cid/4/page-options/ovw-tdo-0_ovw-do-0
https://www.rnib.org.uk/professionals/knowledge-and-research-hub/key-information-
and-statistics/sight-loss-data-tool
www.carersuk.org/stateofcaring
Gender Reassignment
Stonewall, LGBT Life in Britain – Trans Report, 2018,
https://www.stonewall.org.uk/system/files/lgbt_in_britain_-_trans_report_final.pdf
Government Equalities Office, Trans People in the UK, 2018:
https://assets.publishing.service.gov.uk/government/uploads/system/uploads/attach
ment_data/file/721642/GEO-LGBT-factsheet.pdf
Race
https://www.nomisweb.co.uk/query/construct/submit.asp?menuOpt=201&fmt=xls&lr=
geography&lc=Ethnic%20Group&fn=
Marriage and Civil Partnership:
https://www.nomisweb.co.uk/query/construct/submit.asp?forward=yes&menuopt=20
1&subcomp=
Religion and Belief
41Census 2011 data, NOMIS official labour market statistics,
https://www.nomisweb.co.uk/
Homelessness
https://www.gov.uk/government/statistical-data-sets/live-tables-on-
homelessness#statutory-homelessness-live-tables
Veterans
https://www.gov.uk/government/statistics/annual-population-survey-uk-armed-forces-
veterans-residing-in-great-britain-2017
https://www.local.gov.uk/sites/default/files/documents/1.17%20LAs%20Mythbuster%
20resource_v06.pdf
Other health related data
Alcohol and substance misuse - NHS Digital:
https://digital.nhs.uk/data-and-information/publications/statistical/statistics-on-drug-
misuse/2019/part-1-hospital-admissions-related-to-drug-misuse
Smoking - ONS:
https://www.ons.gov.uk/peoplepopulationandcommunity/healthandsocialcare/drugus
ealcoholandsmoking/articles/likelihoodofsmokingfourtimeshigherinenglandsmostdepr
ivedareasthanleastdeprived/2018-03-
14#:~:text=Smoking%20contributes%20to%20health%20inequality&text=In%2085%
25%20of%20cases%20where,in%20the%20least%20deprived%20areas.
NHS Digital (age/sex/ethnicity and other protected group info):
https://digital.nhs.uk/data-and-information/publications/statistical/statistics-on-
smoking/statistics-on-smoking-england-2019/part-3-smoking-patterns-in-adults-copy
42You can also read