Knowing our patch Equality related demographic profile for Cheshire CCG Collated by MLCSU Equality and Inclusion Team July 2020
←
→
Page content transcription
If your browser does not render page correctly, please read the page content below
Knowing our patch
Equality related demographic profile for
Cheshire CCG

Collated by MLCSU Equality and Inclusion Team
July 2020

                                                1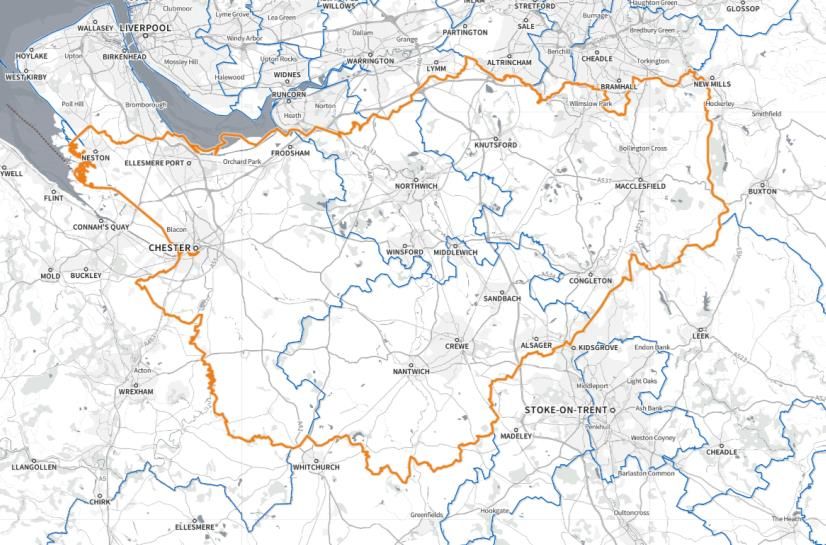
Version control

Date issued            July 2020
Date to be reviewed:   Periodically
Date to be reviewed:   July 2021
Document Summary       Provides information to help CCG
                       commissioners and CCG staff in
                       understanding the demographic picture
                       of their communities.
Version No:            1.0
Issued By:             MLCSU Equality and Inclusion team
Author(s)              Equality and Inclusion Team – Midlands
                       and Lancashire Commissioning Support
                       Unit
Review Date:

                                                                2
Contents
                                                                               Page

1.0 Introduction                                                                 4
2.0 Protected characteristic of Age                                              6
3.0 Protected characteristic of Disability and Carers                            8
4.0 Protected characteristic of Gender Reassignment                            12
5.0 Protected characteristic of Marriage and Civil Partnership                 13
6.0 Protected characteristic of Race                                           14
7.0 Protected characteristic of Religion and Belief                            16
8.0 Protected characteristic of Sex                                            17
9.0 Protected characteristic of Sexual Orientation                             18
10.0 Protected characteristic of Pregnancy and maternity                       19
11.0 Vulnerable groups: Deprivation                                            20
12.0 Vulnerable groups: Asylum and Refugees                                    21
13.0 Vulnerable groups: Homelessness                                           24
14.0 Vulnerable groups: Veterans and Military families                          20
15.0 Vulnerable groups: Rural Communities                                      25
16.0 Health Inequalities                                                       27
17.0 Other health related data – from Public Health England – fingertip data   30
18.0 Evaluation of data sets                                                   35
19.0 List of data sources                                                      35

                                                                                      3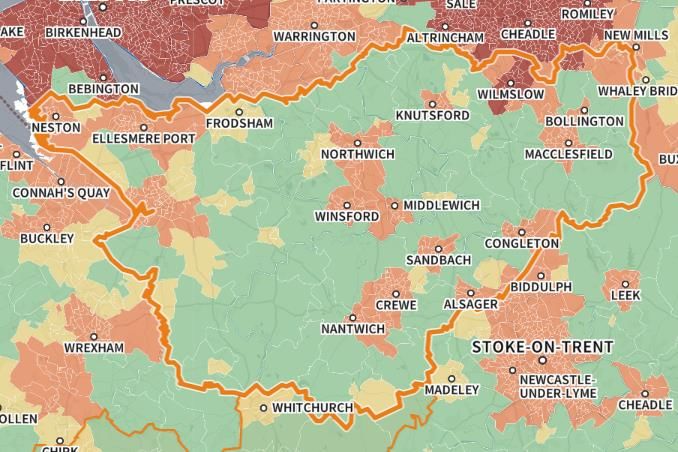
1.0 Introduction

When considering service design / policy changes, CCGs are required by legislation to
consider the needs and requirements of each protected characteristic group and ensure
that appropriate involvement / consultation takes place with these groups.

Consideration of requirements relating to protected characteristic groups at the beginning
of service redesign process will help to identify any potential negative impact that may
arise relating to protected characteristics and will help demonstrate ‘due regard’ to the
Public Sector Equality Duty.

CCGs are better equipped to understand the needs of their communities by being able to
understand the demographic profiling of their area. This helps understand the make-up of
different groups within the CCG area and identify the potential barriers for access /
particular needs of different groups.

This report provides data on the following:

•    Demographic profiles for the area
•    Health inequality information from public health and JSNA data

All data sources and references are contained in section 19.

NHS Cheshire CCG
Cheshire CCG formed formally in April 2020, with the merger of previous CCG
boundaries for:
     •   NHS East Cheshire CCG
     •   NHS Vale Royal CCG
     •   NHS South Cheshire CCG
     •   NHS West Cheshire CCG
Due to the following areas now falling into the new CCG boundary, data sets for this
report may still reflect the previous CCG boundaries.
NHS Cheshire CCG is located in the North West of England. The CCG is part of the
Cheshire and Merseyside Health and Care Partnership (NHS STP).
The CCG has a membership of 92 GP practices and serves a patient population of
approximately 779,195. Currently, there are 18 primary care networks established in the
NHS Cheshire CCG area.
The main NHS service providers based in the CCG area include:
•    Cheshire and Wirral Partnership NHS Foundation Trust
•    Countess of Chester Hospital NHS Foundation Trust
                                                                                          4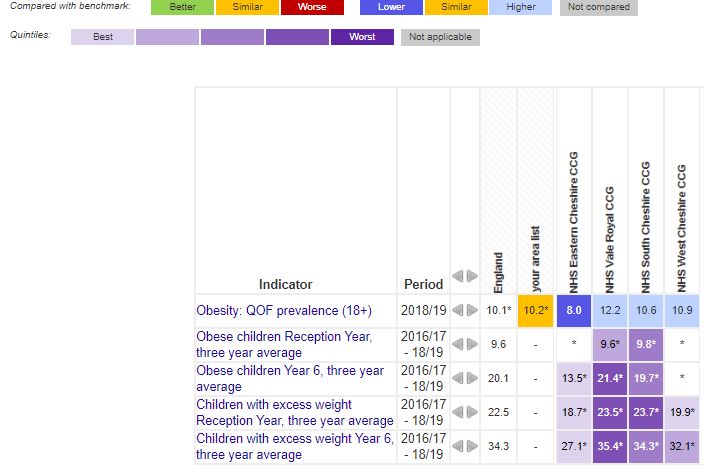
•   East Cheshire NHS Trust
•   Mid Cheshire Hospitals NHS Foundation Trust
•   North West Ambulance Service NHS Trust

Local authority areas that fall within the CCG area are:
•   Cheshire East Council
•   Cheshire West and Chester Council
Key transport links include the M6 and M56 motorways. Other key infrastructure in the
CCG area include 189 care homes, over 300 schools and three universities providing
education services based the area (the University of Chester, a Manchester Metropolitan
University campus based in Crewe, and a campus of The University of Law based in
Chester).
There is one prison located in the CCG area, HMP/YOI Styal in Wilmslow, which is
a prison and young offender institution for women aged 18 and over.

Map of the Cheshire CCG area (formally West Cheshire CCG, South
Cheshire CCG, Vale Royal CCG and Eastern Cheshire CCG):

Source: SHAPE © Crown copyright and database rights 2018 Ordnance Survey 100016969 accessed
28/5/2020

                                                                                              5
2.0 Protected characteristic of Age
 The following age profiles are shown for each CCG with male and female population:

Source: Public Health England. Public Health Profiles. [01/06/2020] https://fingertips.phe.org.uk © Crown
copyright 2020

Analysis:

    •   Across the area, there is some variation in age profile
    •   Across the area, the majority of people are between 50-54 years of age
    •   Across the CCGs, there is a generally older population in comparison with England.
        There are higher rates of people in the age range 45-49 and above across the area and
                                                                                                            6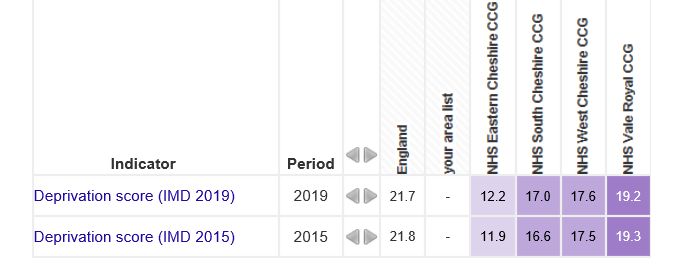
lower rates of people in the age groups 40-44 to 15-19 in comparison with the national
       rate
   •   There is a significantly lower number of younger people between the ages of 20 and 34
       living in the Eastern Cheshire area although all CCGs have lower rates of people in these
       age groups compared to the national rates

Equality considerations relating to age:
  • Aging population may add additional pressures on existing services
  • Certain health conditions are more prevalent in particular age groups e.g.
      dementia rates are higher in over 65s
  • There may be links with disability for older age groups due to issues such as long-
      term health conditions and frailty
  • Older people are more likely to develop hearing and sight impairments
  • Older people and younger people are less likely to have access to a car and
      therefore may rely on public transport to access services
  • Older people are more likely to be widowers and experience social isolation
  • Working age groups may experience barriers to accessing services during
      working hours
  • Cross referencing with disability, young men are more likely to commit suicide

                                                                                               7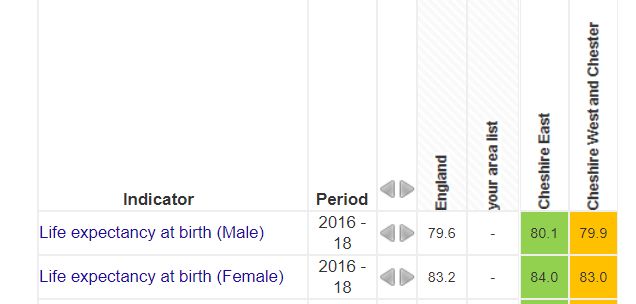
3.0 Protected characteristic of Disability

Learning disability / long term conditions / carers

Source: Public Health England. Public Health Profiles. [27/05/2020] https://fingertips.phe.org.uk © Crown
copyright 2020

 Disability prevalence by region/country
 2017/18, United Kingdom

                                             Millions of
                                                                                Percentage of people
 Region/Country                                  people

 United Kingdom                                        13.3                                      21
 Country
    England                                            10.9                                      20
 Region
    North West                                           1.6                                     23
    East Midlands                                        1.0                                     22
    West Midlands                                        1.2                                     21
 https://www.gov.uk/government/statistics/family-resources-survey-financial-year-201718

                                                                                                            8
Visual impairment:
2020 data set: RNIB England Cheshire Best fit
Number of people living with sight loss 182,000 3,750
Percentage of people from population 3.21% 3.67% (Cheshire West
with sight loss and Chester)
3.99% (Cheshire East)
Best fit data – Local Authority level.
Source: https://www.rnib.org.uk/professionals/knowledge-and-research-hub/key-information-and-
statistics/sight-loss-data-tool
Hearing impairment:
Estimated prevalence (%) of hearing loss of 25 dBHL or more in the adult
population (people aged 18 and over)
Previous CCG areas 2015 2020 2025 2030 2035
East Cheshire 25 27 29 31 33
Vale Royal 22 24 25 27 28
South Cheshire 23 25 27 28 29
West Cheshire 23 25 27 28 30
England 21 22 23 24 25
Dementia: period 2018/19
England Cheshire Eastern South West Vale
CCG (new Cheshire Cheshire Cheshire Royal
merged
areas)
Dementia 0.8% 1.0% 1.2% 0.8% 0.9% 0.8%
prevalence
all ages
Source: Public Health England. Public Health Profiles. [01/06/2020] https://fingertips.phe.org.uk © Crown
copyright 2020
9Mental health:
Source: Public Health England. Public Health Profiles. [01/06/2020] https://fingertips.phe.org.uk © Crown
copyright 2020
Analysis:
• Across the area there is some slight variations in learning disability prevalence,
but on the whole it is similar to the national rate
• Across the newly merged CCG there is some variation in rate of long-term
conditions with Vale Royal area having significantly higher rates compared to the
national rate. Disability rates across the NW region are slightly higher compared to
other East Midlands and West Midlands regions
• Dementia rates is variable across the area and slightly higher than England with
highest rates in Eastern Cheshire
• The rate of carers is similar to the national rate
• Physical impairment data for sight loss and hearing loss highlights that the area
has slightly higher rates of sight loss and hearing loss compared to England – with
highest rates in Eastern Cheshire
• Mental health disorder rates are similar to England rates for population over 16
years with slightly higher rates of mental health disorders in ages over 65 years
Equality considerations relating to disability:
• Access to services
• Language needs and information needs – accessible information e.g. large font,
Easy Read, BSL
• Reasonable adjustments
• Physical environment
10• Travel and parking
• Facilities
• Carers and support
Equality considerations for carers:
The health needs of this carers are highlighted in a report by Carers UK – State of Caring
2017. This report is important in highlighting significant disadvantages faced by carers
nationally. The report highlights:
• Caring can have a significant impact on health – both physically and mentally
• GP patient surveys found that 3 in 5 carers have a long term health condition
• Health conditions in 40% of young carers (aged 18-24 years) compared to 29% of
non-carers in the age group
• Back and mobility health problems are often acerbated by lack of access to proper
lifting equipment and aids
• Carers health often compromised by lack of time to attend medical check-up for
their own wellbeing
• 6 out of 10 carers (61%) reported that their physical health has worsened due to
caring
• 7 out of 10 carers (70%) reported that their mental health had worsened due to
caring
• Worsening health reporting was more prevalent in carers providing more than 50
hours per week
• Carers looking after a disabled child were most likely to suffer from depression –
54%
• Carers report that keeping healthy is more difficult due to difficulty in finding time
for exercise and maintaining a healthy diet
114.0 Protected characteristic of Gender Reassignment
Population data for this group is not collected within national census data, however,
estimate figures are thought to be in the region of 0.5%
The Cheshire CCGs’ serve a population of 767,484 people; therefore, the local trans
population is estimated at approximately 3837.
Estimated figures also suggest that around 1% of the population identify as non-binary.
Equality considerations relating to Gender Reassignment/Trans:
• LGBT rights charity Stonewall published a report on transgender experiences in
2018. The report highlights that a significant number of trans people face
inequalities and discrimination when accessing healthcare services, despite the
legal duty of all health and social care organisations to provide equal treatment
and tackle discrimination
• Poorer experiences of health care – staff attitudes and understanding
• More likely to experience poor mental health/more likely to attempt suicide
• Lower rates of health screening e.g. cervical
• More likely to be a victim of hate crime
• Fear of prejudice can create a barrier to access services
• More likely to be a victim of domestic abuse
125.0 Protected characteristic of Marriage and Civil
Partnership
In a registered same-
Area Married
sex civil partnership
England 46.6 0.2
NHS Eastern Cheshire 53.3 0.2
NHS South Cheshire 50.7 0.2
NHS Vale Royal 51.4 0.2
NHS West Cheshire 49.3 0.2
This protected characteristic relates only to employment and not service provision. Within
the context of this assessment the impact can relate to workforce issues.
Analysis:
• Married rates are higher than England rate across the area
• Civil partnership is in line with national rates
Equality considerations for marriage and civil partnership:
• Discrimination in the workplace/lack of promotion opportunities and unfavourable
treatment
• Flexible working arrangements
136.0 Protected characteristic of Race
NHS NHS NHS NHS
Cheshire
Ethnic Group Eastern South Vale West
CCG 2020
England Cheshire Cheshire Royal Cheshire
% % % % % %
All usual residents 100.0 100.0 100.0 100.0 100.0 100
White 85.4 96.3 97.1 97.9 97.2 97.0%
White:
English/Welsh/Scottish/Northern 79.8 93.7 93.4 95.9 94.1 94.1%
Irish/British
White: Irish 1.0 0.7 0.5 0.5 0.8 0.7%
White: Gypsy or Irish Traveller 0.1 0.0 0.1 0.1 0.1 0.1%
White: Other White 4.6 1.9 3.1 1.5 2.2 2.2%
Mixed/multiple ethnic groups 2.3 1.0 1.1 0.8 1.0 1.0%
Mixed/multiple ethnic groups:
0.8 0.3 0.5 0.2 0.3 0.3%
White and Black Caribbean
Mixed/multiple ethnic groups:
0.3 0.1 0.1 0.1 0.1 0.1%
White and Black African
Mixed/multiple ethnic groups:
0.6 0.4 0.3 0.3 0.3 0.3%
White and Asian
Mixed/multiple ethnic groups:
0.5 0.2 0.2 0.2 0.2 0.2%
Other Mixed
Asian/Asian British 7.8 2.0 1.2 1.0 1.4 1.5%
Asian/Asian British: Indian 2.6 0.8 0.3 0.3 0.4 0.5%
Asian/Asian British: Pakistani 2.1 0.3 0.1 0.1 0.1 0.2%
Asian/Asian British:
0.8 0.1 0.2 0.1 0.2 0.2%
Bangladeshi
Asian/Asian British: Chinese 0.7 0.3 0.3 0.3 0.3 0.3%
Asian/Asian British: Other Asian 1.5 0.5 0.3 0.3 0.3 0.3%
Black/African/Caribbean/Black
3.5 0.3 0.4 0.2 0.3 0.3%
British
Black/African/Caribbean/Black
1.8 0.2 0.2 0.1 0.2 0.2%
British: African
Black/African/Caribbean/Black
1.1 0.1 0.2 0.0 0.1 0.1%
British: Caribbean
Black/African/Caribbean/Black
0.5 0.1 0.1 0.0 0.0 0.1%
British: Other Black
Other ethnic group 1.0 0.3 0.2 0.1 0.2 0.2%
Other ethnic group: Arab 0.4 0.1 0.1 0.0 0.1 0.1%
Other ethnic group: Any other
0.6 0.2 0.1 0.1 0.1 0.1%
ethnic group
Analysis:
• The population for Cheshire CCG is mainly white British (94.1%) which is
significantly higher than the England percentage
• There is some variation across the area – with slightly higher % of people with
Asian ethnicity in East Cheshire
• BME representation across the area is significantly lower than the England rate for
all BME groups
14Equality considerations for race:
• Access to language support
• Cultural considerations
• Certain health conditions affect different ethnic groups e.g. diabetes prevalence in
South East Asian men
• Health inequalities in relation to BAME groups – cross reference with deprivation
• Poorer experiences of healthcare for BAME groups
• Poorer experiences of BAME groups in the workplace
• Health needs of BAME groups often not well understood
• BAME groups more likely to be a victim of hate crime
157.0 Protected characteristic of Religion and Belief
NHS NHS
NHS Vale NHS West Combined
Eastern South
Religion Royal Cheshire Cheshire England
Cheshire Cheshire
CCG CCG CCG area*
CCG CCG
Christian 68.2% 69.7% 71.3% 69.6% 69.5% 59.4%
Buddhist 0.3% 0.2% 0.2% 0.3% 0.2% 0.5%
Hindu 0.5% 0.2% 0.1% 0.2% 0.3% 1.5%
Jewish 0.2% 0.1% 0.1% 0.1% 0.1% 0.5%
Muslim (Islam) 0.7% 0.6% 0.3% 0.6% 0.6% 5.0%
Sikh 0.1% 0.1% 0.1% 0.1% 0.1% 0.8%
Other religion 0.3% 0.3% 0.3% 0.3% 0.3% 0.4%
No religion 22.9% 22.4% 21.4% 22.3% 22.4% 24.7%
Religion not stated 6.7% 6.6% 6.3% 6.6% 7% 7.2%
*NHS Eastern Cheshire CCG, NHS South Cheshire CCG, NHS Vale Royal CCG, and NHS West Cheshire
CCG data combined.
Please note the data in the table above relates to the 2011 Census, and therefore may
not reflect current populations in CCG areas.
Analysis
• The most common religious affiliation in the CCG area is Christianity, with the
proportion of people identifying as Christian is higher than the England comparator
• The data highlights that populations of the other main religions is lower compared to
England in general – in particular, the proportion of people identifying as Muslim is
significantly lower in the NHS Cheshire CCG area compared the rest of England
• The data highlights that there are more people in the CCG area that identify as having
religion or belief compared to England generally; the proportion of people who
identified as having no religion is slightly lower across the CCG area than the national
figure
Equality considerations relating to religion and belief:
• Facilities e.g. prayer rooms / changing rooms
• End of life plans – spiritual needs of patients considered
• Chaplaincy service
• Human resource policies relating to religious festivals/needs e.g. Ramadan
• Workforce considerations - dress
• Belief impacting on how patients view their care
• Ingredients of medication/compatibility of religious belief
• Cultural considerations for care – chaperone
• Dietary requirements
168.0 Protected characteristic of Sex
Cross reference with Age section which contains population profiles for male and
females cross referenced with age.
Chart showing males and females with comparison of national population.
Population sex profile (GP registered population)
NHS
NHS West NHS South Cheshire
Eastern NHS Vale
Cheshire Cheshire CCGs England
Cheshire Royal CCG
CCG CCG merged
CCG
Male 103,933 131,724 54,149 94,408 384,214 29,849,678
Female 105,852 134,567 54,275 94,413 389,107 29,909,960
Total 209,785 266,291 108,424 188,821 773,321 59,759,638
Source: Source: Public Health England. Public Health Profiles. [08/06/2020] https://fingertips.phe.org.uk ©
Crown copyright 2020
Analysis:
• Across the area, there are more females than males
• The rates of females to males across the area is slightly higher than that of the
national rate
• There difference in the rate of females to males is more prominent in Eastern
Cheshire and West Cheshire
Equality considerations relating to Sex:
• Certain conditions affect males/females
• Females have longer life expectancy compared to males
• Workforce considerations:
o Human resource policies – menopause, caring responsibilities
o Gender pay gap
o Flexible working arrangements
• Personal safety
• Facilities – single sex changing rooms etc.
• Chaperone services
• Young men are more likely to experince mental health issues/commit suicide
• Health promotion and screening
179.0 Protected Characteristic of Sexual Orientation
Estimated population – sexual orientation
Estimate % LGB Estimate %
source population who are heterosexual
Lesbian, gay, and
bisexual
England – 5-7% 93-95%
Stonewall
England - ONS 2.2% 94.6%
Cheshire CCG 2.2 to 7% 17,000 to 54,100 -
In terms of age and sexual orientation, ONS data shows that people aged 16-24 were
more likely to identify as LGB compared to other age groups. The proportion of people
identifying as LGB decreases in each successive age group.
Equality considerations relating to sexual orientation:
• National research notes that the LGB community face barriers and disadvantage
when accessing health and social care
• Stonewall found that 52% of people surveyed in 2018 had experienced depression
in the previous year, and 31% of LGB people had thought about taking their own
life
• 15% of people surveyed by Stonewall in 2018 smoked almost every day, which is
slightly higher compared to ONS data regarding the proportion of the general
population (14.7%)
• Stonewall’s 2018 report found that one in six LGBT (16%) people surveyed drank
alcohol every day, compared with one in ten people in the general population.
13% of LGBT people surveyed took drugs at least once a month
• Information from Public Health England suggests that cancer screening coverage
is lower in LGB and T communities. In particular, lesbian, and bisexual women are
less likely to attend cervical screening: 15% of lesbian and bisexual women over
25 have never had a test, compared to 7% of the general population
• Barriers to accessing healthcare include;
o Fear, or experience, of discrimination when accessing services
o Assumptions of sexuality
o Inappropriate curiosity and insensitive questions
o Lack of understanding from healthcare staff regarding LGB health needs
1810.0 Protected characteristic of Pregnancy and
maternity
The table below shows pregnancy and birth data captured from the PHE Fingertips
website:
NHS Eastern NHS South NHS Vale NHS West
Indicator Year Cheshire Cheshire Royal CCG Cheshire England
CCG CCG CCG
Percentage of
deliveries to
2018/19 7.5% 5.6% 3.2% 6.3% 20.6%
mothers from
BME groups
General fertility 61.7 per 58.6 per 61.2 per
2017 63.9 per 1000 65.6 per 1000
rate 1000 1000 1000
Caesarean
2018/19 32.6% 27.2% 23.9% 35.8% 29.7%
section
15.9 per
Multiple births 2017 16.3 per 1000 13.9 per 1000 12.1 per 1000 13.9 per 1000
1000
Low birth weight
2017 6.5% 7.0% 8.0% 6.5% 7.4%
of all babies
Very low weight
2017 0.81% 1.07% 0.94% 1.54% 1.14%
of all babies
Stillbirth rate 2016-18 4.1 per 1000 4.2 per 1000 4.6 per 1000 2.3 per 1000 4.2 per 1000
Admissions of
134.5 per 119.3 per 113.1 per 75.0 per
babies under 14 2018/19 98.8 per 1000
1000 1000 1000 1000
days
Teenage Data not Data not
2018/19 0.8% 0.5% 0.6%
mothers available available
Baby’s first feed
2018/19 64.8% 65.6% 60.2% 63.9% 67.4%
breastmilk
Source: Public Health England. Public Health Profiles. [01/06/2020] https://fingertips.phe.org.uk © Crown
copyright 2020
Analysis
• NHS Cheshire CCG’s pregnancy and maternity data is largely consistent with the national
comparator
• However, the percentage of births to mothers from BME groups is significantly lower
across the CCG area compared to England in general
• There is variance in the incidence of hospital admissions for babies under 14 days old –
across the CCG area, the rate of admission is higher than the national rate, particularly in
the South Cheshire area of the CCG
Equality considerations for pregnancy and maternity:
• Workforce issues: Human resource policies – pregnancy, maternity, and paternity
• Facilities such as baby changing, parent and child parking, breast feeding rooms,
pram space/parking
• Better Births Report – disproportionate experiences for BAME mothers and
mothers from lower income backgrounds
• Cultural considerations – link with care plans
• Link to certain conditions during perinatal period e.g. post-natal depression
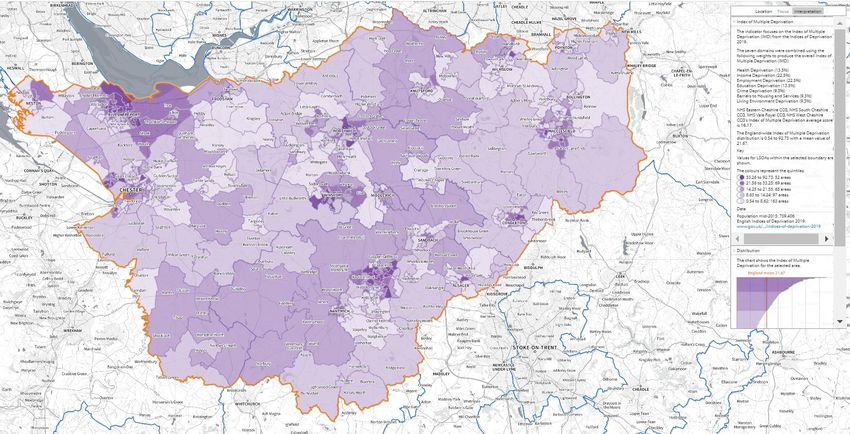
1911.0 Vulnerable Groups: Deprivation
Deprivation data for the area:
Source: Public Health England. Public Health Profiles. [06/07/2020] https://fingertips.phe.org.uk © Crown
copyright 2020
Higher deprivation areas are denoted by darker shades of purple:
Source: SHAPE © Crown copyright and database rights 2018 Ordnance Survey 100016969 accessed
06/7/2020
Cross reference this section with Health Inequalities section below.
Analysis:
• Overall, Cheshire CCG is more affluent compared to the England deprivation level
• Areas of high deprivation are located in Ellesmere Port, Neston, Chester, Crewe,
Winsford and Northwich – of which may represent relatively small areas but have
significantly high deprivation levels
See section on health inequalities for details on link between health outcomes and
deprivation.
2012.0 Vulnerable groups: Asylum and Refugees
Asylum and Refugee (ASR) population information
As at 31 December 2019, there were 43,549 asylum seekers in receipt of Section 95
support in the UK. Best fit local authority level data for the CCG area shows that there
were approximately 137 asylum seekers in receipt of Section 95 support:
Number of ASR in receipt of Section 95 support in NHS Cheshire CCG
area as at 31 December 2019
England 35,997
North West region 9,665
Cheshire West and Chester 99
Cheshire East 38
Further information regarding local ASR programmes is available on local authority
websites. Information regarding the ASR local area e.g. population trends is available via
The Migrant Observatory Local Data Guide (links below).
Asylum and Refugee health related information
People claiming asylum or holding refugee status are recognised as being at risk of
experiencing complex health problems. The most common health problems are:
• Communicable diseases (e.g. hepatitis, TB, HIV / AIDS, malaria)
• Chronic diseases (e.g. COPD, cardiovascular disease, diabetes)
• Sexual health related needs
• Dental conditions
• Injury due to torture
• Poor mental health / psychosomatic disorders. Compared to the general population,
the incidence of mental illness is higher in this group
• Women’s health issues and disability issues
2113.0 Vulnerable groups: Homelessness
Owed a
prevention /
Total Assessment relief of duty Rough sleepers
ENGLAND 75,520 71,570 2466
North West 10,570 10,200 349
Cheshire East 404 401 8
Cheshire West and
451 441
Chester 14
Best data set data used where available.
People who don’t have a home are described as homeless; this is not just people living
on the streets. Homelessness can include people:
• Staying with friends or family
• Staying in a hostel or bed and breakfast accommodation
• Squatting
• At risk of violence or abuse in their home
• People living in poor conditions that affects their health
• Living apart from their family because they don’t have a place to live together
There is no single reason why someone can end up without a home. Personal
circumstances and wider factors both play their part. Homelessness can be devastating,
dangerous and isolating for those who experience it.
2214.0 Vulnerable groups: Veterans and Military families
Military Veterans data set:
A veteran is someone who has served in the armed forces for at least one day.
2017
% Veterans % Non-veterans
2,401,000 48,903,000
UK
5% 95%
Cheshire 5% 95%
Data is best fit.
Royal British Legion produce the national household survey which summarises data and
needs of military veterans. Summary data includes:
• 90% of veterans are male.
• Veterans are less likely to be single (10%) and more likely to be widowed (16%)
compared to non-veterans (10%).
• Veterans are predominantly white (98%). Although 2% of veterans are from Black and
Minority Ethnic groups (BAME) this may include Gurkhas – from Nepal served in the
British Army
Age profile percentage - veterans compared to non veterans
20.0%
18.0%
16.0%
14.0%
12.0%
10.0%
8.0%
6.0%
4.0%
2.0%
0.0%
16-19 20-24 25-29 30-34 35-39 40-44 45-49 50-54 55-59 60-64 65-69 70-74 75-79 80-84 85-89 90+
Key: Purple: veterans. Green: Non veterans
General health of veterans:
23General health of veterans
compared to non veterans aged
16-64
60%
40%
20%
0%
Very Good Good Fair Bad Very Bad
Veterans % Non veterans %
General health for veterans and
non veterans aged over 65
50%
40%
30%
20%
10%
0%
Very Good Good Fair Bad Very Bad
Veterans >65 % Non veterans >65 %
Analysis:
• 2016: there were estimated 2.5 million UK Armed Forces veterans.
• UK Veteran population is elderly and declining in size. 49% of veterans are aged
over 75 compared to non-veterans 8%
• The high rate of older veterans can be related to those who undertook National
Service which officially ended at the end of 1960
2415.0 Vulnerable Groups: Rural Communities
The Office for National Statistics rural-urban classification (RUC2011) allows for a
consistent approach when viewing rural/urban datasets.
Output areas are defined as rural if there is a population size of 10,000 or less. Output
areas with a population size of over 10,000 are classed as urban. Further information
regarding the rural-urban classification is available on the ONS website.
NHS Cheshire CCG’s area rural-urban population
Source: SHAPE © Crown copyright and database rights 2018 Ordnance Survey 100016969 accessed
28/5/2020
9.5 million (17% of population) people live in areas defined as rural in England. It is
challenging to fully understand rural areas as available data is limited and less specific in
focus compared to urban data.
Percentage of population within age bands by rural-urban classification (LSOA) in
England, 2018:
25Analysis:
• In terms of ethnicity, the proportion of BME groups has risen slightly over the last
five years in rural areas, however 97.6% of the rural population in England falls
into White ethnic groups
• In the NHS Cheshire CCG area, there are a number of urban centres (for
example, Wilmslow, Chester, and Crewe). Surrounding these urban areas are
market towns and smaller rural villages, some of which are in fringe and sparse
settings.
Rural communities health related information
As there is complexity and diversity in rural areas that make it difficult to understand
rural areas as a whole, caution must be taken when considering rural communities.
However, available data highlights that there are general demographic and health-related
considerations for this vulnerable group:
• Population pattern – outward migration of young people and inward migration of
older people, are leading to a rural population that is increasingly older than the
urban population, with accompanying health and social care needs
• Access to health and social care services e.g. longer travel distances, increased
travel costs and scarcity of public transport links to access services
• Digital exclusion resulting from a combination of older population and the
unavailability of high-speed broadband / mobile phone networks are leading to an
increasing digital gap
• Social isolation / exclusion. This may also include marginalisation and lack of
social connections felt by protected groups such as LGBT and/or people living
with a disability, as well as those who are divorced or living alone
• Health impacts of rural housing and/or fuel poverty
Equality considerations relating to vulnerable groups listed above:
• People living in deprived areas are more likely to have poorer health outcomes
• Veterans – mental illness, MSK, hearing loss
• Asylum and Refugees – social invisibility, stereotyping, social stigma, cultural
considerations, language/communication needs, barriers to accessing services,
healthcare needs related to ASR status (as detailed in section 12.0)
• People experiencing homelessness – complex and multiple health needs, poorer
health outcomes, lower life expectancy, barriers to accessing primary care
services, lack of understanding of health and social care entitlements, stigma, and
stereotyping
• Rural communities – social isolation, barriers to accessing health and social care
due to longer travel distances, poor public transport links and/or digital exclusion
2616.0 Health Inequalities
Health is determined by a complex mix of factors including income, housing and
employment, lifestyles and access to health care and other services. Significant
inequalities in health exist between individuals and different groups in society. In
particular, there is a ‘social gradient’ in health; neighbourhood areas with higher levels of
income deprivation typically have lower life expectancy and disability-free life
expectancy.
Key themes relating to health inequalities include:
Life expectancy Best fit data used for Local Authority areas– Mortality profiles
Table showing Under 75 mortality rate from all causes
Compared to
England
value or
Area Sex Value Count percentiles
England Persons 330.4850407 475130
Cheshire East Persons 294.3485 3343 Better
Cheshire West
and Chester Persons 326.2569 3194 Similar
England Male 401.6007414 281571
Cheshire East Male 368.1593 2037 Better
Cheshire West
and Chester Male 396.4173 1892 Similar
England Female 262.762801 193559
Cheshire East Female 223.5611 1306 Better
27Cheshire West
and Chester Female 259.5864 1302 Similar
Causes of death:
Compared to
England value or
Area Value Count percentiles
Under 75 mortality rate from all cardiovascular diseases
England 71.7 102334
Cheshire East 64.7 747 Better
Cheshire West and
Chester 71.3 703 Similar
Under 75 mortality rate from heart disease
England 38.17748623 54406
Cheshire East 36.0212 417 Similar
Cheshire West and
Chester 34.8281 346 Similar
Under 75 mortality rate from stroke
England 12.82882045 18309
Cheshire East 10.1556 118 Better
Cheshire West and
Chester 12.742 125 Similar
Under 75 mortality rate from cancer
England 132.3 188722
Cheshire East 117.4 1344 Better
Cheshire West and
Chester 133.1 1313 Similar
Under 75 mortality from colorectal cancer
England 11.88112046 16946
Cheshire East 11.3322 130 Similar
Cheshire West and
Chester 11.6325 112 Similar
Under 75 mortality rate from liver disease
England 18.5 26558
Cheshire East 18.2 205 Similar
28Cheshire West and
Chester 19.1 185 Similar
Under 75 mortality rate from respiratory disease
England 34.7 49351
Cheshire East 28.1 328 Better
Cheshire West and
Chester 36.6 362 Similar
Under 75 mortality rate from injuries
England 13.21018054 19490
Cheshire East 15.0054 152 Similar
Cheshire West and
Chester 12.1748 110 Similar
Source: Public Health England. Public Health Profiles. [30/06/2020] https://fingertips.phe.org.uk © Crown
copyright 2020
Analysis:
• Nationally and locally, there is variation across life expectancy for males and female.
Males have higher mortality rates across all causes compared to females
• There are variations for life expectancy across the local authority areas for Cheshire
area with Cheshire East having better mortality rates compared to Cheshire West and
Chester
• Mortality rates for people under that age of 75 for different causes was significantly
worse when compared to England rates for:
o Death from injuries rate slightly higher for all people but significantly higher
for men within Cheshire East
• Mortality rates for people under that age of 75 for different causes is better compared
to the England rates for:
o Heart disease
o Stroke
• Mortality rates for people under the age of 75 for different causes mirror national rates
for:
o Cardiovascular diseases of which Cheshire East is better than national
rates
o Cancer of which Cheshire East is better than the national rate
o Breast cancer
o Colorectal cancer
o Liver disease
o Respiratory disease of which Cheshire East is better than national rates
Further information can be found within the Rightcare Health Equality and Inequality
report: https://www.england.nhs.uk/publication/equality-and-health-inequalities-packs-
2018-north/
2917.0 Other health related data – from Public Health
England – fingertips data
Child health data set:
Source: Public Health England. Public Health Profiles. [06/07/2020] https://fingertips.phe.org.uk © Crown
copyright 2020
Analysis:
• Infant mortality is similar or lower to the England rate
• Immunisation data (MMR) rates are more positively higher compared to the England
rate
• Obesity rates in children (year 6) is generally lower than England rates except for
Vale Royal area – which is higher
30Diabetes data set:
Source: Public Health England. Public Health Profiles. 03/07/2020] https://fingertips.phe.org.uk © Crown
copyright 2020
Analysis:
• Across the area, there are lower rates of diabetes prevalence compared with the
England rate
• NHS Vale Royal has higher (worse) rates of diabetes prevalence when compared
with the Cheshire area and England
• NHS South Cheshire has similar rates of diabetes prevalence to England
• NHS West Cheshire and NHS Eastern Cheshire have the lowest rates across the
area, and both have lower rates of diabetes prevalence when compared to
England
Sexual Health data sets:
Source: Public Health England. Public Health Profiles. [17/06/2020] https://fingertips.phe.org.uk © Crown
copyright 2020
31Analysis:
• Across the area, there are higher rates of Chlamydia diagnosis compared with
England
• The diagnostic rate of Chlamydia is higher and rising in Cheshire West and Cheshire
• Cheshire East has lower and decreasing rates of Chlamydia diagnosis
• Across the area, there are higher rates of people testing positive for STIs when
compared to England
• Cheshire West and Chester have higher rates of positive STI testing when compared
with the national rate and Cheshire East have similar rates
• The rates of people testing positive for STIs is increasing across Cheshire and in
England
Smoking and Tobacco data set:
[11/06/2020] https://fingertips.phe.org.uk © Crown copyright 2020
Analysis:
• Across the area, there is variation in smoking prevalence
• There are generally lower rates of smoking prevalence in adults across the area with
significantly lower rates in the NHS Eastern Cheshire and NHS South Cheshire areas
compared to the national rate
• There are overall higher rates of socio-economic gaps and smoking prevalence across
the area with significantly high rates in the NHS West Cheshire compared to the national
rate
32Obesity data set:
Source: Public Health England. Public Health Profiles. [11/06/2020] https://fingertips.phe.org.uk © Crown
copyright 2020
Analysis:
• Across the area, there are similar rates of obesity prevalence
• NHS Vale Royal has the highest (worst) rate of obesity prevalence in comparison to the
area and the national rate
• There are similar rates of obese children in Reception when compared to the national rate
• NHS Eastern Cheshire has particularly low (better) rates of child obesity compared with
the area
• NHS Vale Royal has the highest (worst) rates of child obesity across the area
Alcohol and substance misuse data set:
Source: Public Health England. Public Health Profiles. [06/07/2020] https://fingertips.phe.org.uk © Crown
copyright 2020
33Substance misuse data is across the area is similar to the England rate with the
exception to higher rates of hospital admission for young people age 15-24 – in relation
to people living within Cheshire East.
Equality considerations relating to public health data in this section:
• Child health: children and young people living in households experiencing
deprivation are more likely to have poor health outcomes
• Adverse child experiences that may relate to poorer health outcomes. A child’s
health can be impacted by environmental, social, economic, and health-related
factors
• Health and wellbeing of women before and during pregnancy is associated with
health outcomes for infants e.g. substance abuse, smoking, and poor diet before
and during pregnancy are associated with adverse health outcomes for infants
• Diabetes may be a ‘hidden disability’ that requires workplace consideration e.g.
reasonable adjustments such a flexibility of break times to eat, safe space to inject
insulin, and adjustments relating to diabetes-related health conditions including
modified equipment for visual impairment
• Sexual health inequalities such as variability to access can impact upon an
individual’s general health, wellbeing and upon their quality of life. Considerations
in relation to culture, religion, sexual orientation, and age should be given.
• Smoking and tobacco: link between likelihood of smoking and level of deprivation
in area, impact of smoking and tobacco on health and availability of health
services, consideration of age, sex, ethnicity (men more likely to be smokers than
women)
• Obesity and prevalence of associated health conditions (e.g. hypertension,
cardiovascular disease, diabetes, mental health conditions etc.) are closely linked
to deprivation
• Alcohol and substance misuse: impact upon individual health and wellbeing –
health conditions related to alcohol/substance misuse may fall under definition of
disability, consideration of prevalence by age, sex, level of deprivation in area and
links to higher prevalence in certain protected groups e.g. younger men, LGB
3418.0 Evaluation of data sets
• Collation of the data has used both Public Health Profiles, JSNA and ONS
• The majority of data sets is not current however is the latest available
Data collated by Equality and Inclusion Project Team July 2020
19.0 List of data sources
Sexual orientation sources
Student Frequently Asked Questions https://www.stonewall.org.uk/help-advice/student-
frequently-asked-questions-faqs
Office for National Statistics Sexual Orientation, UK: 2018,
https://www.ons.gov.uk/peoplepopulationandcommunity/culturalidentity/sexuality/bulletins
/sexualidentityuk/2018
Office for National Statistics, adult smoking habits in the UK: 2018,
https://www.ons.gov.uk/peoplepopulationandcommunity/healthandsocialcare/healthandlif
eexpectancies/bulletins/adultsmokinghabitsingreatbritain/2018
Public Health England, Addressing inequalities in LGBT cancer screening coverage,
https://phescreening.blog.gov.uk/2019/03/15/addressing-inequalities-in-lgbt-cancer-
screening-coverage/
Government Equalities Office, National LGBT Survey Summary Report, 2018,
https://assets.publishing.service.gov.uk/government/uploads/system/uploads/attachment
_data/file/722314/GEO-LGBT-Survey-Report.pdf
Pregnancy/Maternity sources
https://fingertips.phe.org.uk/profile/child-health-
profiles/data#page/1/gid/1938133222/pat/15/par/E92000001/ati/165/are/E38000151/iid/9
2974/age/1/sex/2/cid/4/page-options/car-do-0_eng-vo-0_eng-do-0
Asylum seekers sources
MLCSU Commissioning guidance for Asylum Seekers and Refugees,
https://www.midlandsandlancashirecsu.nhs.uk/download/publications/equality_and_inclu
sion/Asylum-Guidance.pdf
Section 95 support by local authority, https://www.gov.uk/government/statistical-data-
sets/asylum-and-resettlement-datasets
35Health needs assessment of asylum seekers and refugees in Lancashire,
https://www.lancashire.gov.uk/media/902306/hna_asylum-seekers-and-
refugees_lancashire.pdf
Migrant Health Guide, Public Health England, https://www.gov.uk/topic/health-
protection/migrant-health-guide
The Migration Observatory Local Data Guide,
https://dataguide.migrationobservatory.ox.ac.uk/
Rural Communities sources
https://www.ons.gov.uk/methodology/geography/geographicalproducts/ruralurbanclassific
ations/2011ruralurbanclassification
https://shapeatlas.net/place/E54000008#9/53.2274/-2.4545/l-ruc/b-01C,b-01R,b-02F,b-
02D/sc-pc/m-CCG,ml-CCG/u-
Statistical Digest of Rural England, March 2020,
https://assets.publishing.service.gov.uk/government/uploads/system/uploads/attachment
_data/file/875793/03_Statistical_Digest_of_Rural_England_2020_March_edition.pdf
Health and Wellbeing in Rural Areas, https://www.local.gov.uk/health-and-wellbeing-
rural-areas
Older People in Rural Areas: Vulnerability Due to Poor Health Paper,
https://ruralengland.org/wp-content/uploads/2015/12/Final-report-Poor-Health.pdf
Rural Ageing, https://www.ageuk.org.uk/globalassets/age-uk/documents/policy-
positions/housing-and-homes/ppp_rural_ageing_uk.pdf
An evidence summary of health inequalities in older populations in coastal and rural
areas, https://www.gov.uk/government/publications/health-inequalities-in-ageing-in-rural-
and-coastal-areas
Health inequality sources
https://www.gov.uk/government/publications/health-profile-for-england/chapter-5-
inequality-in-health
https://www.england.nhs.uk/wp-content/uploads/2016/02/national-maternity-review-
report.pdf
Map data
https://shapeatlas.net
36Age data
https://fingertips.phe.org.uk/profile/child-health-
profiles/data#page/12/gid/1938133222/pat/15/par/E92000001/ati/165/are/E38000189/iid/
92266/age/179/sex/2/cid/4/page-options/map-ao-4_tre-ao-0_tre-do-0_tre-so-0_car-do-
0_cin-ci-4_eng-vo-0_eng-do-0_ovw-tdo-0
Disability data
https://www.rnib.org.uk/professionals/knowledge-and-research-hub/key-information-and-
statistics/sight-loss-data-tool
https://www.england.nhs.uk/publication/joint-strategic-needs-assessment-toolkit/
https://fingertips.phe.org.uk/search/dementia#page/0/gid/1/pat/30000/par/al-
Bd9spmuKXU/ati/165/are/E38000056/cid/4/page-options/ovw-tdo-0
www.carersuk.org/stateofcaring
Gender Reassignment
Stonewall, LGBT Life in Britain – Trans Report, 2018,
https://www.stonewall.org.uk/system/files/lgbt_in_britain_-_trans_report_final.pdf
Government Equalities Office, Trans People in the UK, 2018:
https://assets.publishing.service.gov.uk/government/uploads/system/uploads/attachment
_data/file/721642/GEO-LGBT-factsheet.pdf
Cheshire CCG website, April 2020: https://www.cheshireccg.nhs.uk/about/our-
population/
Race
https://www.nomisweb.co.uk/query/construct/submit.asp?menuOpt=201&fmt=xls&lr=geo
graphy&lc=Ethnic%20Group&fn=
Religion and Belief
Source: Census 2011 data, NOMIS official labour market statistics,
https://www.nomisweb.co.uk/
Homelessness
https://www.gov.uk/government/statistical-data-sets/live-tables-on-
homelessness#statutory-homelessness-live-tables
Veterans
37https://www.gov.uk/government/statistics/annual-population-survey-uk-armed-forces-
veterans-residing-in-great-britain-2017
https://www.local.gov.uk/sites/default/files/documents/1.17%20LAs%20Mythbuster%20re
source_v06.pdf
Other health related data
Alcohol and substance misuse - NHS Digital: https://digital.nhs.uk/data-and-
information/publications/statistical/statistics-on-drug-misuse/2019/part-1-hospital-
admissions-related-to-drug-misuse
Smoking - ONS:
https://www.ons.gov.uk/peoplepopulationandcommunity/healthandsocialcare/drugusealc
oholandsmoking/articles/likelihoodofsmokingfourtimeshigherinenglandsmostdeprivedarea
sthanleastdeprived/2018-03-
14#:~:text=Smoking%20contributes%20to%20health%20inequality&text=In%2085%25%
20of%20cases%20where,in%20the%20least%20deprived%20areas.
NHS Digital (age/sex/ethnicity and other protected group info): https://digital.nhs.uk/data-
and-information/publications/statistical/statistics-on-smoking/statistics-on-smoking-
england-2019/part-3-smoking-patterns-in-adults-copy
38You can also read


