A method for estimating flight paths missing data - PUC Minas
←
→
Page content transcription
If your browser does not render page correctly, please read the page content below
A method for estimating flight paths missing data⇤
    Um método para estimativas de trajetórias incompletas de voos

                                                                          Sandro Jerônimo de Almeida1
                                                                               Caio Augusto D. Franco2
                                                                         Ricardo Poley Martins Ferreira3
                                                                                    Morton E. O’Kelly4

                                                  Resumo

         A otimização do tráfego aéreo é essencial na reengenharia de operações aeroespaciais à
         medida que o número de voos e o uso de rotas aéreas crescem no mundo. Os projetos
         NextGen e SESAR são importantes iniciativas que permitem uma maior escalabilidade e
         segurança no tráfego aéreo. Um elemento desses projetos é o sistema ADS-B (Automa-
         tic Dependent Surveillance-Broadcast), que permite que as aeronaves compartilhem suas
         posições e velocidade. A cobertura das antenas do sistema ADS-B é limitada em regiões
         oceânicas e menos economicamente desenvolvidas, resultando na falta de dados das traje-
         tórias realizadas por aeronaves. Este artigo propõe um método baseado em Redes Neurais
         Artificiais (RNA) interpolação e computação de médias para completar trajetórias de aero-
         naves parcialmente capturadas pelas antenas do sistema ADS-B. Enquanto outros métodos
         são focados em uma ou duas dimensões das trajetórias dos voos, este trabalho é focado em
         completar as quatro dimensões presentes nos dados ADS-B (latitude, longitude, altitude e
         velocidade em relação ao solo). Este trabalho é útil para viabilizar análises do desempenho
         de voos históricos realizados em regiões de cobertura limitada, ou ainda, para prever traje-
         tória de voos em sistemas de gerenciamento de sistema aéreo (ATMs). A comparação entre
         trajetórias reais e estimadas em um conjunto de 517 voos mostrou acurácia superior a 92%
⇤
  Submetido em 26/09/2017 - Aceito em 01/10/2018
1
  Doutor em Engenharia Mecânica pela UFMG. Mestre em Informática e graduado em Sistemas de Informação pela
  PUC Minas. Professor do Departamento de Ciência da Computação da PUC Minas, Brasil– sandro.j@pucminas.br
2
  Aluno de Graduação em Engenharia de Produção pelo Instituto Federal de Minas Gerais (IFMG), Bambui, MG,
  Brazil – caioadfranco@gmail.com
3
  Doutor em Ciência da Computação e Mestre em Engenharia Mecânica pela UFMG. Graduado em Engenharia
  Aeronáutica pelo Instituto Tecnológico Aeronáutico (ITA). Professor do Departamento de Engenharia Mecânica
  da UFMG, Brasil– poley@demec.ufmg.br
4
  Doutor e Mestre em Geografia pela Universidade McMaster (EUA). Graduado em Geografia Econômica pela
  University College Dublin, Irlanda. Professor do Departamento de Geografia da Universidade Estadual de Ohio,
  EUA – okelly.1@osu.edu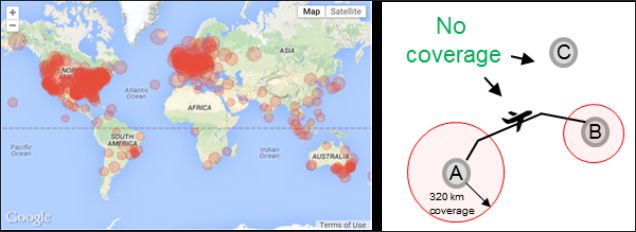
A method for estimating flight paths missing data

       para métricas de distância voadas, estimativa de consumo de combustível e correlação de
       trajetórias.
       Palavras-chave: Redes neurais artificiais. Complementação de dados. Dados ADS-B.
       Tráfego aéreo. Distância de voos. Consumo de combustível de aeronaves.

Abakos, Belo Horizonte,v. 7, n. 1, p. 84-105, nov. 2018 - ISSN: 2316-9451                        85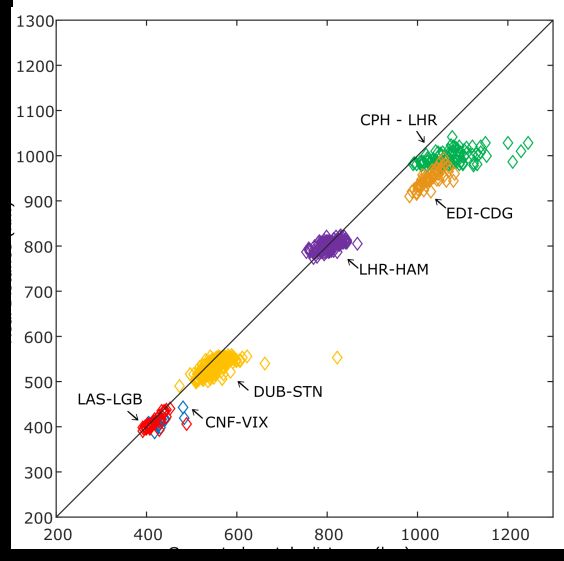
A method for estimating flight paths missing data

                                                    Abstract

       Air-traffic optimization is an essential part of airspace operation reengineering, as the num-
       ber of flights and the usage of routes increase in the world. The NextGen and SESAR
       projects are important initiatives that allow for more scalability and safety in air-traffic.
       One element of these projects is the Automatic Dependent Surveillance-Broadcast (ADS-
       B) system which allows airplanes to share their position and speed. The ADS-B antennas’
       coverage is somewhat limited in less economically developed and oceanic areas, resulting
       in the lack of flight path data. This paper proposes a method based on artificial neural
       networks (ANN), interpolation and average computation to fill flight path data partially
       tracked by ADS-B antennas. While other methods are focused on one or two dimensions
       of the flight path, this work is focused on infilling the 4-dimensions present in the ADS-B
       data (latitude, longitude, altitude and ground speed). This work is useful in analyzing per-
       formance of historical flights related to limited coverage areas or in predicting flight path in
       air-traffic management systems (ATMs). The comparison between the real and estimated
       trajectories in a set of 517 flights has shown accuracy superior to 92% for the metrics dis-
       tance flown, estimated burned fuel, and trajectory correlation.
       Keywords:       Artificial neural networks. Data filling. ADS-B data. Air-traffic. Flight
       distance. Aircraft fuel consumption.

Abakos, Belo Horizonte,v. 7, n. 1, p. 84-105, nov. 2018 - ISSN: 2316-9451                                 86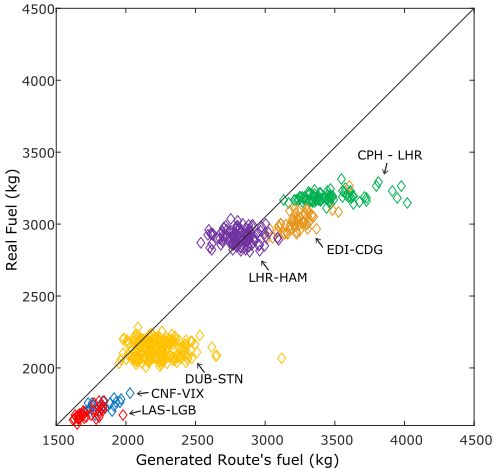
A method for estimating flight paths missing data
1 INTRODUCTION
Optimizing air traffic control and route management is a constant concern of airlines
and airport managers as air traffic increases over Europe (EUROCONTROL, 2015) and the US
(FEDERAL AVIATION ADMINISTRATION, 2015). This growing demand will eventually
render the current system unsustainable. The efficiency of the system is dependent on the
efficiency of flight operations. Hence, the optimization in route designing and flying standards
is an essential part of airspace operation reengineering.
The NextGen project was proposed to guide this reengineering process in the US. The
project includes modifications to the current method of operation. Many of these modifications
are intended to give more autonomy to pilots and planes in flight in order to reduce the inter-
medium of flight controllers. New technologies have been developed to provide the system with
information for decision making (THEUNISSEN et al., 2011). In Europe, a similar program,
named SESAR and co-founded by Eurocontrol, aims to increase the efficiency in European
airspace operational procedures (COOK et al., 2009).
An important technology that is part of the NextGen project is the Automatic Dependent
Surveillance-Broadcast (ADS-B) system, which is used by aircraft to broadcast information
about their position to an other aircraft and/or ground stations (STROHMEIER et al., 2014).
The receptor aircraft uses these data to avoid collision with the sender aircraft, while the ground
stations can use these data for other purposes. Airspace authorities collect data through their
ground antennas to control and improve the airspace. Enthusiasts have been using simple ADS-
B antennas to collect and monitor aircraft flying close to their locations and share these data
with companies like FlightAware (2016a), FlightStats (2016) and Planefinder (2018). These
companies have services such as online web sites which provide flight information for internet
users .
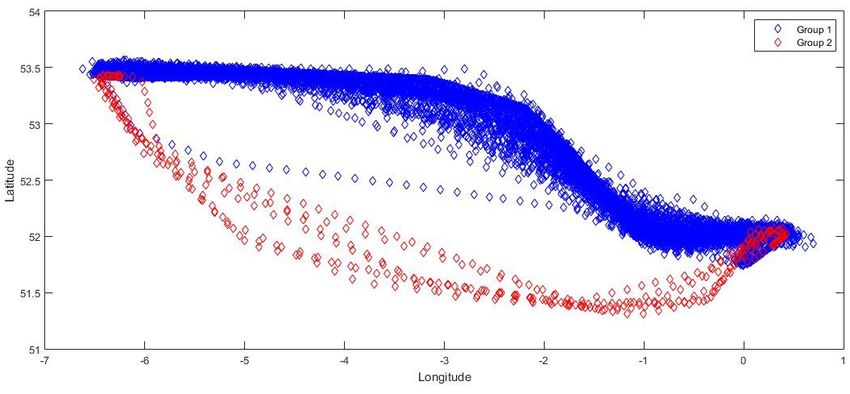
For many reasons there are flights that do not have their path totally tracked by ground
antennas. Among these reasons are the lack of coverage range of these antennas which is about
320 km, as well as their limited quantity (FLIGHTAWARE, 2106a). This can be seen in Figure
1, which illustrates the FlightAware coverage. This coverage limitation is evident in developing
areas such as Africa, Asia and South America, and over the oceans. The lack of data can affect
studies that aim to analyze the performance of historical flight data and propose improvements
in flight operations.
Abakos, Belo Horizonte,v. 7, n. 1, p. 84-105, nov. 2018 - ISSN: 2316-9451 87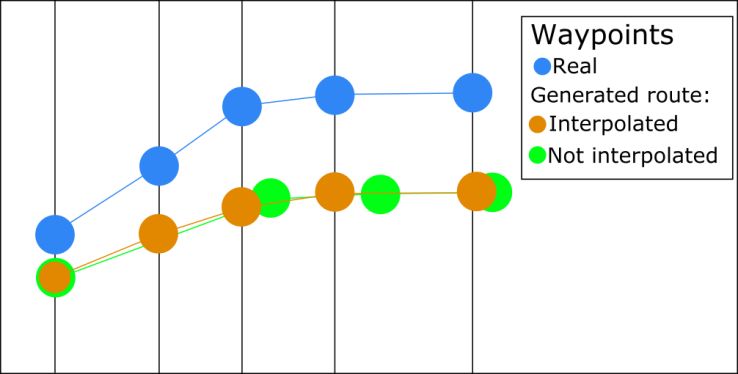
A method for estimating flight paths missing data

                        Figure 1 – FlightAware ADS-B antennas coverage

                                        Source: FlightAware (2018b).

        In this paper, a method to fill flight paths, composed by positions (latitude, longitude and
altitude) and ground speed, known as 4-dimension paths is proposed. This is useful to fill flight
paths partially tracked by ADS-B antennas and allow performance analysis of historical flight
data related to limited coverage areas. This method could also be an alternative to air-traffic
management systems (ATM) that may need to predict some parts of the flight path.
        The process of finding the appropriate algorithms and parameters is a contribution which
can support researchers and professionals on solving the flight path missing data problem. The
proposed method was constructed by analyzing and combining different algorithms and param-
eters. The resulting method uses artificial neural network (ANN), interpolation and average
computation algorithms.
        Methods using ANNs to fill missing data are not new in literature. Coulibaly and Evora
(2007) used a similar method to infill missing data in precipitation records. ANNs were also
used to fill-in medical data that was not collected from a patient, yet still assisted in diagnos-
ing an appendicitis (PRABHUDESAI et al., 2008). In the aeronautical field, there was some
research on the use of ANNs in predicting parameters (DONGARE; MOHAMED, 2015; RAIS-
INGHANI; GHOSH, 2000) such as landing speed (DIALLO, 2012), and predicting the vertical
speed of an aircraft (SHARMA; CHATURVEDI, 2011). Diallo (2012) has shown an error of
less than 12.6% in 95% of the cases, while Sharma and Chaturvedi (2011) showed that the error
increases in proportion to the distance predicted. These methods are focused on one or two
dimensions of the flight path, while the proposed method in this work is focused on infilling the
4-dimensions present in the ADS-B data (COULIBALY; EVORA, 2007).
        The following sections are organized as follows: in Section two, the proposed methodol-
ogy, algorithms and metrics are described; while Section three presents the results. Comments
and conclusions are presented in Section four.

2 METHODOLOGY

        The methodology which was used in this work is comprised of ANNs and statistical
tools (interpolation and average) to predict the cruise and descent flight path (4D) given a

Abakos, Belo Horizonte,v. 7, n. 1, p. 84-105, nov. 2018 - ISSN: 2316-9451                        88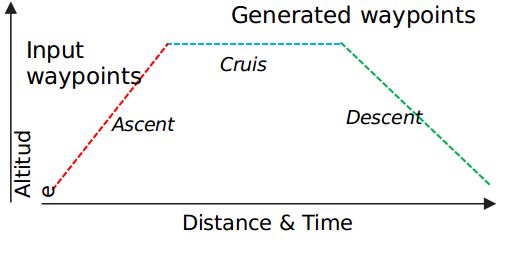
A method for estimating flight paths missing data

set of waypoints from the flight ascent phase. The waypoints dataset was made available by
PlaneFinder.net company. For the method construction, many algorithm parameters were tested
using flights with complete paths over six routes: four in Europe, one in the United States and
one in Brazil. The resulting method with the best performance is presented in Section 2.2. Three
metrics were used to assess the performance of the method: distance flown, estimated fuel burn,
and coordinates correlation. The metrics give information about how close the generated flight
paths are to the real ones.

2.1 Data

         The data used in this work were collected through ADS-B antennas by PlaneFinder.net
feeders throughout September 2013. Initially 612 flights over six routes were selected from
the dataset provided by PlaneFinder.net. After filtering outlier flights, 517 flights were used for
parameter definition and the neural network training task. Each flight has a set of waypoints
(latitude, longitude, altitude and ground speed), airline code, origin and destination airports
codes, and departure and arrival dates and times. To guarantee complete flight paths, the se-
lected flights must have no more than 20 km between each waypoint in their path, otherwise the
flight is considered an outlier. Table 1 summarizes the routes’ details.

                         Table 1 – Dataset adopted in the analysis
                                    # flights analyzed
               Routes                                   Airlines Aircraft                Distance
                                           (used)
    Las Vegas (LAS) - Long Beach
                                           32 (32)       JetBlue   A320                     372
    (LGB)
    Dublin (DUB) - London (STN)          225 (217)       Ryanair   B738                     472
                                                           Not
    Edinburgh (EDI) - Paris (CDG)          93 (56)                 A319                     870
                                                        Specified
    Belo Horizonte (CNF) - Vitoria                         Not
                                           21 (21)                 A320                     392
    (VIX)                                               Specified
    Copenhagen (CPH) - London                              Not
                                          120 (82)                 A320                     982
    (LHR)                                               Specified
    London (LHR) - Hamburg                                 Not
                                         121 (109)                 A320                     748
    (HAM)                                               Specified
    Total                                612 (517)
           Source: Elaborated by authors using a dataset provided by PlaneFinder.net company.

2.2 The flight path data-filling method

        The proposed flight path data-filling method receives as input n sequential waypoints on
the flight ascent stage (typically n = 2) and then completes the other flight path stages (cruise
and descent) using artificial neural networks, interpolation and average techniques. An illustra-

Abakos, Belo Horizonte,v. 7, n. 1, p. 84-105, nov. 2018 - ISSN: 2316-9451                           89
A method for estimating flight paths missing data
tion of the algorithm data input and the techniques adopted in each flight phase is provided in
Figure 2.
Figure 2 – Illustration of flight path data-filling algorithm and its adopted techniques
Flight
Technique Dimension
Phase
Latitude
Cruise
Neural longitude
Network Latitude
Descent longitude
Altitude
Interpolation Cruise Altitude
Cruise, Ground
Average
Descent speed
Source: Elaborated by authors.
The proposed method uses a sliding window method in applying the ANN functions to
the data and complementary statistical techniques. The sliding window method takes as input n
sequential values and returns a predicted value based on the inputs. The new value is used with
the n-1 previous values to generate the next value up until the end of the iteration. This method
is illustrated in Figure 3.
Figure 3 – Sliding Window Method
Source: Elaborated by authors.
The sliding window method and artificial neural networks were initially used to predict
latitude, longitude, altitude and ground speed for each waypoint. However, the neural networks
showed unsatisfactory performance in predicting the flight altitude in the cruise phase, and the
ground speed in the cruise and descent stages. To overcome this problem, the flight altitudes in
cruise phase were estimated by the use of a simple interpolation method. To predict the ground
speeds, a method that assumes average speed by a percentage of total waypoint distance was
used (see Section 2.4).
As the stop condition of the flight path data-filling algorithm, the method creates a virtual
waypoint with the coordinates of the destination airport and ground speed was assumed to be
zero. This waypoint is connected to the closest generated waypoint within a distance of less
than 10 km to the airport.
Abakos, Belo Horizonte,v. 7, n. 1, p. 84-105, nov. 2018 - ISSN: 2316-9451 90A method for estimating flight paths missing data
2.3 Artificial Neural Networks (ANNs)
Artificial Neural Networks is a computing method that can be used for function approx-
imations based on training with historical values. In this paper the ADS-B data were used to
train the networks. The Matlab app nftool (MATLAB, 2016) was used along with the Matlab
programming language to create, train and implement the network. The tool creates a function
in Matlab language that is effectively the ANN, with its optimal weights and biases.
Many distinct architectures and parameters were tested while varying the number of
inputs, outputs and neurons in the hidden layer and the learning algorithm. The number of
inputs and outputs was responsible for considerable differences in the final results. The search
process to find the most suitable ANNs for the data infilling problem is detailed below:
i) Initial setup: A feed-forward neural network was created with latitude, longitude and
altitude as inputs for each route. The inputs are related to a couple of waypoints, totalizing
6 input values. The idea was to evaluate the training convergence and then add or remove
columns as needed. The ANN had two layers (input and hidden neurons) and sigmoid activation
functions. The dataset used in the neural networks learning processes (minimizing error) were
subdivided in: training, validation and test datasets with respectively 70%, 15% and 15% of the
data. The metric means squared error (MSE) was used to compare the results.
ii) Disjoint dimension patterns: putting altitude and ground speed together with latitude
and longitude did not work so well. This initial setup showed an error of up to 20% in predicting
the routes. Even by varying the number of neuros in the hidden layer, from 2 to 20 neurons, and
testing different learning algorithm, the results were not improved. For this reason, the latitude
and longitude were separated in a different ANN. The altitude and ground speed were tested
as input for distinct ANNs. These experiments indicate that the level of association among the
trajectory dimensions is low, except between latitude and longitude.
iii) Altitude and ground speed: these metrics also did not work as ANN inputs separately,
except for altitude in the descent flight stage, which showed an error inferior to 10% in the test
and validation tasks. Therefore, an another method was evaluated to predict ground speed.
Two ANNs for each route were created: one for the latitude-longitude prediction and
the other for altitude prediction in the descent phase. Both were Feed Forward ANNs trained
with the Levenberg-Marquardt algorithm (LEVENBERG, 1944). The final setups having the
least errors are illustrated in Figure 4.
Abakos, Belo Horizonte,v. 7, n. 1, p. 84-105, nov. 2018 - ISSN: 2316-9451 91A method for estimating flight paths missing data
Figure 4 – Final ANN architectures
Source: Elaborated by authors.
It is important to note that the test and validation results obtained in the search process
for suitable ANNs are not the final and conclusive results to infer the efficiency of the proposed
method (Section 2.2). The obtained results in the ANN test and validation procedures sup-
ported the data infilling method creation, but the conclusive results about the proposed method
is presented in Section 3 (Results).
2.4 Estimating ground speeds and cruise altitudes
Since the ANNs failed to predict the ground speeds and cruise altitudes, complementary
methods were proposed to improve the flight path data-filling algorithm. To predict the ground
speed, an average-based method was used to calculate the average ground speed according to the
percentage of flown distance compared to the total waypoint distance. We assume the average
as an acceptable value because this dimensional data flight has a low operational pattern. Thus,
each percentile would have an average value for the speed.
Pn
i=1GSik
GSk = , (1)
n
Where:
GSk : average ground speed at the k-th percentile of the flown distance
GSik : ground speed in the flight i at the k-th percentile of the flown distance
n: number of performed flights in a route
The altitude value for the cruise phase in the generated flight path is the last altitude of
the input waypoints – typically the top of climb waypoint. In most of the flights, top of climb
waypoint is the average value for the flight altitude at cruise phase. A waypoint is considered
to be in cruise phase if its distance from the departure airport is larger than the average distance
from the flights starting cruise phase, or if its altitude is within a margin that varies for each
route. The end of the cruise phase is considered to be the average distance from the origin
airport where the flights start the descent phase.
Abakos, Belo Horizonte,v. 7, n. 1, p. 84-105, nov. 2018 - ISSN: 2316-9451 92A method for estimating flight paths missing data
2.5 Grouping flights
Some flights had discrepancies in their data, either because of multiple paths or due to
varying altitude levels in the cruise phase. In cases where the discrepancy was evident (espe-
cially in routes where there was heavy traffic such as DUB-STN), the grouping was necessary
for the ANNs to achieve a converging result. The k-means algorithm (WU et al., 2008) was
used to group flights according to maximum altitude, latitude or longitude, and the distance
measured was the squared Euclidian distance. The number of groups (parameter k) was chosen
based on the number of typical paths (generally k = 2).
Figure 5 – Flights grouped by k-means algorithm
Source: Elaborated by authors.
Figure 5 illustrates flights grouped by k-mean (k = 2) in the route DUB-STN. Group 1
has 210 flights, while Group 2 has 7 atypical flights. The flights in Group 1 were considered
in the ANN training task. Only the groups with more flights per route were considered in the
ANNs training task.
2.6 Metrics
The adopted metrics used to assess the accuracy of the generated flight path are detailed
below. The first one is the waypoint distance, proposed by Almeida (2017), used to calculate
the difference between the distances of the generated and the real flight; then the correlation,
which is a method to show the correlation of two vectors, and lastly the estimated fuel burn that
demonstrates the aircraft performance of the generated flight paths (ALMEIDA, 2017).
Abakos, Belo Horizonte,v. 7, n. 1, p. 84-105, nov. 2018 - ISSN: 2316-9451 93A method for estimating flight paths missing data
2.6.1 Waypoint Distance
The Waypoint Distance (WPD) is a measure of the distance between two waypoints.
The equations used to calculate this metric are:
|s|=n 1
X
Ws = Wi,i+1 (2)
i2s
q
Wp,q = Gp,q 2 + hp,q 2 (3)
Where:
Ws : Estimated distance flown through a set of waypoints S (km);
n: Size of the set of waypoints S;
Wp,q : Estimated distance flown between a pair of sequential waypoints p and q (km);
Gp,q : Great circle distance between a pair of sequential waypoints p and q (km);
h : Variation of altitude between the waypoints p and q. (km).
The waypoint distance metric was used to compare generated flight paths and real flight
paths. An error is calculated by dividing the difference between the total WPD of the two paths
(real and generated) by the total WPD of the real flight, and then multiplied by 100. The final
result for this metric is the mean of all the errors by route.
2.6.2 Fuel Consumption
A complementary metric used to compare the generated flight paths and real flight paths
was the estimated fuel burn. The method used to estimate the fuel consumption of the flights
is in accordance with the Base of Aircraft (BADA) model, proposed by Eurocontrol (POLES
et al., 2010). According to the BADA User Manual (version 3.12) released in 2014, the BADA
equations are mainly projected to calculate aircraft performance in the context of trajectory
simulations and air traffic management (ATM) systems (EUROCONTROL, 2014). This model
has equations that can be used to generate trajectories and calculate fuel consumption for these
trajectories. Some studies have been proposed to improve BADA model. This work consid-
ered adaptations in BADA equations proposed by Oaks et al. (2010), which enabled fuel burn
estimation from actual flight path data (e.g. ADS-B dataset).
The BADA manual proposes equations to calculate the aircraft fuel consumption rate
(kg/min). Essentially, what Oaks et al. (2010) and Belle and Sherry (2013) suggested is to
multiply the calculated BADA fuel flow value by a certain time duration t , and then obtain
the fuel burned in this interval. In this work the t variable is assumed to be the flight time
elapsed between a pair of waypoints. To obtain the overall fuel burned, the process has to be
repeated for all sequential pairs of waypoints (OAKS et al., 2010; BELLE; SHERRY, 2013).
Abakos, Belo Horizonte,v. 7, n. 1, p. 84-105, nov. 2018 - ISSN: 2316-9451 94A method for estimating flight paths missing data
2.6.3 Correlation
Correlation is a method of comparing two curves which returns a number between -1 and
1 based on how correlated the curves are. The Pearson product-moment correlation coefficient
method (EDWARDS, 1976) is used in this paper. This method requires all points in both curves
to be aligned with a certain parameter in common (time in the case of this paper). For this
reason, it was necessary to interpolate waypoints in the generated flight path to be able to apply
the method. For the final correlation result, the average of the correlations of each flight was
calculated.
The required interpolation which created new waypoints was done with physical and
mathematical equations that would interpolate a new waypoint with latitude, longitude, altitude
and ground speed at a specific required instant t. The equations 4-7 are used to create the
interpolated point. Figure 6 illustrates interpolation of waypoints.
Figure 6 – Illustration of interpolation
Source: Elaborated by authors.
dif
Cf = Ci + ⇤ (Cj Ci ) (4)
dij
vf = vi + a ⇤ t (5)
Vi 2 Vj 2
a= (6)
2dij
a⇤ t2
dif = vi ⇤ t+ (7)
2
Where:
a: Acceleration (m/s2 );
v: Velocity (km/h);
Abakos, Belo Horizonte,v. 7, n. 1, p. 84-105, nov. 2018 - ISSN: 2316-9451 95A method for estimating flight paths missing data
dij: Distance from initial point i to the final point j (km);
dif: Distance from initial point i to the interpolated point f (km);
t: Time (s);
i: Initial point;
f: Interpolated point;
j: Final point;
C can be latitude, longitude (degrees) or altitude (km);
The final result for this metric is the mean of all correlations for each flight path.
3 RESULTS
This section presents the results acquired with the above described method. Section 3.1
illustrates a single actual flight path and its generated path. Section 3.2 presents the results
of the correlation between generated and real flights path. Section 3.3 demonstrates that the
method can satisfactorily approximate the real path data by analyzing the distance and fuel burn
metrics.
3.1 Visual Analysis
In other to illustrate the potential performance of the proposed method, the graphs in
Figures 7, 8, 9 and 10 show a selected flight in the LHR-HAM route (best result to the proposed
algorithm). The blue dots are the generated data and the orange line is the real data.
Abakos, Belo Horizonte,v. 7, n. 1, p. 84-105, nov. 2018 - ISSN: 2316-9451 96A method for estimating flight paths missing data
Figure 7 – Real vs generated latitudes
Source: Elaborated by authors.
Figure 8 – Real vs generated longitudes
Source: Elaborated by authors.
Abakos, Belo Horizonte,v. 7, n. 1, p. 84-105, nov. 2018 - ISSN: 2316-9451 97A method for estimating flight paths missing data
Figure 9 – Real vs generated altitude
Source: Elaborated by authors.
Figure 10 – Real vs generated ground speed
Source: Elaborated by authors.
Abakos, Belo Horizonte,v. 7, n. 1, p. 84-105, nov. 2018 - ISSN: 2316-9451 98A method for estimating flight paths missing data
Visually, it is possible to observe the generated waypoints are very close to the actual
flight path in terms of latitude, longitude and ground speed. The altitude in the cruise phase was
not so accurate for this single selected flight, because it was assumed the average top of climb
altitude of all flight in this route. In this case the average top of climb was 8.7 km vs 11 km of
the single real flight path.
For all flights, it was noticed that the generated flight paths were visually close to a
typical flight. This fact is due to the generalization characteristic of ANNs. The ANN fits all
data used in its training. An advantage of this method is that it could be used to generate a
typical route that could be set as a flight standard for airlines. It could also be a comparison tool
to assess how close the real flights are from the typical route and provide information about the
efficiency of the trips.
3.2 Correlation Analysis
Correlation is a more significant factor for this work since it compares each real way-
point with its respective generated/interpolated point, thus providing a better estimation of how
discrepant both flight paths are. Each real flight path was compared with a correspondent gen-
erated flight path in terms of correlation, and then the percentage of difference (error) between
the real and generated flight where obtained. For each route the average of the percentage of
difference (error) between the real and generated flight paths were calculated as shown in Table
2.
Table 2 – Error and standard deviation between the real and generated routes
Route/
Ground
Dimension Latidude Longitude Altitude
Speed
(%)
5.87 0.06 0.55 3.34
CNF-VIX
(2.00) (0.07) (0.60) (2.40)
0.12 0.11 1.99 5.25
CPH-LHR
(0.10) (0.06) (1.37) (1.20)
0.26 0.05 2.65 3.54
LHR-HAM
(0.26) (0.006) (1.43) (1.34)
0.41 0.13 0.72 3.07
LAS-LGB
(0.22) (0.20) (0.53) (1.85)
1.83 0.64 2.49 3.19
DUB-STN
(0.15) (0.001) (4.29) (0.54)
0.23 0.52 2.48 7.73
EDI-CDG
(0.60) (0.37) (0.36) (1.20)
Source: Elaborated by authors.
All routes showed correlations above 92%, with less errors in latitude and longitude.
Some outliers are very explicit, such as in the case of latitude in the CNF-VIX route. In this
case, the data presented two ways to approach the VIX airport and the ANN only predicts one.
This lowered the correlation in flights that landed differently from the “usual.”
Abakos, Belo Horizonte,v. 7, n. 1, p. 84-105, nov. 2018 - ISSN: 2316-9451 99A method for estimating flight paths missing data
In the ground speed column, one can see that all results are relatively high (compared to
altitude) and the EDI-CDG route in particular showed an even greater discrepancy. This route
varies greatly in speed during the cruise phase. The 95th percentile of difference between the
average maximum speed and all the flights is of 154 km/h. Climate conditions and the pilots’
way to fly aircrafts impose nonstandard ground speed to the aircraft. Since the algorithm that
predicts the ground speed takes the ground speed average to complete the results, it shows a
larger error for this case.
3.3 Distance and fuel consumption analysis
The distance difference metrics is less significant than the correlation because of the
large standard deviation of the differences between flight paths. As shown in Table 3, all the
distance differences computed for the flights did not exceed a positive 10%. The positive values
mean that the generated flight path is shorter than its respective real one. The high values for
this metrics can be explained by circumstances such as air traffic, weather conditions and factors
that could affect the flown distance.
Table 3 – Mean and Standard deviation for Distance and Fuel Burn
Distance (%) Fuel Burn (%)
Route
Mean STD Mean STD
CNF-VIX 3.71 3.59 5.18 3.76
LHR-HAM 0.65 2.24 -3.66 4.47
LAS-LGB 1.91 3.33 2.83 3.75
DUB-STN 3.24 3.6 3.72 6.50
EDI-CDG 7.78 1.36 6.72 2.27
CPH-LHR 7.17 3.78 7.46 4.54
Source: Elaborated by authors.
The fuel burned analysis is similar to the distance analysis. These metrics comparison
tend to be very close, since the fuel burned is proportional to the distance flown. The standard
deviation for distance and fuel varies from 1.36 to 3.78 percentage points and from 2.27 to 6.50
percentage points respectively. In most cases, the algorithm predicted shorter flights and less
fuel burned.
Figures 11 and 12 show scatter graphs with the 517 analyzed flights and routes in terms
of distance flown and fuel burned. The generated flight path tends to be longer in terms of
distance and fuel consumption because of the smoothing (nonlinear) behavior of the proposed
method in ascent and descent flight path phases. The real flight path tends to be shorter because
they are optimized by aircraft computers and airspace authorities. A post processing method
could be used to optimize the generated route in the same way the pilots used to do after receiv-
ing the flight plan. In conclusion, since the generated flight paths are not underestimated by the
real ones, the proposed method was shown to be robust.
Abakos, Belo Horizonte,v. 7, n. 1, p. 84-105, nov. 2018 - ISSN: 2316-9451 100A method for estimating flight paths missing data
Figure 11 - Distance comparison
Source: Elaborated by authors.
Abakos, Belo Horizonte,v. 7, n. 1, p. 84-105, nov. 2018 - ISSN: 2316-9451 101A method for estimating flight paths missing data
Figure 12 - Fuel burn difference
Source: Elaborated by authors.
Abakos, Belo Horizonte,v. 7, n. 1, p. 84-105, nov. 2018 - ISSN: 2316-9451 102A method for estimating flight paths missing data
4 COMMENTS AND CONCLUSIONS
The objective of this paper is to develop a method that can estimate missing data from
an incomplete data set. This paper provides good correlation results for all cases (of over 90%),
although less accurate in predicting altitude and ground speed, although almost all correlations
were above 95%.
The distance difference however, varied from 0.65% to 7.78% shorter in the generated
flight paths in comparison with the real ones. This is not a failure but a limitation of the method.
Some flights were longer than others and, in these cases, the neural network was not able to
predict with a high accuracy due to the large discrepancy among them. This may happen for
a series of reasons ranging from extended time in air because of air traffic, to airport capacity.
This work also contributes in being able to infill the 4-dimensions present in the ADS-B data
(latitude, longitude, altitude and ground speed).
For future works, it is recommended that additions and new analyses are done in the
proposed algorithm to fill missing data from different phases of the flight (ascent and cruise),
especially by comparing the results with other computational and non-statistical methods. An-
alyzing methods for different flight ranges would also be interesting. Another extension of this
work would be the creation of an algorithm that would complete missing flight data without any
human interaction.
ACKNOWLEDGEMENTS
The authors thank the Brazilian funding agencies CAPES (004162/2014-05), FAPEMIG
(APQ-02507-17) and CNPQ (309803/2013-6) and thank the Planefinder.net company for the
provided data sets.
Abakos, Belo Horizonte,v. 7, n. 1, p. 84-105, nov. 2018 - ISSN: 2316-9451 103A method for estimating flight paths missing data
REFERENCES
ALMEIDA, S. J. Análise e simulação baseada em agentes de rotas aéreas. UFMG, p. 108, 2017.
BELLE, A.; SHERRY, L. Estimated fuel burn performance for {MDW} arrivals. In: 2013
Aviation Technology, Integration, and Operations Conference. [S.l.: s.n.], 2013. p. 4389.
Disponível em: . Acesso em: 25 out. 2018.
COOK, A. et al. Dynamic cost indexing–managing airline delay costs. Journal of air transport
management, Elsevier, v. 15, n. 1, p. 26–35, 2009. Disponível em: .0969-6997. Acesso em: 25 out. 2018.
COULIBALY, P.; EVORA, N. D. Comparison of neural network methods for infill-
ing missing daily weather records. Journal of hydrology, Elsevier, v. 341, n. 1-
2, p. 27–41, 2007. Disponível em: . Acesso em 25 de abr. 2016.
DIALLO, O. N. A predictive aircraft landing speed model using neural network. In: IEEE.
Digital Avionics Systems Conference (DASC), 2012 IEEE/AIAA 31st. [S.l.], 2012. p. 3D2–
1.
DONGARE, V.; MOHAMED, M. Lateral-directional aerodynamics parameter estimation using
neural partial differentiation. In: IEEE. Cognitive Computing and Information Processing
(CCIP), 2015 International Conference on. [S.l.], 2015. p. 1–6.
EDWARDS, A. L. An introduction to linear regression and correlation. [S.l.], 1976.
Disponível em: (A series of books in psychology).
.0716705621. Acesso em: 25 out. 2018.
EUROCONTROL. User manual for the base of aircraft data (BADA), revision 3.12. EEC-
Technical-Report-130416, 2014. Disponível em: . Acesso em: 25 out.
2018.
EUROCONTROL. EUROCONTROL Seven-Year Forecast February 2015. 2015.
Disponível em: . Acesso em: 25 out. 2018.
FEDERAL AVIATION ADMINISTRATION. FAA Aerospace Forecast: Fiscal Years 2015-
2035. [S.l.: s.n.], 2015.
FLIGHTAWARE. Live Flight Tracking. 2004b. Disponível em: .
Acesso em: 20 jun. 2004b.
FLIGHTAWARE. FlightAware ADS-B Coverage Map. 2106a. Disponível em: . Acesso em: 1 abr. 2016a.
FLIGHTSTATS. Global Flight Tracker. 2016. Disponível em: .
Acesso em: 1 abr. 2016.
LEVENBERG, Kenneth. A method for the solution of certain non-linear problems in least
squares. Quarterly of applied mathematics, v. 2, n. 2, p. 164–168, 1944.
MATLAB. Neural Network Toolbox. 2016. Disponível em: . Acesso em: 1 abr. 2016.
Abakos, Belo Horizonte,v. 7, n. 1, p. 84-105, nov. 2018 - ISSN: 2316-9451 104A method for estimating flight paths missing data OAKS, R.; RYAN, H.; PAGLIONE, M. Prototype implementation and concept validation of a 4-d trajectory fuel burn model application. In: AIAA Guidance, Navigation, and Control Conference. [S.l.: s.n.], 2010. p. 1–17. Disponível em: . Acesso em: 25 out. 2018. PLANEFINDER. A flight data tracking company. Disponível em: . Acesso em: 25 out. 2018. POLES, Damir; NUIC, Angela; MOUILLET, Vincent. Advanced aircraft performance model- ing for atm: Analysis of bada model capabilities. In: IEEE. Digital Avionics Systems Confer- ence (DASC), 2010 IEEE/AIAA 29th. [S.l.], 2010. p. 1–D. Disponível em: .978-1-4244-6616-0. Acesso em: 25 out. 2018. PRABHUDESAI, SG et al. Artificial neural networks: useful aid in diagnosing acute appen- dicitis. World journal of surgery, Springer, v. 32, n. 2, p. 305–309, 2008. Disponível em: . Acesso em: 25 out. 2018. RAISINGHANI, S. C.; GHOSH, A. K. Parameter estimation of an aeroelastic aircraft using neural networks. Sadhana, Springer, v. 25, n. 2, p. 181–191, 2000. Disponível em: . Acesso em: 25 out. 2018. SHARMA, Anurag; CHATURVEDI, Ashish. Gradient descent feed forward neural networks for forecasting the trajectories. International Journal of Advanced Science and Technology, Citeseer, v. 34, p. 83–88, 2011. STROHMEIER, Martin et al. Realities and challenges of nextgen air traffic management: the case of ads-b. IEEE Communications Magazine, IEEE, v. 52, n. 5, p. 111–118, 2014. THEUNISSEN, Erik; RADEMAKER, RM; LAMBREGTS, AA. Navigation system autonomy and integration in nextgen: Challenges and solutions. In: IEEE. Digital Avionics Systems Conference (DASC), 2011 IEEE/AIAA 30th. [S.l.], 2011. p. 6C5–1. WU, Xindong et al. Top 10 algorithms in data mining. Knowledge and information systems, Springer, v. 14, n. 1, p. 1–37, 2008. Disponível em: . .1011500701. Acesso em: 25 out. 2018. Abakos, Belo Horizonte,v. 7, n. 1, p. 84-105, nov. 2018 - ISSN: 2316-9451 105
You can also read