COMBINED ONTOLOGY-DRIVEN AND MACHINE LEARNING APPROACH TO MONITORING OF BUILDING ENERGY CONSUMPTION - ashrae
←
→
Page content transcription
If your browser does not render page correctly, please read the page content below
2018 Building Performance Modeling Conference and
                                                                            SimBuild co-organized by ASHRAE and IBPSA-USA
                                                                                                                  Chicago, IL
                                                                                                        September 26-28, 2018

          COMBINED ONTOLOGY-DRIVEN AND MACHINE LEARNING APPROACH TO
                 MONITORING OF BUILDING ENERGY CONSUMPTION

                      Parastoo Delgoshaei1, Mohammad Heidarinejad2 and Mark A. Austin3
                1 National Institute of Standards and Technology (NIST), Gaithersburg, MD, USA
                                 2 Illinois Institute of Technology, Chicago, IL, USA
                                  3 University of Maryland, College Park, MD, USA

    Abstract                                                             ward enabling modern technologies by using judicious
                                                                         combinations of knowledge representation and reasoning
    A number of studies within the building domain have
                                                                         (KRR) and machine learning (ML) to provide new ap-
    independently considered knowledge representation and
                                                                         proaches in management of energy in buildings. We envi-
    reasoning (KRR) and machine learning (ML). This paper
                                                                         sion that KRR and ML formalisms will work side-by-side,
    explores opportunities for how these artificial intelligence
                                                                         providing complementary and supportive roles in the col-
    (AI) technologies can be combined to provide synergic
                                                                         lection and processing of data, identification of events and
    assistance in intelligent building systems. A case study is
                                                                         automated decision making.
    used to demonstrate the construction of semantic knowl-
    edge from weather and utility ontologies. That knowledge
    is used as a semantically annotated training set in cluster-                                     AI for Enhanced Building Monitoring
    ing algorithms that identify consumption patterns, and the
    results of clustering are stored in ontologies for further
    inference. This paper presents a roadmap to intelligent                                   Knowledge                          Machine
    building monitoring techniques that uses both historical                                 Representation                      Learning

    data and the underlying semantic knowledge.

    Introduction                                                                Ontologies        Rules              Data

    Problem Statement. In 2016 the building sector in                          Figure 1: AI for enhanced energy monitoring.
    the U.S. consumed approximately 40% of the total en-
    ergy consumption (EIA ), suggesting that with advances
    in technology over the past few decades, positive op-                Figure 1 is a high-level architectural schematic of the
    portunities exist. One opportunity resides in addressing             KRR/ML components and their interactions. The seman-
    challenges associated with buildings-to-grid integration             tic (KRR) side is defined by domain and meta-domain
    (EERE 2018). First, there is currently an unprecedented              data, ontologies and rules that can dynamically respond
    amount of metered building energy and sensor data that               to events. The KRR encapsulates the data and represents
    are not being effectively used to optimize energy perfor-            it with reduced dimensionality. The ML side will clas-
    mance of buildings. Second, building energy management               sify data into collections and learn about cause-and-effect
    systems (BEMS) are used in only approximately 40% of                 relationships embedded in the data. ML can also be devel-
    commercial buildings (typically large commercial build-              oped for the identification of anomalies (faults) in system
    ings), but there is an interest in utilizing sensors and data        performance, thereby acting as a trigger for the activation
    storage in all buildings. Present-day expectations are that          of KRR diagnostic procedures. With this approach, the
    deployment of sensors in support of connected devices                knowledge of cause-and-effect relationships embedded in
    and systems will grow 80% annually (Jiron, 2018 ). Cur-              the data revealed by ML algorithms can provide verifica-
    rent buildings under-utilize the available sensor data and           tion for the effectiveness of rules developed for KRR.
    do not efficiently integrate with the smart grid. Our work
    is driven by the belief that these limitations stand in the          The design of a path from what “seems like a good idea”
    way of improvements to energy consumption in the build-              to a “prototype implementation” requires that three impor-
    ing sector.                                                          tant challenges be addressed: (i) gathering of knowledge
                                                                         about the physical building environment, (ii) design of an
    Scope and Objectives. This paper takes a first step to-               efficient means for dealing with large volumes of hetero-

© 2018 ASHRAE (www.ashrae.org) and IBPSA-USA (www.ibpsa.us).                                                                           667
For personal use only. Additional reproduction, distribution, or transmission in either print or digital form is not permitted without
ASHRAE or IBPSA-USA's prior written permission.
geneous streaming data (e.g., occupancy, utility, weather,           tiveness of the prediction performance of the model can
    building architecture, sensor and equipment), and (iii) use          then be calculated. Supervised learning such as the near-
    of the knowledge and data as a source of semantically                est neighboring algorithm, requires labeled datasets (e.g.,
    annotated training sets in machine learning algorithms.              the data are labeled with the correct answer), a process
    Since the goals of the current study are just to demon-              that can be very expensive. This algorithm makes predic-
    strate that the KRR-ML interaction is advantageous, we               tions on new data points based on their proximity to the
    deliberately keep the data analysis simple.                          points in the training set.

    Background                                                           In contrast to supervised learning, the goals of unsuper-
                                                                         vised learning such as the K means clustering algorithm
    This section presents related work in knowledge model-               are to model and identify the underlying structure or pat-
    ing with ontologies and rules, and supervised and unsu-              terns in a dataset when no correct answers (labels) are
    pervised machine learning.                                           provided. Semi-supervised learning methods fall between
                                                                         the strategies of supervised and unsupervised learning and
    Ontology Modeling and Representation. The work in                    employ combinations of labeled and unlabeled data. First,
    (Lee E.A. 2003), presented an extension to the World                 the unsupervised method is used to identify patterns and
    Wide Web (WWW) named the Semantic Web. The Se-                       then supervised learning is used to draw the best predic-
    mantic Web is capable of automatically handling Web                  tions for the unlabeled data using the labels generated by
    data without human knowledge interpretation and input.               unsupervised learning. The prediction decision model is
    In the context of the Semantic Web, data retrieval is based          then tested on labeled data. This semi-supervised tech-
    on semantic relationships between data categories and                nique can address a wide range of engineering applica-
    classes, not just numeric values. This improves knowl-               tions including building energy performance, and proce-
    edge sharing and integration of homogenous data sources.             dures needed for fault detection and diagnostic analysis of
    In KRR, an ontology is a key element to formally and ex-             building equipment.
    plicitly describe the main concepts or classes of the do-
    main that stores data for and the relationships between              Machine Learning for Building Energy. Recently, data
    those concepts. One common language to describe on-                  scientists and engineers have applied machine learning
    tologies is Web Ontology Language (OWL). Other lan-                  techniques to a variety of problems ranging from fraud
    guages, such as Semantic Web Rule Language (SWRL),                   protection to online advertising. Applications in building
    can express rules and logic in a model. Rules are mecha-             performance include mechanical system controls, fault
    nisms to infer implicit knowledge based on explicit facts            detection and diagnostics, and building energy monitor-
    in the ontology. Semantic Web technologies have been                 ing. The K-means clustering algorithm is widely used
    adopted in research efforts in computer science over the             to assess the energy performance of buildings (Miller C.,
    past two decades (Liu X., Li Z. and Jiang S. 2016).                  Nagy Z. and Schlueter A. 2018). This unsupervised tech-
                                                                         nique categorizes data into subgroups that share similar-
    Supervised and Unsupervised Machine Learning. ML                     ities. (Heidarinejad, M., Dahlhausen, M., McMahon, S.,
    techniques learn about a system’s behavior and support               Pyke, C. and Srebric, J. 2014) used K-means cluster anal-
    decision-making and predictions. These methods are be-               ysis to classify buildings in general into high, medium,
    ing used to solve complex engineering applications that              and low energy intensity in order to identify similarities
    entail a large number of independent parameters and non-             and differences in the key variables contributing to the en-
    linear interdependencies that cannot be easily modeled               ergy use patterns. As a case for the supervised learning,
    from first principles. For our purposes, understanding                (Valgaev O. and Kupzog F. 2016) developed a model that
    building energy consumption patterns is among these ap-              is parameterized automatically and provides a forecast us-
    plications, where outdoor weather, building occupancy,               ing only historic building load measurements as an input
    and performance of mechanical systems are the features               based on K-nearest neighbor approach. It was used on a
    that influence the building energy performance.                       large sample of simulated mixed-usage buildings of dif-
                                                                         ferent sizes. Their results show that the model accuracy
    ML algorithms can use supervised or unsupervised learn-              is superior to the forecast obtained using individual load
    ing. Supervised learning typically encompasses two steps:            profiles created for each building.
    (i) training and (ii) predicting. Datasets are also divided
    into training datasets and testing datasets. The training            An important consideration, in addition to energy con-
    step allows identification of the decision model that pro-            sumption, is the cost of electricity. A flat electricity rate
    vides the dependency of the target (predicted variable) on           is common in residential buildings, but utility providers
    the features (impacting variables). In the next step, the de-        are beginning to offer programs that provide a balance be-
    cision model is applied to the testing datasets; the effec-          tween the demand and supply of electricity. Time-of-use

© 2018 ASHRAE (www.ashrae.org) and IBPSA-USA (www.ibpsa.us).                                                                           668
For personal use only. Additional reproduction, distribution, or transmission in either print or digital form is not permitted without
ASHRAE or IBPSA-USA's prior written permission.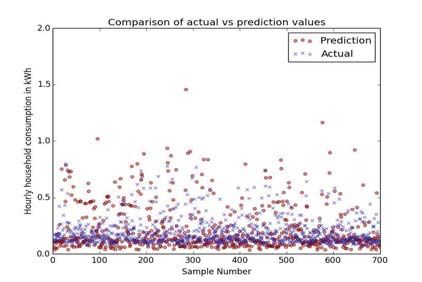
Domain Data Models, Ontologies and Rules

                                    Domain          design flow          Ontology Classes       design flow              Domain Data Models and
                                    Rules                                and Properties                                  Sources of Data (XML data files)
                                      Engineering                          Engineering                                     Engineering
                           (a)
                                           Building.rules                      Building.owl                                     Building model

                                           FDD.rules                           FDD.owl                                          FDD model

                                           Equipment.rules                     Equipment.owl                                    Equipment model
                                                                                                        visit
                                           Utility.rules                       Utility.owl                                      Utility model
                                      Environment                          Environment                                     Environment
                                           Weather.rules                       Weather.owl                                      Weather model

                                                                                                                                                             Domain Data
                                           Occupant.rules                      Occupant.owl                                     Occupant model

                                                                                                        Clusters
                                                 load
                                                                                         load
                                 Event−driven Processing of Events                                                       Unsupervised Machine Learning

                                                                  load                                                               Clustering
                                             Reasoner                          Semantic Graphs

                                                           graph transformation                                                     Classification
                           (b)                                                                                     (c)
                                                                                                 Results of Rule Checking

    Figure 2: Proposed architecture for knowledge-assisted machine learning approach to building monitoring and man-
    agement.

    (TOU) programs calculate the cost of electricity based on                                 based decision making. Rules can be developed to infer
    the time of day and date. A common TOU program of-                                        new knowledge by combining and reasoning with data
    fers summer and winter rates, and each season could have                                  from multiple domains to help with cross-domain deci-
    up to three rates: on-peak, mid-peak, and off-peak. An-                                   sion making.
    other example is a voluntary rebate program in which the
    resident allows the utility provider to cycle the resident’s                                                      >
    central air conditioner or heat pump over short intervals on                                                   AbstractOntologyModel
    selected summer days. These days are often called peak                                                                                                                   hosting visitor
    savings days and only occur for a short period of time                                                                            extend
                                                                                                                                                     visit
    during the summer. We anticipate that machine learning                                                                Jena Semantic
                                                                                                                                                                             Data Model
    techniques will provide valuable insight on the impact of                                                                 Model
    complex utility rate structures on the electricity consump-
    tion of residential buildings.                                                                                           load            load                                   load

    Proposed Methodology                                                                                     Jena Rules                 Ontology                           XML Data File

    Figure 2 is the proposed architectural schematic for a                                      Figure 3: Schematic for ontologies visiting data models.
    combined semantic modeling and machine learning ap-
    proach to building energy monitoring. The semantic mod-
    eling and machine learning blocks and their interactions                                  The ontologies and rules are implemented in Jena
    serve the following purposes:                                                             (Apache Jena: 2016), and the data models in Java. The
                                                                                              right-hand side (c) of Figure 2 deals with data sources
    Block (a). On the semantic modeling side of the problem,                                  and models across the participating domains (e.g., build-
    data, ontologies and rules are placed on an equal footing                                 ing occupant, utility, weather, building architecture, fault
    and are developed for a multiplicity of domains. The goal                                 detection and diagnostics). The semantic graph models
    is to keep the ontologies small and use object property                                   will be populated with individuals (i.e., instances of real-
    relationships and rules to link sources of data needed for                                world data) by visiting (a mechanism software design pat-
    multi-domain reasoning. A key benefit in co-developing                                     tern: see Figure 3) the relevant data models and gathering
    the data models with ontologies and rules for a domain                                    the data and object properties relevant to the application
    is that it represents domain knowledge and supports rule-                                 at hand. For example, the occupant emulator will provide

© 2018 ASHRAE (www.ashrae.org) and IBPSA-USA (www.ibpsa.us).                                                                           669
For personal use only. Additional reproduction, distribution, or transmission in either print or digital form is not permitted without
ASHRAE or IBPSA-USA's prior written permission.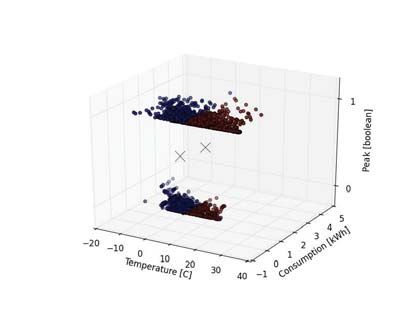
data to the Occupant ontology; the weather server and data           data was collected from an online server (WeatherAPI )
    model will add instances to the Weather ontology.                    and stored in Weather ontology. The utility ontology em-
                                                                         ploys temporal concepts such as time interval and time in-
    Block (b). The second purpose of semantic modeling is                stant (Petnga L. and Austin M.A. 2013) to represent util-
    to provide support for the executable processing of events           ity tariff scheduling. In this ontology, a season is a con-
    associated with features of the building domain and en-              cept that begins and ends with time instants and may have
    ergy consumption. As illustrated in the center and left-             one or more sub-intervals associated with the tiered rates;
    hand sides of Figure 2, the domain ontologies and rules              e.g., on-peak, off-peak, and mid-peak rates. At any point
    (e.g., Weather.owl and Weather.rules; Utility.owl and Util-          in time, temporal reasoning procedures are capable of de-
    ity.rules) are loaded into the semantic model and gen-               termining whether or not a peak interval is in effect, and
    eral purpose reasoner. Semantic graph representations                identifying the associated rate for that season and time of
    can listen (Listener software design pattern) for incoming           the day.
    events – this, in turn, triggers the execution of rules and, if
    needed, transformation of the semantic graph. The result             Jena Rules for Domain Ontologies. The occupancy
    is semantic graphs that dynamically adapt to the conse-              schedule is defined as an inference rule in KRR shown in
    quences of incoming data and events.                                 Figure 6. This example shows how the knowledge about
    Block (c). This study uses K-means cluster analysis and              the occupants’ presence during a weekday can be derived
    the nearest neighboring algorithm on residential build-              from temporal reasoning and semantic facts, i.e., time of
    ing data to classify and predict building electricity energy         day and the calendar (weekday, weekend, holiday). In
    consumption. Our prototype software uses TensorFlow                  this setting, the semantic terms such as holiday and week-
    (Abadi M., Barham P., et al. 2016), an open source Python            end are used in the occupancy schedule inference rule, the
    library, for machine learning purposes. We employ JPype              values of which are computed from Jena boolean built-in
    (JPype 2018) to integrate Apache Jena (Java) (Apache                 functions named isWeekend() and isHoliday(). Figures 7
    Jena: 2016) with TensorFlow (Python). It is important to             and 8 represent sample Jena rules associated with weather
    note that this framework allows us to use semantic infor-            and utility ontologies, respectively. The former presents
    mation as features in learning algorithms (e.g., the results         a semantic rule for the identification of a frost (i.e., ob-
    of the knowledge inference such as the category of utility           served temperature is below 0 °C) condition. In the latter,
    rate On-Peak, Off-Peak, or the occupancy schedule).                  UtilityRule01 identifies the season that “time-of-the-use”
                                                                         belongs to and UtilityRule02, identifies if that time-of-use
    Data flows among blocks (a)-(b)-(c). Interactions be-                 belongs to the on-peak tier.
    tween the blocks for semantic model representation, ex-
    ecutable processing, and machine learning are defined by              Results
    two streams of data: (1) the machine learning block uses
    the inference results in the ontologies, and (2) results from        Figure 9 shows the distribution of actual, obtained from
    machine learning techniques are fed back into the ontol-             utility provider, hourly consumption target values com-
    goies for further inferencing.                                       pared with predicted values. As shown in the graph, the
                                                                         shape of the predicted distribution is similar to the ac-
    Case Study Problems
                                                                         tual distribution. Figure 11 shows results of the classi-
    Problem Description. The case study exercises a subset               fication analysis using the k-nearest neighbor algorithm
    of the vision described by Figure 2, and involves a cou-             to predict electricity consumption. The features for this
    pling of semantic modeling and reasoning, and machine                analysis were based on outdoor temperature, solar radia-
    learning for the weather, utility, and occupant domains.             tion, and wind speed from raw data, and occupancy ob-
    This case problem uses hourly data on electricity usage              tained from KRR. The algorithm used 90 % of annual
    (obtained from the utility company in 2016) for one bed-             electricity for training and 10 % for testing and k = 4. The
    room residential buildings located in Maryland for a four-           training set is composed of 700 data points and with the
    month winter utility season (January 1 through April 30)             batch size of 100, 7 mean square errors (MSE) were com-
    and one month of the summer utility (May 1 through May               puted as 0.033, 0.041, 0.054, 0.036, 0.021, 0.027, 0.021.
    31) season. Data is provided for the rate category, the              The predicted values are close to the actual values except
    weather condition (hot, cold), occupancy schedule, and               when predicting unusually high consumption, > 0.5 kWh.
    dew point.                                                           Overall, based on Figure 9 distribution, the data is mainly
                                                                         concentrated in the low energy consumption range, less
    Domain Ontologies. Figures 4 and 5 show fragments of                 than 0.2 kWh. This observation and the good prediction
    the classes, data and object properties in the Weather and           on low range results from Figure 11 suggest that the model
    Utility ontologies. Current and future forecast weather              works well for these data in the study.

© 2018 ASHRAE (www.ashrae.org) and IBPSA-USA (www.ibpsa.us).                                                                           670
For personal use only. Additional reproduction, distribution, or transmission in either print or digital form is not permitted without
ASHRAE or IBPSA-USA's prior written permission.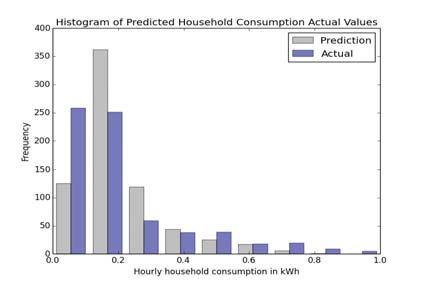
Figure 4: Partial view of weather ontology classes and properties (Source: Adapted from Staroch (Staroch P. 2013;
    Delgoshaei P. 2017)).

                                     Figure 5: Schematic of utility ontology (Delgoshaei P. 2017).

© 2018 ASHRAE (www.ashrae.org) and IBPSA-USA (www.ibpsa.us).                                                                           671
For personal use only. Additional reproduction, distribution, or transmission in either print or digital form is not permitted without
ASHRAE or IBPSA-USA's prior written permission.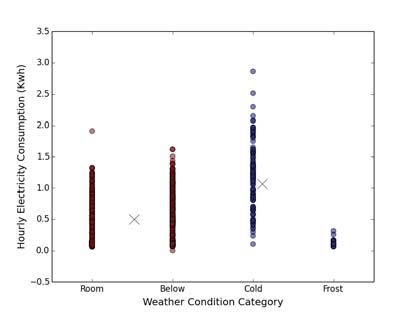
Jena Rules

    [weekDayVacant: (?z rdf:type bld:Zone)(?z bld:hasSchedule ?sc) equal(?sc,"Schedule1")
                    (?td rdf:type te:TOU) isWeekend(?td,?w) isHoliday(?td,?h)
                    notEqual(?w,"false"ˆˆxs:boolean ) notEqual(?h,"false"ˆˆxs:boolean)
                    (?td te:hasTimeValue ?time) le("16:59:59"ˆˆxs:time,?time)
                    ge("06:59:59"ˆˆxs:time,?time)->(?s bld:isOccupied "false"ˆˆxs:boolean)]}

               Figure 6: A Jena rule to detect schedule of occupancy during weekdays that do not fall on a holiday.

             Jena Rules

    [WeatherRule01: (?t rdf:type we:Temperature) (?t we:hasTemperatureValue ?tv)
                   lessThan(?tv,0) -> (?t rdf:type we:Frost)
                   (?t, we:isCondition, "true"ˆˆxs:boolean) print(?tv,’FrostCondition’)]

                          Figure 7: A Jena rule for weather ontology to detect frost (Delgoshaei P. 2017).

             Jena Rules

    [ UtilityRule01: (?interval rdf:type te:Season) (?interval te:endsAt ?end)
                     (?interval te:beginsAt ?begin) (?t rdf:type te:TOU) (?t te:hasTime ?time) lessThan(?begin,?time)
                     lessThan(?begin,?end) greaterThan(?end,?time) -> (?t te:isInInterval ?interval) ]

    [ UtilityRule02: (?t te:isInHourInterval ?interval) (?interval te:isPeak ?peak) -> (?t te:onPeak ?peak) ]

           Figure 8: Jena rules for the utility ontology to identify the season and the tiered rates(Delgoshaei P. 2017).

    Figure 10 is a plot of clustering analysis on energy con-            semantic rules defined in Figure 8. This study considers
    sumption based on inferred weather condition obtained                two clusters to represent conditions during cold and shoul-
    from KRR side. The main categories of the weather con-               der seasons. The consumption during the peak hours in
    dition are: Room, Below Room, Cold and Frost. These                  summer is not as well correlated with outdoor air temper-
    conditions are inferred based on the semantic rules de-              ature. This reflects the setpoint reset during unoccupied
    picted in Figure 7. The data represents the electricity con-         hours. However, during the off peak, occupied hours in
    sumption for the heating and the shoulder season, from               winter, heating is correlated with the outdoor air temper-
    January to May. The clusters also confirm the energy con-             ature. Overall, the results of this figure suggesting that
    sumption as a function of weather conditions belong two              during (1) occupied, extreme weather conditions, there is
    these seasons. The red cluster containing the Room and               a linear correlation between consumption and outdoor air
    Below conditions represents the shoulder season and the              temperature and (2) during moderate weather conditions,
    blue cluster represents the heating season. The centroids,           the energy consumption has little correlation with outdoor
    the dataset average, are marked by “x” representing each             temperature and occupant behavior.
    cluster. The results show that the two clusters confirm the
    expected seasons of heating and shoulder seasons. Also,              Discussion
    the heating cluster has a higher average consumption than
                                                                         A recent study (BAS 2018) indicates that the market for
    the shoulder season. This is a potentially useful insight
                                                                         building automation system installation is expected to ex-
    for utility companies on how to structure their electricity
                                                                         pand at 4.6 percent annual growth from 2016 through
    tariffs (two vs. three seasons) based on semantic labels
                                                                         2022. This trend is driven in part by the belief that en-
    (i.e., frost condition associated with the heating season)
                                                                         ergy efficiency of buildings can be improved through the
    rather than temperature numeric values.
                                                                         use of data/information working alongside technologies
    Figure 12 shows results of the cluster analysis for electric-        for AI, big data management and cloud platforms. Imple-
    ity consumption and its relationship to outdoor air tem-             mentation of this prototype requires considerations when
    perature and tiered utility rate (1 represents on-peak and 0         integrating ML techniques with KRR models. The spe-
    represents off-peak). The tiered rates were obtained from            cific areas include: data exchange and synchronization

© 2018 ASHRAE (www.ashrae.org) and IBPSA-USA (www.ibpsa.us).                                                                           672
For personal use only. Additional reproduction, distribution, or transmission in either print or digital form is not permitted without
ASHRAE or IBPSA-USA's prior written permission.
Figure 11: Predicted values and actual target values of
Figure 9: Distribution of predicted and actual energy con- energy consumption based on occupancy and weather
sumption test data for k-NN (k=4). conditions.
Figure 10: Hourly energy consumption as a function of Figure 12: Cluster analysis for hourly electricity con-
weather condition category. sumption based on outdoor air temperature and utility
category.
© 2018 ASHRAE (www.ashrae.org) and IBPSA-USA (www.ibpsa.us). 673
For personal use only. Additional reproduction, distribution, or transmission in either print or digital form is not permitted without
ASHRAE or IBPSA-USA's prior written permission.of results between ML and KRR models, and handling ulated Energy Use for LEED Certified U.S. Office
the difference in processing time in the semantic domain Buildings.” Energy and Buildings 85:86 – 97.
(slow) and the ML algorithms (fast). This study demon- Jiron, 2018. Jiron A., Buldings and the Grid: Helping
strates how collection of data-ontology-rules can be used Commercial Buildings Get Smarter: For details,
to represent and reason with data from multiple domains see: https://www.energy.gov/eere/buildings/articles/
and provide essential semantic knowledge to the learning buildings-and-grid-helping-commercial-buildings-
algorithms. get-smarter, February, 2018.
Conclusion JPype. 2018. Bridging the Worlds of Python and Java.
This paper describes an approach to monitor building en- For details, see http://jpype.sourceforge.net.
ergy consumptions by integrating machine learning tech- Lee E.A. 2003. Model-Driven Development – From
niques with mechanisms for semantic knowledge repre- Object-Oriented Design to Actor-Oriented Design,
sentation and reasoning. This work implements a super- Presentation at Workshop for Software Engineering
vised learning algorithm, nearest neighbor, to predict the for Embedded Systems, From Requirements to Im-
electricity consumption based on raw data such as solar plementation, Chicago,.
radiation, outdoor temperature, and wind speed, as well Liu X., Li Z. and Jiang S. 2016. “Ontology-Based Rep-
as knowledge data such as occupancy inferred by seman- resentation and Reasoning in Building Construction
tic rules. We also integrated the semantic knowledge in Cost Estimation in China.” Future Internet 8, no. 3.
weather conditions (i.e., frost, above room temperature,
below room temperature) integrated to K-means cluster- Miller C., Nagy Z. and Schlueter A. 2018. “A Review
ing algorithm to identify the electricity consumption sea- of Unsupervised Statistical Learning and Visual An-
sons (i.e., heating, shoulder, cooling). Our long-term vi- alytics Techniques Applied to Performance Analysis
sion is that this framework will be used to couple semantic of Non-Residential Buildings.” Renewable and Sus-
and machine learning techniques for buildings-to-grid in- tainable Energy Reviews 81:1365 – 1377.
tegration. Petnga L. and Austin M.A. 2013. “Ontologies of Time
and Time-based Reasoning for MBSE of Cyber-
Acknowledgement Physical Systems.” Procedia Computer Science
The authors would like to acknowledge National Research 16:403 – 412. Conference on Systems Engineering
Council Research Associates Program as a funding source Research (CSER 2013).
for Parastoo Delgoshaei. Staroch P. 2013. A Weather Ontology for Predictive
References Control in Smart Homes. M.S. Thesis in Software
Abadi M., Barham P., et al. 2016. “TensorFlow: A Sys- Engineering and Internet Computing, Vienna Uni-
versity of Technology.
tem for Large-Scale Machine Learning.”
Valgaev O. and Kupzog F. 2016. “Building Power
Apache Jena:. 2016. An Open Source Java framework
Demand Forecasting Using K-Nearest Neighbors
for building Semantic Web and Linked Data Appli-
Model - Initial Approach .” pp. 1055 – 1060. 2016
cations. For details, see https://jena.apache.org/.
IEEE PES Asia-Pacific Power and Energy Confer-
BAS. 2018. BAS Automation Systems. For details, see ence - Xi’an - China.
https://internetofbusiness.com/ demand-building- WeatherAPI. Online Open Weather API. See
automation-systems-continues-rise-says-study/. https://openweathermap.org/api (Accessed Septem-
Delgoshaei P. 2017. “Semantic Models and Rea- ber 14, 2017).
soning for Building System Operations: Focus on
Knowledge-Based Control and Fault Detection for Nomenclature
HVAC.” Ph.D. diss. in Civil Engineering, Univer- AI Artificial Intelliegence
sity of Maryland, College Park, MD. BAS Building Automation Systems
OW L Web Ontology Language
EERE. 2018. Buildings and Grid helping Com-
FDD Fault Detection and Diagnostics
mercial Buildings get Smarter, For details, see
KRR Knowledge Representation and Rea-
https://energy.gov/eere/buildings/articles/ buildings-
soning
and-grid-helping-commercial-buildings-get-smarter.
ML Machine Learning
EIA. See https://www.eia.gov/tools/faqs/, 2016. WWW World Wide Web
Heidarinejad, M., Dahlhausen, M., McMahon, S., Pyke, SW RL Semantic Web Rule Language
C. and Srebric, J. 2014. “Cluster Analysis of Sim- T OU Time of Use
© 2018 ASHRAE (www.ashrae.org) and IBPSA-USA (www.ibpsa.us). 674
For personal use only. Additional reproduction, distribution, or transmission in either print or digital form is not permitted without
ASHRAE or IBPSA-USA's prior written permission.You can also read