E-Commerce in Russia 2018 - datainsight.ru

Page created by Susan Harrison
 
CONTINUE READING
E-Commerce in Russia 2018 - datainsight.ru
E-Commerce in Russia 2018
datainsight.ru
E-Commerce in Russia 2018 - datainsight.ru
Research partners   2
E-Commerce in Russia 2018 - datainsight.ru
Report structure                                                    3

1   Global e-commerce           4    8    Mobile shopping      50

2   Online audience in Russia   14   9    Product categories   55

3   Russian B2C market          19   10   Online stores        61

4   Russian C2C market          26
                                     11   Social media sales   67
5   Online retail import        33
                                          Online shoppers
                                     12   in Russia            72
6   Online retail export        38
    E-commerce                            Data sources
7   logistics                   44   13   and methodology      77
E-Commerce in Russia 2018 - datainsight.ru
1                                                    4

    Global e-commerce

    • key markets: overview
    • share of imported online purchases by region
    • Three categories of e-commerce
      markets globally
E-Commerce in Russia 2018 - datainsight.ru
1 Key markets: overview                                                                                                                                                                                   5

                                                                                                                                                                          China
         1 390                             54%
    Population in 2017,           Internet user penetration
       mln people                          in 2017
                                                                                                              $8,83                                                4,5%
                                                                                                          GDP per capita in 2017,                       The share of e-commerce in
                                                                                                              USD thousand                                     GDP in 2018

                                                                      Beijing
                                                                                                             $4 700                                                 $680
                                                                                                  End consumption by households*,                          The volume of the B2C e-
                                                                                                           2017, USD bln                                  commerce market in 2017

                                                                                                   E-commerce turnover includes services.
 26         Logistics Performance Index Rank,
            2018                                                                                   The Logistics Performance Index measures the efficiency of logistics and logistics infrastructure in
                                                                                                   various countries.

 78         Ease of Doing Business Index Rank,
            2018
                                                                                                   The Ease of Doing Business Index assesses the complexity of the country's regulatory
                                                                                                   environment and its convenience for starting and/or operating a business.

 * households and non-profit institutions servicing households
 Source: The World Bank, 2018; International Telecommunication Union (ITU), 2018; Ecommerce Foundation, country profiles, 2018
E-Commerce in Russia 2018 - datainsight.ru
1 Key markets: overview                                                                                                                                                                                   6

                                                                                                                                                                                   USA
          330                              76%
    Population in 2017,           Internet user penetration
       mln people                          in 2016
                                                                                                              $59,5                                                2,6%
                                                                                                          GDP per capita in 2017,                       The share of e-commerce in
                                                                                                             USD thousands                                     GDP in 2018

                                                                                                           $12 800                                                  $440
                                                                          Washington              End consumption by households*,                          The volume of the B2C e-
                                                                                                           2016, USD bln                                  commerce market in 2017,
                                                                                                                                                                   USD bln

                                                                                                   E-commerce turnover includes services.
 14         Logistics Performance Index Rank,
            2018                                                                                   The Logistics Performance Index measures the efficiency of logistics and logistics infrastructure in
                                                                                                   various countries.

 6          Ease of Doing Business Index Rank,
            2018
                                                                                                   The Ease of Doing Business Index assesses the complexity of the country's regulatory
                                                                                                   environment and its convenience for starting and/or operating a business.

 * households and non-profit institutions servicing households
 Source: The World Bank, 2018; International Telecommunication Union (ITU), 2018; Ecommerce Foundation, country profiles, 2018
E-Commerce in Russia 2018 - datainsight.ru
1 Key markets: overview                                                                                                                                                                                   7

                                                                                                                             Great Britain
           66                              95%
    Population in 2017,           Internet user penetration
       mln people                          in 2016
                                                                                                              $39,7                                                 7,9%
                                                                                                          GDP per capita in 2017,                       The share of e-commerce in
                                                                                                             USD thousands                                     GDP in 2017

                                                                                                             $1 700                                                 $220
                                                                                                  End consumption by households*,                          The volume of the B2C e-
                                                                                                           2017, USD bln                                  commerce market in 2017,
                                                                                                                                                                   USD bln

                                                                                                   E-commerce turnover includes services.
  9         Logistics Performance Index Rank,
            2018
                                                                 London                            The Logistics Performance Index measures the efficiency of logistics and logistics infrastructure in
                                                                                                   various countries.

  7         Ease of Doing Business Index Rank,
            2018
                                                                                                   The Ease of Doing Business Index assesses the complexity of the country's regulatory
                                                                                                   environment and its convenience for starting and/or operating a business.

 * households and non-profit institutions servicing households
 Source: The World Bank, 2018; International Telecommunication Union (ITU), 2018; Ecommerce Foundation, country profiles, 2018
E-Commerce in Russia 2018 - datainsight.ru
1 Key markets: overview                                                                                                                                                                                   8

                                                                                                                                                              Germany
           83                              84%
    Population in 2017,           Internet user penetration
       mln people                          in 2017
                                                                                                              $44,5                                                3,1%
                                                                                                          GDP per capita in 2017,                       The share of e-commerce in
                                                                                                             USD thousands                                     GDP in 2018
                                                                    Berlin

                                                                                                             $1 950                                                $82,5
                                                                                                  End consumption by households*,                          The volume of the B2C e-
                                                                                                           2017, USD bln                                  commerce market in 2017,
                                                                                                                                                                   USD bln

                                                                                                   E-commerce turnover includes services.
  1         Logistics Performance Index Rank,
            2018                                                                                   The Logistics Performance Index measures the efficiency of logistics and logistics infrastructure in
                                                                                                   various countries.

 20         Ease of Doing Business Index Rank,
            2018
                                                                                                   The Ease of Doing Business Index assesses the complexity of the country's regulatory
                                                                                                   environment and its convenience for starting and/or operating a business.

 * households and non-profit institutions servicing households
 Source: The World Bank, 2018; International Telecommunication Union (ITU), 2018; Ecommerce Foundation, country profiles, 2018
E-Commerce in Russia 2018 - datainsight.ru
1 Key markets: overview                                                                                                                                                                                   9

                                                                                                                                                                           India
         1 340                             30%
    Population in 2017,           Internet user penetration
       mln people                          in 2016
                                                                                                                  $1,9                                                1%
                                                                                                          GDP per capita in 2017,                       The share of e-commerce in
                                                                                                             USD thousands                                     GDP in 2018
                              New Delhi

                                                                                                             $1 500                                                $37,6
                                                                                                  End consumption by households*,                          The volume of the B2C e-
                                                                                                           2017, USD bln                                  commerce market in 2017,
                                                                                                                                                                   USD bln

                                                                                                   E-commerce turnover includes services.
 44         Logistics Performance Index Rank,
            2018                                                                                   The Logistics Performance Index measures the efficiency of logistics and logistics infrastructure in
                                                                                                   various countries.

 100        Ease of Doing Business Index Rank,
            2018
                                                                                                   The Ease of Doing Business Index assesses the complexity of the country's regulatory
                                                                                                   environment and its convenience for starting and/or operating a business.

 * households and non-profit institutions servicing households
 Source: The World Bank, 2018; International Telecommunication Union (ITU), 2018; Ecommerce Foundation, country profiles, 2018
E-Commerce in Russia 2018 - datainsight.ru
1 Key markets: overview                                                                                                                                                                                   10

                                                                                             Russia
          144                              76%
    Population in 2017,           Internet user penetration
       mln people                          in 2017
                                                                                                               $10,7                                               2,5%
                                                                                                          GDP per capita in 2017,                       The share of e-commerce in
                                                                                                             USD thousands                                     GDP in 2018

                                                                                                                $800                                               $32,5
                                                                                                  End consumption by households*,                          The volume of the B2C e-
                                                                                                           2017, USD bln                                  commerce market in 2017,
                                                                                                                                                                   USD bln
    Moscow
                                                                                                   E-commerce turnover includes services (unlike on slide 19). The value of $32,5 billion is used for
                                                                                                   comparison with other countries.
 75         Logistics Performance Index Rank,
            2018                                                                                   The Logistics Performance Index measures the efficiency of logistics and logistics infrastructure in
                                                                                                   various countries.

 35         Ease of Doing Business Index Rank,
            2018
                                                                                                   The Ease of Doing Business Index assesses the complexity of the country's regulatory
                                                                                                   environment and its convenience for starting and/or operating a business.

 * households and non-profit institutions servicing households
 Source: The World Bank, 2018; International Telecommunication Union (ITU), 2018; Ecommerce Foundation, country profiles, 2018
1 Key markets: overview                                                                                                                                                                                   11

                                                                                                                                                             Brazil
          209                              61%
    Population in 2017,           Internet user penetration
       mln people                          in 2016
                                                                                                                 $9,8                                                 1%
                                                                                                          GDP per capita in 2017,                       The share of e-commerce in
                                                                                                             USD thousands                                     GDP in 2017

                                                                                                             $1 300                                                $15,8
                                                                                                  End consumption by households*,                          The volume of the B2C e-
                                                                 Brasilia
                                                                                                           2017, USD bln                                  commerce market in 2017,
                                                                                                                                                                   USD bln

                                                                                                   E-commerce turnover includes services.
 56         Logistics Performance Index Rank,
            2018                                                                                   The Logistics Performance Index measures the efficiency of logistics and logistics infrastructure in
                                                                                                   various countries.

 125        Ease of Doing Business Index Rank,
            2018
                                                                                                   The Ease of Doing Business Index assesses the complexity of the country's regulatory
                                                                                                   environment and its convenience for starting and/or operating a business.

 * households and non-profit institutions servicing households
 Source: The World Bank, 2018; International Telecommunication Union (ITU), 2018; Ecommerce Foundation, country profiles, 2018
1 Share of imported online purchases by region                                                                     12

                                                                           43%

                                                                                       21%
                                                      15% 50%
                            14%
                                                                           Eastern
                                                                           Europe      Asia
                                                      Western             and Russia
                            North            44%      Europe
                           America                                                              35%

                                                            Africa and
                                                            Middle East

                                             South
                                            America                                    Australia and New Zealand

 Source: KPMG, Global Online Consumer Report, 2017
1 Three categories of e-commerce                                                                                                                                          13

  markets globally
  Russia is viewed as a market that foreign brands show
  interest in. However, most global companies factor in their
  size, infrastructure level and political situation when they
  consider entering such markets.

         Top-tier markets
         These markets are large or mature enough to attract substantial
         investment in e-commerce or relatively easy to maintain due to
         the existing infrastructure.

                                                                                                    Wait-and-see markets
         Second-wave markets
                                                                                                    Brands show interest in these markets as well, but their size,
         Many international brands monitor these markets
                                                                                                    infrastructure level or political factors delay the entry of online
         , but they rarely become the first launch sites.
                                                                                                    stores.

 Source: Global Ecommerce Markets Will Reach $4 Trillion By 2020. Are You In?, Shopify Plus, 2016
2                                                      14

    Online audience
    in Russia

    • Russian online audience: size and preferences
    • user age and preferred devices
    • average time online per user (minutes per day)
2         Russian online audience:                                                                                                                                                        15

          size and preferences
                                                                                                            Monthly online audience
                                                                                                                                                             +3% (annually)
                                                                                                                 90 MLN PEOPLE
                                                                                                                                                     SMART TV

                                                                                                                                  12%
                                    of the population, 12+
                                                                                                                                   +20%                                         DESKTOP

                                                                                                                                                                       51%
                                                                                                          61%                                                           -2%
                                                                                                           +9%

                     86% users go online every day
                                                                                                                             Offline
                                                                                                                    26% -9% (annually)
    Russia 0+, 12+, Monthly reach, million people, percent of population, April 2018 – September 2018, gain in April 2018 – September 2018 versus April 2017 – September 2017
    Source: Mediascope: Аудитория интернета, 2018 (Online Audience, 2018)
2         Russian online audience:                                                                                                                                       16

          size and preferences
                                 MOBILE ONLY                                                                                          DESKTOP ONLY
                                                                                          VS

                18%                                    24%                                                               13%                          18%
             of the population                            of users                                                    of the population               of users

       21,6 MLN PEOPLE                                 +20% (annually)
                                                                                                                      16 MLN PEOPLE                   - 20% (annually)

    Russia 0+, Monthly reach, all 12+, September 2017 – February 2018, gain in September 2017 – February 2018 versus September 2016 – February 2017
    Source: Mediascope: Аудитория интернета, 2018 (Online Audience, 2018)
2         User age and preferred devices                                                                                                                     17

    18 млн.чел.

    16 млн.чел.                                                                                                                        Offline

                                                                                                                                       Desktop&Mobile
    14 млн.чел.

                                                                                                                                       Mobile only
    12 млн.чел.
                                                                                                                                       Desktop only
    10 млн.чел.

     8 млн.чел.

     6 млн.чел.

     4 млн.чел.

     2 млн.чел.

     0 млн.чел.
                  12      17        22        27         32        37        42        47         52        57     62   67   72   77   82        87     92

    Russia 0+, Monthly reach, moving average for 6 years, starting from 12 years, September 2017 – February 2018
    Source: Mediascope: Аудитория интернета, 2018 (Online Audience, 2018)
2         Average time online                                                                                                                  18

          per user (minutes per day)

                                                                                                Desktop Web
                                                                                                  100 min
                                                      Mobile Web
                                                       24 min

                                                      Mobile Apps
                                                        98 min

    Russia 100k+, 12–64, average minutes per day online, net of time spent in "offline" themed groups in mobile applications, September 2018
    Source: Mediascope: Аудитория интернета, 2018 (Online Audience, 2018)
3                                                19

    B2C market
    in Russia

    • online B2C in Russia, 2018
    • e-commerce market growth drivers

    • online sales in Russia, 2011–2018
    • e-commerce in Russia, 2019–2023 forecast

    • growth drivers
    • 10 characteristics of the Russian market
3         Online B2C in Russia, 2018                                                                20

    E-commerce (B2C commerce) implies the purchase of tangible goods
    from a legal entity online, also via mobile applications, social media and
    messengers, where the purchase is a reservation, delivery order,
    payment, receipt via an ODP or postal ATM. The estimates include
    purchases of tangible goods and do not include: services, meals, tickets
    and hotels, in-app game purchases, event tickets, cross-border
                                                                                                *
    purchases.
                                                                                 RUB trillion
                                                                                  REVENUE
                                                                                    +19%
                                                                                  growth, RUB
         290 mln                        RUB 3 970
           orders (+18%)*                   average check (-2%)*
    * forecast
    Source: Data Insight
3            E-commerce market                                                                                                                                                   21

             growth drivers
    1200                                                                                                                           40%
                                                                                                                      1150
    1100                   34%                                35%
                                                                                                                                   35%
    1000          31%                        32%                                                      965
     900                                                                                                                           30%          E-commerce growth
                                                                                      805
     800          28%      28%                                                        23%                                          25%
                                                                                                                                                is accounted for by the number of
                                             25%                     650                               21%            21%
     700                                                                                                                                        orders, but not the average check,
                                                              560                                                                  20%
     600                                                              16%             20%              20%            19%                       which has been shrinking for 2
     500                                                                                                                           15%
                                             415               16%                                                                              years in a row. The number
     400
                           315
     300          235                                                 7%                                                           10%           of new customers
                           5%                 5%
     200
                 2,5%                                                7,3%                                                          5%           and orders per customer
                                                                                      1,8%
     100                                                                                                                                         is also growing.
                                                                                                            -1%       -2,0%        0%
       0

    -100                                                                                                                           -5%
                  2011     2012               2013            2014    2015            2016             2017           2018*

           Online sales           The increase of the volume sales   The increase in the number of orders         The increase of the average check

    * forecast
    Source: Data Insight
3         Online sales in Russia,                                                                                22

          2011–2018
                                 RUB (BLN)                              USD (BLN)
                                                                VS

       1150                                                     2018*                                       18

                    965                                         2017                                   17

                           800                                  2016                  12

                                  650                           2015           10,6

                                        560                     2014                            14,5

                                              415               2013                       13

                                                    315         2012          10

                                                          235   2011    8

    * forecast
    Source: Data Insight
3             E-commerce in Russia,                                                                                                      23

              2019–2023 (forecast)
    Bln rub
                                                                                  2400
    2400                                                                                  25%
                                          Online sale
    2200                                                                  2100
                 23%                      Online sales growth
    2000
                                                                  1830                          The e-commerce market growth rate
                           21%                                                            20%
    1800                                                                                        picks up each year: 5 years ago it was
                                  19%                    1580
    1600                                    18%                                                 growing by RUB 100 bln p.a.
                                            1350         17%
    1400                                                          16%                     15%    versus RUB 185 bln in 2018.
                                                                          15%
    1200                          1150                                            14%           If the current trends persist, by 2023
    1000
                           965                                                                  the market will more than double
                                                                                          10%
                 800                                                                             reaching RUB 2,4 trillion, with +16%
     800
                                                                                                average annual growth rate (2019–
     600
                                                                                          5%    2023).
     400

     200

       0                                                                                  0%
                 2016      2017   2018*     2019*         2020*   2021*   2022*   2023*

    * forecast
    Source: Data Insight
3         Growth drivers                                                                            24

                           NEW USERS          FREQUENCY
                                                                A growing number of online
                                                                shoppers are becoming more
                                                                experienced Internet users.
                                                                Second-time online buyers tend to
                                                                shop
                                                                online more often and enter other
                                                                product categories.

                                 EXPERIENCE    LOGISTICS

                                                 LOYALTY CARD
                                                    CRM

    Source: Data Insight
3         10 characteristics of the Russian market                                                                    25

                           Geography (long distances)                            Weak players

       1. Hyperconcentration of retailers in Moscow       5. Disadvantaged position of international players on the
       2. Share of orders from big cities remains            Russian market...
          disproportionately large                        6. ... yet a high proportion of cross-border purchases
                                                          7. A specific (local) set of marketing channels
                                                          8. Fragmented e-commerce market

                              Poor infrastructure                  Spoiled customers (pay-later deals)

        3. Fragmented logistics infrastructure            9. High customer expectations regarding the delivery
        4. A large share of pickup from stores and ODPs      times

                                                          10. Payment upon receipt prevails

    Source: Data Insight
4                                                   26

    C2C market
    in Russia

    • online C2C in Russia, 2017
    • the role that Internet plays in C2C sales
    • share of S2C sellers: penetration geography
    • C2C product categories and seller analysis
    • 7 characteristics of the Russian
      C2C market
4         Online C2C in Russia, 2017                                                                                                                 27

    C2C commerce is understood as the purchases of new or used tangible
    goods, exclusive of motor vehicles and real estate, by individuals from
    other individuals over the Internet.

    We estimate that 8 million sellers and 10 million buyers are engaged in
    С2С commerce in Russia.

                                                                                                                                            RUB bn
                                                                                                                                           REVENUE
       90 mln                                           RUB 3 250
                   sales                                           average check

    Source: Data Insight for Avito, Online C2C in Russia: Trading between Private Individuals over the Internet, 2017 datainsight.ru/c2c-2017
4         Role that Internet plays in C2C sales                                                                                                                                              28

    On average, online sales account for                                                                   Only 6% engaged in active selling (to new customers rather
    87% of transactions made by individual sellers who                                                     than old customers or acquaintances) offline.
    participated in our surveys.
    Three out of four sellers rely on the Internet as a sole sales
    channel.                                                                                                                                      Share of sellers
                                                                                                           80%            76%
               3%         8%                                       Share of sales

                                                                                                           60%
               6%
                                                               100%             75% - 99%

          8%                                                                                               40%

                                                               50% - 74%        25% - 49%
                                                                                                           20%                                  17%
                                                                                                                                                                     5%             6%
                                             75%               > 25%                                        0%
                                                                                                                 Только через интернет Через родственников,   Повторные продажи   Активные
                                                                                                                                            знакомых           ранее покупавшим   продажи*

    *Also in a market (2%), via newspaper ads (2%), using leaflets and paper ads, in offices, in the street, on public transport (1%)
    Source: Data Insight for Avito, Online C2C in Russia: Trading between Private Individuals over the Internet, 2017 datainsight.ru/c2c-2017
4         Share of C2C sellers:                                                                                                                                                         29

          penetration geography
                    Private sellers' penetration in the population of big cities
                                                                                                               The penetration of individual sellers in the population of Moscow is
                      Moscow                                             12%
                                                                                                               lower than the average in most regional centers and is significantly
            Saint-Petersburg                                                             19%                   lower than in Saint Petersburg.
              Regional center                                                   14%                            Numbers of sellers in smaller municipalities is a fraction of those in
                 Another city                      4%
                                                                                                               big cities, but they are there and that matters.
               District center                3%

                  Countryside            2%

                                                                                                               Private sellers' penetration in the population of Federal Districts
    North-Western Federal District is the most advanced in terms of
    C2C commerce.
    It is ahead of most other macroregions (all but Volga and South
    Federal Districts) by more than 200%.                                                                                 16%                                4%
                                                                                                                  8%
                                                                                                                                      7%
                                                                                                                        12%
                                                                                                              11%                                7%
                                                                                                             4%

    Source: Data Insight for Avito, Online C2C in Russia: Trading between Private Individuals over the Internet, 2017 datainsight.ru/c2c-2017
4         C2C product categories                                                                                                                                         30

          and seller analysis

    80% of C2C sellers offer used items                                                                            Купленное для
                                                                                                                   перепродажи
                                                                                                                                   8%     Share of С2С sellers by the
                                                                                                                                           category of products sold
                                                                                                                     Антиквариат   10%

                                                                                                                       Хендмейд    10%
    Of these, 43% sell only used items only.
                                                                                                                       Животные     11%
    Only 8% of sellers offer new items bought specifically for
    resale; they account for 4% of all sales (about 300,000                                                        Неподошедшие
                                                                                                                                                38%
                                                                                                                       вещи
    transactions per month).
                                                                                                                             Б/у                                   80%

    An average seller trades in products in just above 1.5
    categories.

    Source: Data Insight for Avito, Online C2C in Russia: Trading between Private Individuals over the Internet,
    2017 datainsight.ru/c2c-2017
4         7 characteristics                                                                                                                                                               31

          of the Russian C2C market
                             SELLERS                                                                                                                      BUYERS

                                                                                           PRODUCTS

                                                                                                                                       Unique audience:
       Self-employment:                                                                                                                a third of C2C buyers never shop online.
       5% (more than 300 000 people) are
       professional sellers.
                                                                                                                                       Active buyers core:
       High concentration:                                                                                                             1 million most active buyers account for 47% of
       350 000 most active sellers account for                                                                                         C2C purchases.
                                                                          Diversification:
       40% of all sales.                                                  sales of used items are the highest, but
                                                                          37% of transactions are in other types of
       Hyperlocal market:                                                                                                              Huge audience with irregular buying patterns:
                                                                          goods (primarily new items found
       92% of sellers are active only within their                        unsuitable by customers)
       place of residence (town, city or region).                                                                                      10 million people made at least one C2C purchase
                                                                                                                                       online in 2017.

    Source: Data Insight for Avito, Online C2C in Russia: Trading between Private Individuals over the Internet, 2017 datainsight.ru/c2c-2017
5                                             33

    Online
    retail import

    • online retail import in Russia, 2018
    • cross-border vs. domestic shopping
    • overlapping audiences, 2018
    • spending trends on the Russian market
5         Online retail import                                                                         34

          in Russia, 2018
     Online retail import stands for purchases made in foreign online stores

                                                                                                   *
     operating in Russia (synonyms: cross-border, cross-border sales).
     The share of online retail import (in all online purchases) is the highest in
     medium-sized cities and small towns and in the countryside.

                                                                                      RUB bln
                                                                                     REVENUE
300 MLN**                                               RUB 1 160                     +29%
            orders (+34%)                                average check (-4%)
                                                                                     growth, RUB

    Source: Data Insight
    *Forecast
    **Multiple parcels within one cross-border order.
5            Cross-border vs. domestic shopping                                                                             35

                 Online orders, mln items               Online sales, RUB bln                     Online sales, USD bln

                                                                                          24,0
       560                                     1400
                                                                           +29%
       480                                     1200                                       20,0
                                                                                                                     +23%
                                                                                                          +31%
                                    +34%                         +16%
       400                                     1000
                                                                                          16,0
                                                       +45%
                           +51%                                                                  +34%
       320                                      800
                                                                                          12,0
                +80%
       240                                      600
                                                                           +19%                                      +7%
                                                                 +21%                      8,0            +39%
       160                                      400    +23%                                      +13%
                                    +18%
                           +19%
        80
                +20%                            200
                                                                                           4,0

         0                                        0                                        0,0
                2016       2017     2018               2016      2017      2018                  2016      2017      2018

                                            Domestic                       Cross-border

    Source: Data Insight
5         Overlapping audiences, 2018                                                                                                                              36

                                                                                                                       On which sites* have you shopped over the
    Consumers who only shop in Russian online                                                                                       last 12 months?
    stores and those who also shop in foreign                                                                25%

    stores are approximately equal in number.                                                                20%
                                                                                                                      21%
                                                                                                                                 19%
                                                                                                                                                   Only domestic
                                                                                                                                             15%
                                                                                                             15%
                                                                                                                                                   Only foreign
                                                                                                             10%

                                                                                                                                                   Both
                                                                                                              5%

                                                                                                              0%

    15% of consumers made purchases only on foreign websites.

    * Purchases in online stores and marketplaces are taken into account
    Source: Data Insight for PayPal, Russia's Online Economics: How People in Big, Medium-Sized Cities and Small Towns Buy, Sell and Pay Online,
    2018 – datainsight.ru/PaymentEvolution2018
5         Spending trends on the Russian market                                              37

                                                                Domestic
                                                               e-commerce

                                           Offline                            Offline food
                                          non-food                               retail
                                           retail*

                                                               Cross-border

    * exclusive of vehicles and gasoline sales
    The circle area is proportional to the turnover in 2017.
    Source: Data Insight
6                                      38

    Online
    retail export

    • online retail export
      in Russia, 2018
    • online retail export structure
    • geographic spread of orders
      in online export
    • product categories in online
      retail export
    • export shipments logistics
6         Online retail export                                                                                               39

          in Russia, 2018
    Online retail export stands for the purchases of goods in Russian online
    stores and from Russian individual entrepreneurs made from abroad.

                                                                                                                         *
      11,2 mln                                                     $67                                         RUB bln
                 shipments                                       average check

                                                                                                              REVENUE

    * Forecast
    USD 746 million based on the average annual rate as of December 1, 2018
    Source: Data Insight for eBay, Online Retail Export of Goods, 2018 – datainsight.ru/eBayCrossborder2018
6         Online retail export                                                                                                                               40

          structure

    About 4 million of all shipments will be ordered through                                                    Share of shipments by the source of orders
    marketplaces.
    7,2 million shipments will be ordered in online stores via
    websites, local offices, social media and other channels.
                                                                                                              36%
                                                                                                                                            Online stores
                                                                                                                     11,2
                                                                                                                     mn                     Marketplaces
                                                                                                                               64%

    Over the past 2 years, the share of medium-sized and small
    exporters who sell via marketplaces and deliver
    using postal operators increased from 15% of shipments in
    2016 to 36% of shipments forecasted for the end of 2018.

    Source: Data Insight for eBay, Online Retail Export of Goods, 2018 – datainsight.ru/eBayCrossborder2018
6         Geographic spread                                                                                                        41

          of orders in online export

                                                                                                              17% USA
                                                                      19%
                                                                                                              4.3% Germany

                                                                             13%                              3.6% Great Britain

                              60%                                         8%                                  1.9% Israel
                                                                                            Belarus

                                                                                            Kazakhstan
                              Europe
                              and                                                           Ukraine
                                                                                                              2.3% China
                              overseas

                                                                                                              2.3% France

                                                                                                              2.1% Canada

    Source: Data Insight for eBay, Online Retail Export of Goods, 2018 – datainsight.ru/eBayCrossborder2018
6         Product categories                                                                                                                                   42

          in online retail export

    Fashion remains the top category by the share of USD-                                                           Share of revenue denominated in USD
    denominated revenue.                                                                                      36%
    It is followed by home electronics and homeware & decor.

                                                                                                                    14%    14%
                                                                                                                                   10%
                                                                                                                                           6%      6%
                                                                                                                                                          4%

    Medical products account for 3% of revenue;
    food products account for 2%*.

    *forecast for 2018
    Source: Data Insight for eBay, Online Retail Export of Goods, 2018 – datainsight.ru/eBayCrossborder2018
6         Export shipments                                                                                                                           43

          logistics*
                                                                                                                        How the sellers ship**:

                                                                                                                        95% Russian Post
                                                                                         14%
                                                                                          of shipments
                                                                                                                        31% DHL
                                                                                          are serviced
                                                                                          by other
                                                                                          logistics
                                                                                          operators
                                                                                                                        29% DPD/SPSR
                         86%                                                                                            29% UPS
                         of shipments
                         by medium-sized and small
                         exporters are fulfilled                                                                        20% ship to the overseas
                         by Russian Post                                                                                partner/representative via
                                                                                                                        wholesale channels

    * Exclusive of shipments made by large online stores, as they use their own channels for international deliveries
    ** One seller may use multiple delivery options
    Source: Data Insight for eBay, Online Retail Export of Goods, 2018 – datainsight.ru/eBayCrossborder2018
7                                        44

    E-commerce
    logistics

    • online logistics in Russia, 2017
    • delivery: preferences and trends
    • delivery times on the Russian
      market, 2018
    • express delivery:
      relevant categories , 2018
7         Online logistics in Russia, 2017                                                                                                                45

    E-commerce logistics stands for the entire range of delivery
    options used to ship online purchases to the end buyer.
                                                                                      Three out of five online orders were delivered by third-
                                                                                                   party courier services in 2017

                                                                                                                    Russian Post
                                                                                               6%
    The key trend in 2017–2018
    is the growing share of pickup.                                                   28%
                                                                                                          34%       Third-party courier service

    This is mostly due to the increasing number                                                                     ODPs

    of pickup points and lower cost of their services,
                                                                                                                    Online stores' own delivery service
    i.e. better quality of pickup service as such.                                       13%
                                                                                                    21%
                                                                                                                    Postal ATMs

    Source: Data Insight, Logistics Services for Online Stores: Main Report, 2017 -
    logistics.datainsight.ru/osnovnoy-doklad-2017
7         Delivery: preferences and trends                                                                                                                        46

    ■       Moscow: courier delivery prevails                                                      ■       The last 2–3 years have seen a trend for the gradual
                                                                                                           levelling of preferences by city and region

    ■       St. Petersburg and other cities: pickup                                                ■       Outside of big cities: Russian Post

                                      expand                                                   reduce                               increase share

                           ODPs spread                                               delivery times                                  of postal ATMs

    Source: Data Insight, Logistics Services for Online Stores: Main Report, 2017 – logistics.datainsight.ru/osnovnoy-doklad-2017
7         Delivery times on the Russian market, 2018                                                                                                                                47

    11% of shipments are fast.                                                                     Average delivery time of the last purchase (days):
    Categories with the shortest delivery times
                                                                                                                           Books and CDs
    are food and medical products.
                                                                                                                           General stores
    Categories with the longest delivery times are books and CDs.
                                                                                                                    Apparel and footwear
                                                                                                                       Gifts and jewellery
                   11%                                                                                                Homeware and DIY
                                                                Longer delivery times (3+ days)                          Children’s goods
                                                                                                                       Hobbies and crafts
                                                                                                                        Home electronics
                                                                Medium delivery times
                                                                                                                               Cosmetics
                                                                                                                           Sporting goods
                                                 50%
                                                                                                                               Auto parts
                                                                Fast deliveries (within a few
                                                                                                          Pet food, supplies & accessories                   All delivery options
         39%                                                    hours)
                                                                                                                              Health care
                                                                                                                                    Food                     Courier delivery

                                                                                                                                    Total

                                                                                                                                             0   2   4   6        8         10

    Source: Data Insight for Dostavista, Express Delivery Market, 2018 – datainsight.ru/expressdelivery
7         Express delivery:                                                                                                                                               48

          relevant categories , 2018
                                                                                                                                    Examples:

                      Regular multi-item purchases                                        Regular single-item purchases             Home renovation doesn't
                                                                                          Pet food, supplies & accessories
                                                                                                                                    happen every day, but when it
                                                 Cosmetics                                                                          happens express deliveries may
                                                                                                                                    be requested more than once.
                                                                   Apparel and footwear
                                         Hobbies and crafts

                                                        Children’s goods                                         Home electronics   Animal feed, on the other hand,
                                                                                   Gifts and jewelry                                is needed regularly but lasts for a
                                                                                    Health care
                                         Homeware and renovation                                                    Auto parts
                                                                                                                                    long time.
                                                                                                                    Books and CDs
                                  Food         Sporting goods

                       Irregular multi-item purchases                                 Irregular single-item purchases

    Source: Data Insight for Dostavista, Express Delivery Market, 2018 – datainsight.ru/expressdelivery
8                                          50

    Mobile shopping

    • mobile shopping in Russia, 2017
    • mobile devices and users' age
    • multiple-device shopping journey
    • characteristics of mobile shopping
8         Mobile shopping in Russia, 2017                                                                                                              51

    We use the term mobile for any purchase made using a mobile phone, smartphone or
    tablet.
                                                                                                                            Desktop

    Order placement options
    at online stores:
                                                 Tablet
                                                                                                                                              Laptop

                           Smartphone
                                  Аpp
                                                                                      30,2%
             Smartphone
                   Web

                                                  8,9%                                                                                32,4%
                              12,3%
                 13,4%

    Source: Data Insight for PayPal, Mobile Channel in Retail: How the Users Do It, 2017 – datainsight.ru/DI-mobile-09-17
8         Mobile devices                                                                                                                                       52

          and users' age

    A smartphone is #1 device used for online shopping by young                        %
                                                                                      35
                                                                                                                             Shopping via apps
    people under 25.
                                                                                      30

                                                                                                                             Mobile shopping via websites
                                                                                      25

                                                                                      20

                                                                                      15
    The share of mobile purchases is also high in other social and
    age groups:                                                                       10

                                                                                       5

                  26%                                           26%                    0
                                                                                           18–20   21–24   25–29   30–34   35–39       40–44         45–54   55–64

              of users with                                   of small town
               5–10 years                                       (30–100k)
          of online experience                                   residents

    Source: Data Insight for PayPal, Mobile Channel in Retail: How the Users Do It,
    2017 – datainsight.ru/DI-mobile-09-17
8         Multiple-device shopping journey                                                                                                                             53

                              SMART PHONE                                                                              OTHER DEVICES
                                                                                          VS

    59%                                                                                                                                                49%
    Share of purchases                                                                                                           Share of purchases made
    made using                                                                                                    7%                        using multiple
    a smartphone                                                                                                                                  devices
    (at any stage)
                                         43%                                                                             44%
                                                                                 55%
                                                                                                     44%
                                                                                                                                       Single device

         Smartphone only                                                                                                               Multiple devices + smartphone

         Multiple devices                                                                                                              Multiple devices,
                                                                                                                                       no smartphone

    Source: Data Insight, Мобильный канал в ритейле. How the Users Do It, 2017 – datainsight.ru/DI-mobile-09-17
8         Characteristics of mobile shopping                                                                                                     54

                                 Smartphones                                                           Mobile shopping

        • Every fourth online purchase (27%) is made using                          • Mobile shopping comprises 2 separate domains:
          a smartphone*.                                                              purchases made via an app and a mobile browser.

        • Smartphones account for 53% of online                                     • The app shopping audience is more active, loyal, higher-
          purchases (though only for 11% as the single                                spending, highly convertible and dominated by several
          device).                                                                    sellers.

        • The use of smartphones for shopping primarily                             • Purchases made through the mobile browser
          depends on the consumers' age.                                              are characterized by low conversion and low average
                                                                                      check.
        • The reason why most mobile shoppers buy goods
          and services with their smartphone is the fact                            • Mobile shopping is deemed inconvenient by most
          that it is always at hand rather than convenience.                          consumers (31% said a smartphone was "convenient for
                                                                                      online shopping" versus 73% who chose the computer as a
                                                                                      more convenient device).

    * Figures on this slide and further are exclusive of the mobile-only audience
    Source: Data Insight
9                                                       55

    Product categories

    • product categories in Russia, 2017
    • product categories in TOP 1000 online stores by
      revenue share, 2017
    • number of orders by category throughout 2018
9         Product categories in Russia, 2017                                                                                              56

    We categorize a store based on the products that account for more than 75% of its sales. If no product category fits this
    definition, we refer to the store as general.

                                       Largest           Online sales,   Y-o-y growth in        Orders,   Y-o-y growth in      Average
        Category
                                        store                 RUB bn             2017, %     thousands            2017, %   check, RUB.

        Apparel, footwear
                                                                 167                 25         61,700                29         5,300
        and accessories

        General stores + home
        electronics                                              373                  7         50,800                15         9,200
        and appliances

        Building and homeware
                                                                   87                31          8,600                37        11,500

        Auto parts                                                 47                -6          8,500               -21           800

    Source: Data Insight, 2017
9         Product categories in TOP 1000 online stores                                                   57

          by revenue share, 2017
       Category                             Revenue share, %   Share of stores, %   Share of orders, %

        General stores
                                                         44                   22                   28
        + home electronics and appliances
        Apparel, footwear and accessories                20                   11                   33
        Building and homeware                            10                   11                    5
        Auto parts                                        5                    8                    5
        Books and CDs                                     3                    4                    6
        Sporting goods                                    3                    4                    2
        Children’s goods                                  3                    6                    5
        FMCG                                              3                    6                    4
        Health care                                       3                    6                    7
        Cosmetics, perfumes                               2                    6                    3
        Other categories                                  3                   16                    3

    Source: Data Insight, 2017
9         Number of orders by category                                                                58

          throughout 2018
      Category                   Subcategory                   Q1 2018, %   Q2 2018, %   Q3 2018, %
     Building                    Building and home
                                                                      14           26           33
     and homeware                renovation products
     Building
                                 Furniture                            18           31           31
     and homeware

     FMCG                        FMCG                                 30           26           30

                                 Sporting and recreation
     Sporting goods                                                    4            7           28
                                 products
     Home electronics and        Spare parts and accessories
                                                                      15           18           26
     appliances                  for appliances
     Apparel, footwear
                                 Fashion                               5           11           25
     and accessories

     Cosmetics, perfumes         Cosmetics, perfumes                   9           21           19

    Source: Data Insight, 2017
9         Number of orders by category                                                                    59

          throughout 2018 (2)
     Category                    Subcategory                       Q1 2018, %   Q2 2018, %   Q3 2018, %
                                 General
     General stores                                                        -5           -5          12
                                 stores

     Books and CDs               Books                                     4            6           10

     Home electronics and
                                 Gadgets                                   8           18            9
     appliances

     Health care                 Medical products                         14           10            1

     Children’s goods            Children’s goods                         16           20            0

     Home electronics
                                 Home electronics and appliances          14           0.6           -1
     and appliances

     Other categories            Other categories                          5           10            9

    Source: Data Insight, 2017
10                                           61

              Online stores

 • online stores in Russia, 2017
 • average rating
 • TOP 10 online stores
 • online stores with highest growth rates
 • accelerating growth factors
10         Online stores in Russia, 2017                                                                                                            62

 Online store is a website where consumers can place an order by filling
 out a form or adding products to the shopping basket. Figures in this
 section do not include marketplaces, MLM services, mobile stores that                                NO LESS THAN
 operate as mobile apps only, wholesale stores and stores that trade
 with legal entities only, purchase forms in social media and messengers,
 desktop applications (macOS and Windows).

                                                                                                        THOUSANDS
         Only ~2,000 online stores receive 20+ orders per day
                                                                                                         WEB SITES
         Less than 10k stores receive 5+ orders per day                                      with online store functionality
         Only ~80k stores have 20+ visitors per day                                          (~9% of all live* .ru domains)

                                                                                             * retrieve a non-empty page in response to a request
 Source: Data Insight, TOP 100 Russian Online Stores Ranking, 2017 – datainsight.ru/top100        and do not forward user to another domain
10         Average rating                                                                                                                      63

 The closer to the top, the greater the gaps between the shops. While the difference in performance between two adjacent
 ranking categories outside the top 100 is 3–3.5-fold, the difference between top 10 and top 30 or top 30 and top 100 is already 5-
 fold.

                                                                                  By orders per day, 2017 average   By revenue, 2017, RUB mn

     TOP 1: Wildberries.ru                                                                              110,000                     63,800

     TOP 10                                                                                              13,500                     16,000

     TOP 30                                                                                               2,500                       4,400

     TOP 100                                                                                                500                       1,400

     TOP 300                                                                                                140                        300k

     TOP 1000                                                                                                 45                         85

 Source: Data Insight, TOP 100 Russian Online Stores Ranking, 2017 – datainsight.ru/top100
10           TOP 10 online stores                                                                                                                             64

                                             Online sales,            Y-o-y growth                   Orders,   Y-o-y growth   Average check,   Y-o-y growth
     Store
                                            2017, RUB mn                in 2017, %           2017, thousand      in 2017, %       2017, RUB      in 2017, %

     Wildberries.ru                                  63,800                        40                39,800             37            1,600              2

     Citilink.ru                                     55,200                        35                 5,190             33           10,620              2

     DNS-shop.ru /
                                                     38,900                        61                 5 800             71            6,710              -6
     Technopoint.ru

     Mvideo.ru                                       36,700                        41                 3,570             71           10,280            -17

     Eldorado.ru                                     23,700                          2                4,340             11            5,460              -8

     Lamoda.ru                                       23,600                          6                4,030              5            5,860              1

     Ozon.ru                                         23,400                        44                 8,640             51            2,700              -5

     Ulmart.ru                                       23,100                       -37                 5,910            -24            3,900            -18

     Bonprix.ru                                      16,500                        10                 4,020             10            4,120              1

     Svyaznoy.ru                                     15,700                        35                 1,480             37           10,670              0

 Source: Data Insight, TOP 100 Russian Online Stores Ranking, 2017 – datainsight.ru/top100
10         Online stores                                                                                                    65

           with highest growth rates

                                     Online orders growth over 12 months
                                                                                         The two largest
                                                                                         (by the number of orders) online
                         Q2 2018 / Q2 2017

                         Q1 2018 / Q1 2017
                                                                                         stores are growing
                         2017 / 2016
                                                                                         4x faster than the market
                                                                                         and 2x faster than
                                                                                   86%
                                                             74%
                                                                           66%
                                                                                         their own growth rate
                                                      47%          44%                   in the previous year
                                                40%

                        18%    16%     19%

                              Market             Wildberries.ru          Ozon.ru

 Source: Data Insight
10         Accelerating                                                                                                  66

           growth factors

                                                                                    Three key factors of accelerating
                                                                                    growth for online stores:
                                                                                    1) growing frequency of purchases,
             Frequency                                                              which is based on creating a loyal
                                                                                    audience.

                                    New product                                     2) new product categories and
                            categories and diversification                          diversification.

                                                             Own and partner oder
                                                                                    3) own and partner order delivery
                                                               delivery points      points.

           Loyal audience

 Source: Data Insight
11                                            67

 Social media sales

 • social media sales in Russia,
   2017–2018
 • product categories in social media sales

 • B2C and C2C channels
 • major platforms in terms of B2C and C2C
   transactions made via social media
11          Social media sales                                                                                                                                           68

            in Russia, 2017–2018
 In this section, we are looking at sales completed via social media,
 messengers, classifieds and sharing economy* sites, joint purchases and
 sales of goods and services conducted by merchants (B2C sellers) and
 individuals (C2C sellers), exclusive of purchases made outside the listed
 platforms, namely on gaming platforms, real estate and vehicle sales.

                                                                                                                                 RUB bln
                                                                                                                                REVENUE
      394 mln                                          ~RUB 1 500
     transactions (+19%)                                          average check

 * A list of product and service marketplaces with social media functionality: AirBnB.ru, Profi.ru, YouDo.ru,
 Remontnik.ru, Pomogatel.ru, BlaBlaCar.ru, BeepCar.ru, Livemaster.ru, Etsy.com
 Source: Data Insight for Yandex.Checkout, Social Media, Messengers, Classifieds and Sharing Economy Sites as Sales Channels, 2018 – datainsight.ru/socialcommerce2018
11          Product categories                                                                                                                                                                 69

            in social media sales
     Category                                                               Online sales, RUB bn per year                      Average check, RUB *                 Share of transactions, %

     Apparel and footwear                                                                            101.4                                     1,950                                  15.7
     Home electronics and appliances                                                                  97.6                                     3,600                                   8.2
     Rental properties                                                                                79.9                                     6,500                                   3.7
     Animals and plants                                                                               63.5                                     3,000                                   6.4
     Children’s goods                                                                                 31.0                                     1,370                                   6.9
     Tickets (transport, events)                                                                      22.8                                     1,111                                   6.2
     Homeware and DIY                                                                                 21.0                                     1,500                                   4.2
     Hobbies and handicrafts                                                                          18.1                                     1,800                                   3.0
     Gifts and jewelry                                                                                15.3                                     1,300                                   3.6
     Food                                                                                             12.3                                     1,000                                   3.7
     Game characters and items                                                                        11.6                                       350                                  10.1
     Auto parts and accessories                                                                        9.1                                     2,500                                   1.1
     Other services                                                                                   74.9                                     1,500                                  17.6
     Other products                                                                                   30.5                                         -                                   7.7

 * Median check. Online survey of Internet users that generated 1,659 responses. Based on the question regarding the user's latest purchase via social platforms.
 Source: Data Insight for Yandex.Checkout, Social Media, Messengers, Classifieds and Sharing Economy Sites as Sales Channels, 2018 –
 datainsight.ru/socialcommerce2018
11         B2C and C2C channels                                                                                                                                                          70

 B2C merchants use social media, while C2C sellers are active on the classifieds sites.

      96%                        94%
                                                                                                                                 С2С: % Internet users selling through social channels

                                                                       71%
                                                                                                                                 B2C: % merchants using social channels

                                            37%
                                                            30%                        29%

                                                                                                   9%             7%                                 6%                      6%
                   4%                                                                                                                     4%                       2%
          Own site                 Social media             Classifieds sites            Messengers               Own mobile app         Shared shopping       Sharing economy* sites
                                                                                                                                             services

 AirBnB.ru, Profi.ru, YouDo.ru, Remontnik.ru, Pomogatel.ru, BlaBlaCar.ru, BeepCar.ru, Livemaster.ru, Repetitors.info, Etsy.com
 Source: Data Insight for Yandex.Checkout, Social Media, Messengers, Classifieds and Sharing Economy Sites as Sales Channels, 2018 –
 datainsight.ru/socialcommerce2018
11         Largest platforms in terms of B2C                                                                                                             71

           and C2C transactions on social media
              VK                                                                                                                                   15%
          Avito                                                                                                                              14%
            Yula                                                                                                                       12%
     Instagram                                                                    6%
         YouDo                                                           5%
           Profi                                                4%
 Odnoklassnik                                              4%
     WhatsApp                                             4%
     Telegram                                    3%
          Viber                               2%

 Source: Data Insight for Yandex.Checkout, Social Media, Messengers, Classifieds and Sharing Economy Sites as Sales Channels, 2018 –
 datainsight.ru/socialcommerce2018
12                                            72

 Online shoppers
 in Russia

 • online shoppers in Russia, 2018
 • online consumption and local population
 • growing number of shoppers by population
 • online consumption drivers
12         Online shoppers in Russia, 2018                                                                                                               73

 Online shopper is a person who has made a purchase using the Internet or mobile Internet.
 Users who shopped via social media (see the previous section) are not included if they shopped via that channel only.

 Three majority groups among the active Internet users in Russia:

                                                                                                                                                  2017
                             65%
            58%                                                                55%                                              54%               2018
                                                              46%                                              44%

              Покупают товары                                     Оплачивают                                  Используют денежные
                в интернете                                    в онлайне покупки                                онлайн-переводы
                Buy goods online                               Pay for purchases online                        Use online money transfers

 Source: Data Insight for PayPal, Russia's Online Economics: (Russia's Online Economics: How People in Big, Medium-Sized Cities and Small Towns
 Buy, Sell And Pay Online), 2018 – datainsight.ru/PaymentEvolution2018
12         Online consumption                                                                                                                                                                                         74

           and local population
                                                                                                              0,72
 The share of online shoppers is above average                                                                                          0,65
                                                                                                                       0,63
                                                                                                                                                   0,61
 in large cities, among the better educated, affluent and experienced                                                                                                                   0,59
                                                                                                                              0,55                         0,55            0,55                0,53            0,54
 Internet users.                                                                                                                                                                                        0,49
                                                                                                                                                                   0,44

 The user's age is also factor, though it rather affects the Internet
 penetration than the share of online shoppers within the online
 audience.
                                                                                                                     Buy goods online                 Pay for purchases online          Use online money transfers

                                                                                                                                A one million-person city and bigger              Rest of the country
 The penetration in remote Russian regions is about a year behind the                                                           Medium-sized cities                               Average
 national average. Big cities, on the other hand, are about a year ahead of
 the national market in terms of online shopping, payments and transfers
 penetration.

 Source: Data Insight for PayPal, Russia's Online Economics: (Russia's Online Economics: How People in Big, Medium-Sized Cities and
 Small Towns Buy, Sell And Pay Online) – datainsight.ru/PaymentEvolution2018
12           Growing number of shoppers                                                                                                                                   75

             by population

                                                                                                                        Catch-up growth: Last year, the share of
 60%
                                                                                                                        online buyers increased by 7 percentage
                                                                                                                        points (p.p.) in big and medium-sized cities
 50%
                                                                                                      ~2
                                                                                                      years             and by as much as 9 p.p. in the rest of Russia.
 40%

 30%

 20%                                                                                                                           A one million-person city and bigger

 10%                                                                                                                           Medium-sized cities

     0%                                                                                                                        Rest of the country

      2008             2010             2012               2014              2016              2018

 Source: Data Insight for PayPal, Russia's Online Economics: How People in Big, Medium-Sized Cities and Small Towns Buy, Sell and Pay Online,
 2018 – datainsight.ru/PaymentEvolution2018
12         Online                                                                                                                                                                             76

           consumption drivers

 The key benefit of online shopping is the convenience                                                      What is the key reason why use the Internet to search for, choose and order
                                                                                                            products?
 of searching and comparing products.
                                                                                                                                                     Saves time
                                                                                                                                  18%
                                                                                                                  24%                                Easy to search and compare products,
                                                                                                                                                     prices

                                                                                                                                                     I can find new, rare, interesting products
 The spread of consumers' responses is practically the same in
 big and medium-sized cities and small towns.                                                                  14%                                   Comprehensive information
                                                                                                                                      35%
                                                                                                                      9%                             Saves money, better deals

 Source: Data Insight for PayPal, Russia's Online Economics: (Russia's Online Economics: How People in Big, Medium-Sized Cities and
 Small Towns Buy, Sell And Pay Online), 2018 – datainsight.ru/PaymentEvolution2018
13                 77

 Data
 sources
 and methodology
13   Market data sources                                              78

     1   Survey data.

     2   Aggregated / anonymized data of services that monitor user
         behavior (browser extensions, etc.).

         Online store traffic
     3
         statistics (counters + panel meters).

     4   Own data provided by online stores.

     5   Data derived from B2B services catering for online store.
13       How we make our estimates                                    79

 Online sales estimates by Data Insight
 are based on:

 • direct public and non-public data of large online stores (~100
     stores);
 • Data Insight monitoring data on the number of orders (>3,000
     online stores);
 • Data Insight monitoring data on the website traffic (>70k online
     stores);
 • sample data (logs) on the Internet users' activity (clickstream
     analytics);
 • surveys targeted at online shoppers.
13       Sources used in the report                                                                                                               80

     ▪   data.worldbank.org                                                   1100--ishunkina.pdf
     ▪   ecommercewiki.org/country-facts                                  ▪   http://files.runet-id.com/2018/rif/presentations/18apr.rif18-zal-
     ▪   ecommercewiki.org/reports/89/global-b2c-ecommerce-country-           1.10-00-1--ishunkina.pdf
         report-2017-free                                                 ▪   datainsight.ru/c2c-2017
     ▪   itu.int/en/ITU-D/Statistics/Pages/stat/default.aspx              ▪   datainsight.ru/eBayCrossborder2018
     ▪   lpi.worldbank.org/international/global/2018                      ▪   datainsight.ru/PaymentEvolution2018
     ▪   doingbusiness.org/content/dam/doingBusiness/media/Annual-        ▪   logistics.datainsight.ru/osnovnoy-doklad-2017
         Reports/English/DB2018-Full-Report.pdf                           ▪   datainsight.ru/expressdelivery
     ▪   home.kpmg.com/xx/en/home/insights/2017/01/the-truth-about-       ▪   datainsight.ru/DI-mobile-09-17

     ▪
         online-consumers.html
                                                                          ▪   datainsight.ru/top100
         pwccn.com/en/industries/retail-and-
         consumer/publications/total-retail-survey-2017-china-cut.html    ▪   datainsight.ru/PaymentEvolution2018
     ▪   pwc.ru/en/publications/total-retail-2017.html
     ▪   shopify.com/enterprise/global-ecommerce-markets
     ▪   files.runet-id.com/2018/riw/presentations/21nov.riw18-red-dot-
Commercial research and projects                                                                     81

     Market research                                Competitive analysis
     • Market sizing                                • Key competitors: size,
     • Key players and their shares                   market share
     • Market structure                             • Assortment analysis
     • Key market trends and development barriers   • Key stengths and weaknesses

     Buyer research                                 Consulting
     • Consumer behavior analysis                   • Strategy consulting and strategy development
     • Buyer persona (socio-demographic             • Marketing consulting
       characteristics)                             • Overview of market conditions
     • Drivers and barriers to the selection,       • Analysis of the client's business needs
       purchase and use of goods/services
Our research by sector                                       82

Homeware and DIY   Children’s goods   Apparel and footwear

Medical products   Home electronics
Public research                                                              83

Express delivery                                 Online retail export 2018
market

                         IAB Russia Digital
                         Advertisers Barometer
                         2018

Social commerce market
in Russia
Our clients   84
About Arvato                                                                                                                                          85

Experts in business process management
tailoring each project to the customer's individual needs.

Arvato Supply Chain Solutions Group is represented in 20 countries. Belonging to the international concern Bertelsmann allows Arvato in Russia to
use the experience, technology and process organization implemented in other countries of the world. Doing its business in Russia since 1997, it is
one of the largest independent fulfillment providers with a wide range of services: supply chain solutions, solutions for e-commerce, loyalty
programs development, logistics and financial services. Among the clients are big international brands of such segments as fashion, banks, auto
business, Healthcare, High-Tech.

solution@arvato.ru

www.arvato.com/ru
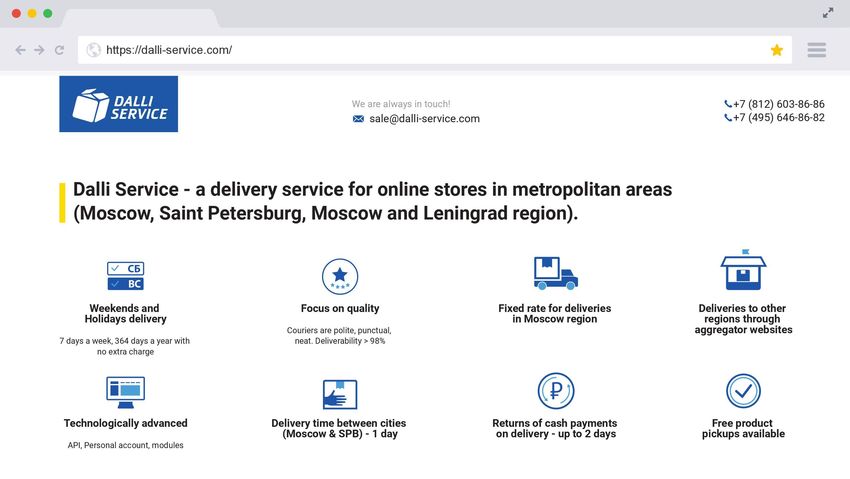
About Dalli Service                                                                                                                                   86

A delivery service for online stores in metropolitan areas (Moscow, Saint
Petersburg, Moscow and Leningrad region).

The company's focus - quality of delivery. Our couriers are polite, punctual and neat. The call center is always available and seeks to resolve all
issues. Company executives are not afraid to communicate with customers. IT system has several layers of sustainability

Another company’s goal is in creating points of growth for customers. Dalli Service delivers on weekends and holidays with no extra cha. This
alone gives online stores over 100 days of additional sales. The company offers next day delivery to Moscow region and Saint Petersburg, fixed
rate fot deliveries in Moscow region. Quickly returns cash on delivery and commodity returns - from 2 days. For the convenience of customers,
the company continues to work with multi-place orders. Dalli Service has free product pickups. Deliveries to other regions are made through the
aggregator. The company is technologically advances and offers the choice to use a personal account, API and various modules.
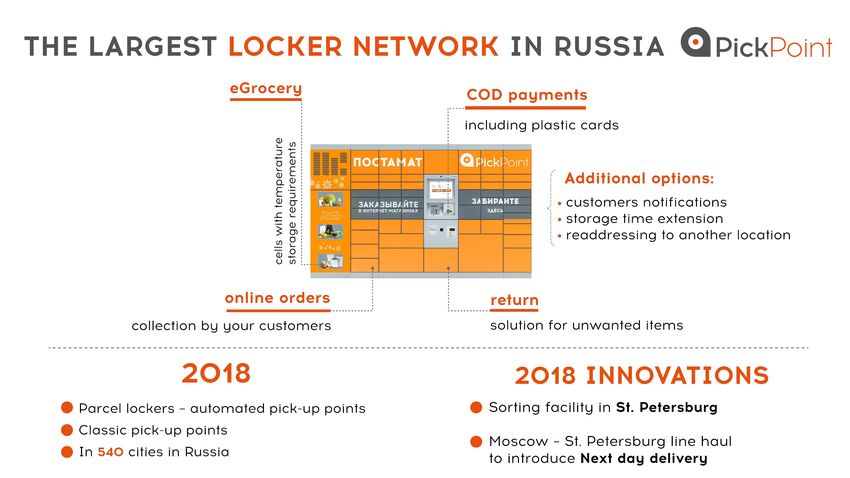
About PickPoint                                                                                                                87

PickPoint is the leading new-generation logistics service
that was created to enable easy and affordable payments
and receipt of online orders.

PickPoint – is the first brand to introduce parcel locker delivery   Parcel lockers make online shopping enjoyable:
in Russia. New service was created to make online orders and
                                                                     •    Customer chooses preferred location while shopping
COD payments more convenient and simple. PickPoint has
developed the largest click and collect network in Russia,           •    Customer makes decision on time and get no queues
currently including parcel lockers and pick up points, that in       when
total give 6500 locations in 450 cities. 5.5 thousand retailers
already use PickPoint as their delivery chanel. PickPoint unique     •    The order can be paid with cash or bank card
users database contains 7.2 million people.
                                                                     •    Customer can also send back the parcel
The main aim of a locker is– enabling customers to collect, send
and return parcel as simple and convenient as possible.
About Data Insight                                              88

Focus areas of research and consulting:

• Retail and e-commerce, including tangible goods, travel and
  educational services.
• Consumer behavior online.
• E-commerce services analysis.
• Internet advertising, interactive advertising services and
  technologies, audience behaviors.
89

Data Insight
First agency in Russia specializes in research
and consulting in the area of e-commerce and other
online markets

Data Insight News                      E-commerce monitoring             Contacts

Data Insight research delivered to     Data Insight performs
your mailbox on the day of             a weekly e-commerce market news
publication                            monitoring                        datainsight.ru
                                                                         +7 (495) 540 59 06
Subscribe                              Subscribe                         a@datainsight.ru
You can also read