Bank of America Merrill Lynch Consumer & Retail Technology Conference
March 15, 2016
←
→
Page content transcription
If your browser does not render page correctly, please read the page content below

Bank of America Merrill Lynch Consumer & Retail Technology Conference March 15, 2016

Disclaimer

Forward Looking Statements

Certain statements herein are ―forward-looking statements‖ made pursuant to the safe harbor provisions of the Private Securities Litigation Reform Act of 1995. Statements contained
herein that are not clearly historical in nature are forward-looking. In many cases, you can identify forward-looking statements by terms such as ―may,‖ ―will,‖ ―should,‖ ―expects,‖
―plans,‖ ―anticipates,‖ ―believes,‖ ―estimates,‖ ―predicts,‖ ―potential‖, ―targets‖, ―intends‖ or the negative of these terms or other comparable terminology. These forward-looking
statements speak only as of the date hereof and are based on the Company’s current plans and expectations and are subject to a number of known and unknown uncertainties and
risks, many of which are beyond the Company’s control. These risks and uncertainties include: our ability to compete effectively in a competitive industry; fluctuations in commodity
prices; our ability to appropriately respond to changing merchandise trends and consumer preferences; successful implementation of our store growth strategy; decreases in our
Halloween sales; disruption to the transportation system or increases in transportation costs; product recalls or product liability; economic slowdown affecting consumer spending and
general economic conditions; loss or actions of third party vendors and loss of the right to use licensed material; disruptions at our manufacturing facilities; and the additional risk and
uncertainties set forth in ―Risk Factors‖ in Party City’s December 31, 2015 Form 10-K and in subsequent reports filed with or furnished to the SEC. As a consequence, current plans,
anticipated actions and future financial position and results of operations may differ significantly from those expressed in any forward-looking statements in the presentation. You are
cautioned not to unduly rely on such forward-looking statements when evaluating the information presented. Except as may be required by any applicable laws, we assume no
obligation to update any of these forward-looking statements.

Non-GAAP Financial Measures

We present non-GAAP measures when our management believes that the additional information provides useful information about our operating performance. This presentation
includes unaudited non-GAAP financial measures, including Adjusted EBITDA, Adjusted EBITDA margin, Adjusted net income, Adjusted EPS and Pro forma Adjusted EPS. Non-
GAAP financial measures do not have any standardized meaning and are therefore unlikely to be comparable to similar measures presented by other companies. The presentation of
non-GAAP financial measures is not intended to be a substitute for, and should not be considered in isolation from, the financial measures reported in accordance with GAAP. See
our SEC filings for a reconciliation of the non-GAAP financial measures included in this presentation to the comparable GAAP measures.

.

Industry Data

This presentation also contains industry data, forecasts and other information that we obtained from industry publications and surveys, public filings and internal company sources.
Statements as to our ranking, market position and market estimates are based on independent industry publications, third-party forecasts and management’s estimates and
assumptions about our markets and our internal research. While we are not aware of any misstatements regarding our market, industry or similar data presented herein, such data
involve risks and uncertainties and are subject to change based on various factors. We have not independently verified third-party information nor have we ascertained the underlying
economic assumptions relied upon in those sources, and we cannot assure you of the accuracy or completeness of such information contained in this presentation.

                                                                                                                                                                                               2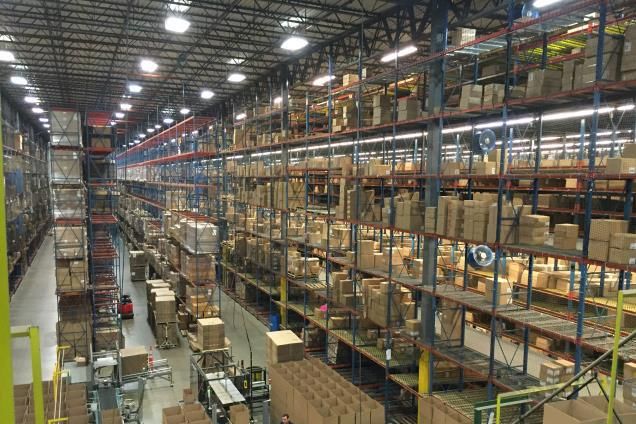
Company Overview
Company Overview: Nobody Has More Party For Less!
Largest vertically integrated manufacturer, supplier and retailer of decorated party goods globally
$2.3 billion in worldwide sales1,2
$380 million in Adjusted EBITDA1,3 / 16.6% Adjusted EBITDA margin1
Manufacturing Wholesale / Distribution Retail
Canada
41
2
15
1 3
2
3
19
12 65 7
6 29
4 8 31 3 27
114 29 28 16
14 53 22
6 1 22 2
18 9
17 24
3 2 13 19
3
9
9 31
67 3
11
Hawaii Puerto Rico 5
>40,000 SKUS 71
Largest global designer, manufacturer, and
distributor of decorated party supplies and
40,000 Retail Locations #1 party goods retailer in North America
costumes
~900 locations across North America4
~75% of products are sourced through
The largest manufacturer of metallic balloons in wholesale business
the world Party Independent Grocery Dollar Mass
City Party Stores Stores Stores Merchant One stop shop for all party needs
1 Fiscal year 2015
2 Includes franchise royalties.
3 See SEC filings for reconciliation of Adjusted EBITDA to Net Income.
4 Includes franchise locations.
4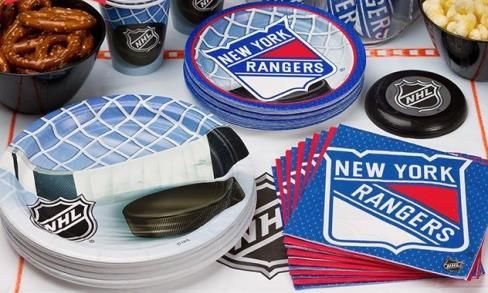
Timeline: A History of Party City’s Vertical Integration

                                                         Evolution of the Business – Key Events

  Amscan                                                           Acquired      Acquired Gags                                                                       Acquired
  founded                                                          Party City    and Games,                                                             Acquired
                                                                                                                                                                     Festival
                       The Party                                                 Factory Card                                                           Travis
                                                                                                       Acquired party            Acquired iParty                     SA
                       Superstore                                                and Party Outlet                                                       Designs
                                                                                                       goods division of         and Party
                       Channel         Built a new                               & 85% of Party        American                  Delights (online
                       evolves         distribution                              City Franchise        Greetings                 retailer)
                                       facility                                  Group

1947   1986 1989        1997 1998      2001 2002 2003             2005   2006   2007   2008           2010       2011            2013      2014     2015           2016
        Became a                                              Acquired                  Acquired                 Acquired                                          Acquired
        vertically                                               Party                  remaining                Riethmuller,                                      23
        integrated                                             America                  interest in Party        Latex Balloon                                     franchise
        manufacturer                                                                    City Franchise           Manufacturing                                     stores
                                                                                        Group                    in Malaysia,
                                                      Hong Kong                                                  and Party
                                      Acquired        showroom                                                   Packagers in
                                          M&D         opened                          Acquired Christy’s                                            Acquired
                       Acquired                                                                                  Canada
                                      Balloons                                     Costumes and Christy                                             ACIM
                       Anagram
                                                                                         Garments and
                                                                                           Accessories

                                                                                                                                             Acquired
                                                                                                                                             U.S.
                                                                                                                                             Balloon

                                    Party City has developed into a fully integrated manufacturer and wholesaler
                                                       with an Omni-Channel Retail Presence

                                                                                                                                                                                5
2015 Highlights
2015 Highlights

                                         Revenues1,2                                                                            Adjusted EBITDA3

                                                                         $2,334
                                                                                                                                                    $380

                         $2,242                                                                                          $362

                         2014                                            2015                                           2014                       2015

                                                                                                          % margin      15.9%                      16.6%

                                  Adjusted Net Income3                                                                  Pro Forma Adjusted EPS3,4

                                                                      $114
                                                                                                                                                   $1.01
                        $87
                                                                                                                        $0.77

                      2014                                           2015                                               2014                       2015

1   Adjusted for 53rd week impact in 2014 (extra week in 2014 contributed $29M of revenues)
2   Adjusted for constant currency (FX impact of $39M)
3   Results are presented on an adjusted basis; see reconciliation to GAAP in our SEC filings
4   Pro forma EPS has been adjusted for the additional shares issued in the April 2015 IPO for comparability purposes
                                                                                                                                                           7
2015 Highlights

Progress on Key Growth Initiatives since IPO:

Growth Initiative                     2015/2016 Accomplishments

Expand Retail Store Base              Opened/acquired 33 new stores in the US and Canada (19 net of closures)

Increase Share of Shelf               Expanded from ~70% in FY 2014 to ~75% in 2015

Drive Same Store Sales                2015 brand comp of 1.5% despite Frozen headwinds and store resets

Grow Third Party Wholesale Business   2015 wholesale sales growth of 5% (ex-currency)

Grow Our Global Digital Platform      YTD North American online comparable sales up 4%+

                                      • Expanded presence into Mexico through master franchise agreement with
Increase International Presence         plan to open 80 stores by 2024
                                      • 2015 international third party wholesale sales up 15% (ex-currency)

                                      Completed acquisitions of Travis Designs, ACIM, two franchise groups
Pursue Accretive Acquisitions
                                      comprising 23 stores and Festival SA

                                                                                                                8
2016 Recent Developments
Acquired 23 franchise stores from two franchise groups in Arizona, New Mexico and Kansas for a
combined net cash purchase price of $28 million representing a multiple of EBITDA of ~4.2X.
Entered into an e-commerce agreement with Staples to be their ―white label‖ fulfillment partner
for party goods sold on Stapes.com. We expect to roll this out to other online retailers in the future.
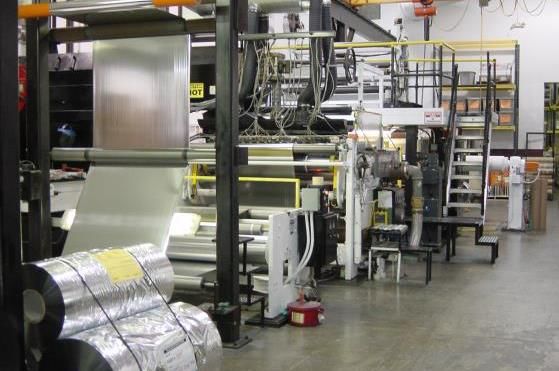
Extended our portfolio licensing partnership with Warner Brothers to produce costumes and
accessories for the Wizard of Oz, Harry Potter , Scooby-Doo, the Flintstone and more for our own
Party City stores and partycity.com; in 2017 this will also include DC Comics Super Heroes including
Batman, Superman, Wonder Woman, the Justice League and more.
Acquired Festival SA, a costume manufacturer in Madagascar which, over the next few years
will allow us to source as much as 15% of our costume requirements through this operation, and
capture the full manufacturing to retail margin.
9
2016 Outlook
Revenues expected to range from $2.35 billion to $2.42 billion
Adjusted EBITDA expected to range between $390 – $405 million
Adjusted Net Income expected to range between $140 - $150 million
Adjusted diluted EPS expected to range between $1.17 to $1.25
Brand comparable sales expected to be flat to up slightly
Frozen lapping effect and one less selling day due to Easter Sunday shifting into Q1 2016 as
opposed to Q2 2015. We expect Q1 brand comparable sales to decline 1-2% with low single
digit EPS for Q1.
10Key Investment Highlights
Investment Highlights
1 2 3
Unique Vertically Integrated
Leading Market Position Broad and Innovative
Operating Model with Controlled
in a Growing Category Product Offering
Distribution Channels
Leading party goods supplier in the Combination of wholesale and retail Unmatched product breadth with over
growing $10+ billion party goods enhances profitability through greater 25,000 SKUs in-store and 50,000
industry margin capture for majority of goods SKUs online
Leading global designer, manufacturer Amscan has ~75% share of shelf at Best-in-class design capabilities and
and distributor of decorated party Party City and manufactures ~20% of innovation track record creating new
supplies and costumes product sold in our stores opportunities
#1 party goods retailer in North Global sourcing model assures lowest Brand portfolio of licenses supported
America with over 900 superstore cost manufacturing for all products by market position at wholesale and
locations Rapid response to changing retail
consumer trends
4 5 6
Strong Financial Performance Multiple Levers for World-Class Management Team and
And Free Cash Flow Generation Revenue + Margin Growth Experienced Sponsor Ownership
Sales of party goods have been Meaningful whitespace: 400+ new Seasoned management team with
resilient in all economic cycles stores1 experience across wholesale and
Repeat-purchase model, consumable Strong e-commerce growth through retail businesses and international and
nature of products and predictable enhanced omni-channel initiatives e-commerce platforms
selling patterns Grow wholesale business through Track record of strong performance
Consistent margin expansion and top- increased share of shelf and operating with leverage
line growth; superior to peers alternative markets Majority sponsor has a long history of
Exceptional free cash flow generation Select geographic and channel success in C&R investments
expansion opportunities
Expertise in tuck-in acquisitions
1 Includes franchise stores in Mexico
121 Leading Wholesale Business
One of the largest manufacturers, designers and Wholesale Revenue by Product Category1
distributors of decorated party supplies in the world
– Over $1.2bn in sales, ~47% to owned retail and Metallic Ballons
12% Costumes &
e-commerce Accerssories
28%
Favors, Stationery &
Other
Product sold in over 40,000 retail locations in 100+ 16%
countries
– 59% U.S. and 41% International
Decorations
Tableware
20%
24%
Deep assortment with over 40,000 SKUs across 5
product categories
Wholesale Sales by Channel1
– 400+ party goods ensembles, which contain 5 to Other
International
50 design-coordinated items Balloon
International
20%
Distributions
2%
Balanced, multi-channel customer base – no single
customer represents more than 10% of third party Domestic Ballon Owned Stores &
Distributors/ e-commerce
sales at wholesale Retailers 47% 2
6%
Other Domestic
Retailers
12%
Party City
Franchised
Stores
13%
1 Reflects December 31, 2015 numbers. Based on total wholesale sales including intercompany sales to retail operations. 2015 total wholesale sales were $1,227 million and intercompany sales were
$573 million.
2 Includes sales to Party City Canada and Party Delights.
131 Category Defining Omni-Channel Retail Concept
Retail Stores e-Commerce
Largest retail network of A leading operator of Largest party e-Commerce U.K. acquisition expanded
decorated party supplies temporary Halloween platform with ~$140 million platform into Europe
in North America stores in North America of revenue for 20151
– B2B capabilities Rolled out additional
– Over 730 company- – Used to test locations country specific sites
owned Party City for year round Party – Average basket 3x across Europe and
superstores City stores retail beyond (including
including ~50 Germany, France, and
locations in Canada the Netherlands)
and ~180 franchise
locations
Approx 300 e-Commerce
~900 Party
Temporary currently ~10% of
Superstores
Stores Retail Sales
Nobody Has More Party for Less!
1 Includes Party Delights
141 Category Leadership Like No Other Specialty Retailer
Party Vitamin & Home
Goods Supplements Crafts Pet Supplies Sporting Goods Improvement
Industry
Leader
Stores ~7001 ~3,5001 ~1,300 ~1,400 ~700 ~2,270
NM
#2 Player
Stores — ~725 ~600 ~1,300 ~185 ~1,850
1 Excludes franchise locations.
Source: Company filings and websites.
152 Unique Vertically-Integrated Operating Model
Breakdown of Retail Sales Product that PRTY buys from a third party and sells at Party City
Singles corporate stores. Earns retail margin only
Examples: candy, greeting cards, helium, foil serving pans
25% 20%
Product that PRTY’s wholesale division buys from a third party and
sells at Party City corporate stores. Earns wholesale + retail
30% Doubles margin
Examples: party favors, costumes and other wearables, table
55% 80% covers, cutlery
75% share
share of shelf Product that PRTY’s wholesale division manufactures + distributes
of shelf 50% + sells at Party City corporate stores. Earns manufacturing +
Triples wholesale + retail margin
20%
Examples: paper plates, bowls, cups & napkins, plastic cups,
metallic and latex balloons, piñatas
Today Goal (2-4 years)
Our vertical model and significant, global scale provide unique competitive advantages:
Enhanced profitability by capturing the full manufacturing-to-retail margin on a significant portion of the products sold in our retail
stores
Enhance wholesale capabilities via retail insights
Enhance retail capabilities via wholesale insights
Cost competitive sourcing
Enhanced control of inflation pressures
Maintain greater control of every step from design and production through the sale of our products across channels:
– Design and innovation capabilities
– Ensures best products and inventory
– Rapid response to changes in consumer preferences
162 Power of the Vertical Model
Gross Margin Impact of Achieving Vertical Goals
Gross margin Today Goal
Hypothetical example Individual1 Cumulative Vertical % GM Vertical % GM Benefit
$ 1.00 Retail sales price
0.50 product cost
“Single” 0.50 product profit
0.20 occupancy
$0.30 net gross margin 30% 30% * 25% = 7.5% 20% = 6.0%
$0.50 WS sales price
0.25 product cost
“Double” 0.25 product profit
0.10 freight/distribution
$0.15 net gross margin 30% 45% * 55% = 24.8% 30% = 13.5%
$0.25 Mfg sales price
“Triple” 0.21 cost
$0.04 profit 15% 49% * 20% = 9.8% 50% = 24.5%
42.1% 44.0% ~200bps2
1 For ease of illustration purposes, a static product mix between vertical and 3rd party volumes as well as a static individual margin used. Actual results depend on range of individual margins by product
line and mix of vertical and non-vertical volumes.
2 Does not reflect GM impact of other factors like FX, international sales and expense leverage.
172 Highly Efficient Manufacturing, Sourcing and
Distribution Capabilities on a Global Footprint
In-house manufacturing focused on high-volume Sourcing Manufacturing Distribution
party essentials that can be manufactured through Distribution
Brooklyn (NY)
highly automated processes Distribution
Amscan UK
Amscan Europe Kircheim
unter Teck (Germany)
Milton Keynes,
(England) Distribution
Distribution
– Examples: Paper and plastic tableware products
and metallic balloons Anagram
Elmsford (NY)
Headquarters
Eden Prairie (MN)
Manufacturing East Providence (RI) Amscan Asia
Edina (MN) Manufacturing / Distribution Hong Kong (China)
Distribution Harriman (NY) Distribution / Sourcing
Capabilities are cost-competitive and provide rapid Ampro
Tijuana (Mexico)
Manufacturing / Distribution
Manufacturing
Newburgh (NY)
Manufacturing
6 Sourcing Facilities
turnaround times on key product categories Louisville (KY)
Chester (NY)
Distribution Everts Malaysia
Melaka (Malaysia)
Amscan Asia Pacific
Manufacturing / Manufacturing / Baulkham Hills (Australia)
Distribution Distribution
Distribution
Labor intensive products, such as banners, favors Amscan De Mexico
Guadalajara (Mexico)
Naperville (IL)
Distribution
Manufacturing / Distribution
and centerpieces, are principally sourced from Asia
Wholesale Sourcing Mix1
20+ year relationships with many of our vendors
Diversified sourcing, quality control and testing with
In-House
offices throughout Asia (China, Indonesia, India and Manufacturing
32%
Vietnam)
Third Party
68%
Warehousing and distribution facilities around
the world
1 Reflects December 31, 2015 numbers. Based on total wholesale sales including intercompany sales to retail operations. 2015 total wholesale sales were $1,227 million and intercompany sales were
$573 million.
183 Best-In-Class Innovation Capabilities And Broad
Product Offering
Innovation License Portfolio
110 person in-house design team
– Creative staff is constantly in the market identifying
trends and new product concepts
Vertical integration allows development team to test new
products and rapidly respond to changes in consumer
preferences
Proprietary designs and licenses help differentiate products
from those of competitors
Introduce approximately 7,000 new products and 50 new
party goods ensembles annually
Product Offering Selected Merchandise Ensembles
Broadest assortment of merchandise
– Organized by events and themes
Deep merchandise selection
– Wide assortment including invitations, thank you cards,
tableware, hats, horns, banners, cascades, balloons,
novelty gifts, piñatas, favors and candy
193 Differentiated and Fun Retail Experience Insulates
from Online Competition
One stop shop for all party needs Party Goods SKU Count Comparison1
– Greater assortment of merchandise than our national
competitors, including mass merchants 25,000
– Fun destination shopping experience where customers
can get inspired
– Coordinated collections vs. individual items sold by other
online retailers
Compelling ValueQ1 $193
Q2 $193 4
1997
Q3 $198
Q4 $210
Q1 $212
Q2 $212
1998
Q3 $215
Q4 $235
Q1 $256
Q2 $281
1999
Q3 $293
Q4 $306
Q1 $307
Q2 $313
2000
Q3 $321
Q4 $326
Q1 $335
Q2 $339
2001
Q3 $343
Flow Generation
Q4 $345 Recession
Q1 $354
Q2 $365
2002
Q3 $378
Q4 $386
Q1 $389
Q2 $396
2003
Q3 $399
Q4 $403
Q1 $404
Q2 $399
2004
Q3 $393
Q4 $399
Q1 $399
Q2 $404
2005
Q3 $412
Q4 $407
Q1 $430
Q2 $445
2006
Q3 $475
Q4 $508
Q1 $525
Q2 $557
2007
Q3 $592
Q4 $626
Q1 $651
Q2 $656
2008
Q3 $674
Q4 $653
Strong Financial Performance and Free Cash
Q1 $646
Q2 $640
Q3 $626
2009
Recession
Q4 $633
Q1 $637
Q2 $672
Rolling LTM Gross Wholesale Sales ($ in millions)
Q3 $719
2010
Q4 $769
Sales of party goods have been resilient in all economic cycles
Q1 $808
Q2 $838
Q3 $912
2011
Q4 $940
Q1 $955
Q2 $963
Q3 $984
2012
Q4 $1,023
Q1 $1,021
Q2 $1,015
Q3 $1,057
2013
Q4 $1,081
Q1 $1,100
Q2 $1,140
Q3 $1,184
2014
Q4 $1,213
Q1 $1,231
Q2 $1,230
2015
Q3 $1,224
Q4 $1,227
214 Superior Financial Performance
TotalRevenues
Revenues ($mm)
$2,271 $2,295
$2,045
$1,872 $1,914
$1,560 $1,599
$1,487
$1,247
$1,015
2006 2007 2008 2009 2010 2011 2012 2013 2014 2015
Adjusted EBITDA1 ($mm) and margin
$400 $380 17.0%
$362
2006-2015: 16.6%
$350 $321 16.0%
460bps margin $292
expansion $275
$300 15.0%
$250 $231 14.0%
$192
$200 $187 13.0%
12.0% $152
$150 12.0%
$122
$100 11.0%
2006 2007 2008 2009 2010 2011 2012 2013 2014 2015
Adjusted EBITDA Adjusted EBITDA margin
1 See SEC filings for reconciliation of Adjusted EBITDA to Net Income
224 Strong Free Cash Flow Generation
Free Cash Flow ($mm)1
$301
$284
$247 $260
$231
$181
2010A 2011A 2012A 2013A 2014A 2015A
FCF Conversion2
84.0% 84.6%
81.0%
79.3%
78.4% 78.5%
2010A 2011A 2012A 2013A 2014A 2015A
1 Free Cash Flow defined as Adjusted EBITDA less CapEx.
2 Free Cash Flow Conversion defined as (Adjusted EBITDA – CapEx) / Adjusted EBITDA.
234 Strong Balance Sheet and Liquidity
Majority of primary proceeds from IPO used to reduce existing indebtedness
Solid free cash flow generation with ability to self-fund organic growth and opportunistic acquisitions
Ample liquidity going forward supported by new revolver of $640 million1
Target gross leverage YE 2016:5 Multiple Levers for Revenue + Margin Growth
Expand Our Retail Plan to open ~30 stores per year representing ~4% annual square footage growth
Store Base New stores generate a ~3 year payback and 50% ROIC in year 3
Drive Additional Continue to improve brand image and awareness
Growth and
Pursue merchandising initiatives to drive increased units per transaction
Productivity From
Existing Stores Convert existing stores to new, more customer interactive format
Increase share of shelf at company-owned and third-party stores; increase % of self-manufactured product
Grow Wholesale Drive continued product innovation through new licenses and integration of new manufacturing acquisitions
Business Expand into adjacent business-to-business channel
Grow Our Enhance customer experience through integrated omni-channel strategy
Global Digital Further develop international capabilities through country specific sites
Platform Currently represents only approximately 10% of retail sales
Increase Drive international growth through customization of products to local tastes and holidays
International Expand retail presence through store-within-a-store concept with select international retailers
Presence Represents ~15% of revenues in 2015
Completed numerous successful acquisitions over the past 16 years
Pursue Accretive
Emphasis on smaller, bolt-on acquisitions that add scale and/or unique capabilities
Acquisitions
Significant synergy potential through leveraging existing distribution, production and marketing capabilities
255 Expand Our Retail Store Base
Current retail network includes approximately 900 party Company- Owned Stores
superstores, including:
– Approximately 680 company-owned stores in the U.S.
1,000+
and approximately 50 stores in Canada
693 712
– Approximately 180 franchised locations 600
674
Opportunity to add over 4001 additional Party City stores in
the U.S., Canada and Mexico
– 27 new stores opened in FY 2015 (19 net, including
2012 2013 2014 2015 Potential
acquired and closed stores)
New Stores Opened: 24 25 23 27
Net Openings2: 25 74 19 19
Target New Store Economics with Vertically-
Integrated Model
Sales at Maturity ~$2 million
Initial Sales Growth 8 – 10% over 3 – 4 years
Year 3 EBITDA Margins ~18-20%
Average Total Net Investment $765k
Pre-Tax Cash-on-Cash Returns ~50% by Year 3
Payback Period ~3 Years
Through our vertical model, we are able to enhance our total profitability by
capturing the manufacturing-to-retail margin on a significant portion of our
retail sales and by leveraging our access to multiple channels. In this way,
1 Includes franchise stores in Mexico. we are like no other retailer.
2 2013 includes 54 stores acquired from iParty
265 Drive Additional Growth And Productivity
From Existing Stores
Pursue merchandising initiatives to
Continue to improve brand image and awareness
drive increased units per transaction
Strong emphasis on price-value Broadening products within
proposition – ―Nobody Has More existing license arrangements
Party For Less‖ Added color coordinated dress-up
Continual use of Party City and candy products
website and social marketing to
communicate products, party
ideas, assortment, and value
Convert existing stores to new, Increase share of shelf of vertical products in
more customer interactive format redesigned party stores
Expect to have all 150 remaining
stores converted by 2018
Remodeled stores expected to
generate sales growth 5-6%
higher than non-remodeled in the
first year
New store management model
increases employee engagement
and improves customer service
275 Grow Wholesale Business
Wholesale growth driven by our leading scale, Wholesale Share of Shelf1
vertical operating model and strong innovation
Product portfolio initiatives include: ~80%
~75%
– Building out wearable / costume business to 30%
capitalize on recent acquisitions 55%
– Acquisition of new licenses and expansion into ~25%
50%
new categories under existing licenses 20%
Expansion into adjacent business-to-business 2005 2015 Long-term goal (2-4 years)
Triples Doubles
channel
– Targeting under-served consumer segments
Gross Wholesale Sales
– Expansion into adjacent ―alternative markets‖
– B2B opportunities with restaurants, bars, $1,213 $1,227
children’s activity centers and sports arenas $940
$1,023
$1,081
$769 $567 $573
$488
White label partnership opportunities with other $355 $440
$298
online retailers
$585 $583 $593 $646 $654
$471
Benefit from expansion in Mexico via master
franchise agreement with Groupo Oprimax 2010 2011 2012 2013 2014 2015
3rd Party Wholesale Intercompany Sales
1 Based on product COGS.
285 Grow our Global Digital Platform
E-commerce today represents ~10% of total retail sales
– Mobile currently 50% of e-commerce traffic and 20% of e-commerce sales
– Much broader offering online: ~50K SKUs online vs. ~25K in store
– Linking stores to online with perks like free Wi-Fi and in-store ordering for free shipping
– Increasing engagement through social media sites and user-generated content
Insulated from other online retailers (breadth of offering, competitive pricing)
Initiatives for 2016 to drive e-commerce:
Buy online and pick up in stores (pilot program with balloon bouquets)
Expanding our Party Ideas section of the website to harness partner and user generated content
Expanded assortment of SKUs only available online (party kits, web-only party patterns) and personalization options
―Shoppable pins‖ on Pinterest
Adding additional country specific sites
295 Grow our International Presence
Initiatives by Country/Region:
Mexico:
Franchise agreement with Grupo Oprimax to open 80 stores by 2024
First three stores to be opened by 2Q16; five by end of 2016
Target 50% share of shelf
United Kingdom:
1st retail location up and running; 2nd location to open in 2Q16
Store-in-store concepts currently in ~40 Woody’s locations
Dedicated party retail space in ~400 Clinton’s locations
Australia:
Store-in-store concepts currently in ~140 Big W stores
Plan to add additional 50 locations in 2016
Continental Europe:
Dedicated space in large retailers in several countries, including Spain, Germany, Belgium, Switzerland
306 Pursue Accretive Acquisitions Across the
Value Chain
Acquisition Strategy History of Strategic Bolt-on Acquisitions
Global and scalable
infrastructure provides a Festival Franchises
strong platform for future
acquisitions – Manufacturer – Two – US custom – U.K. based – US – German – U.K. based
of costumes franchise injection designer, distributor of distributor of costume
located in groups molded sourcer and metallic party goods company
Emphasis on smaller, bolt-on Description
Madagascar comprising plastics distributor balloons
acquisitions that add scale 23 stores manufactur high-end
and / or unique capabilities er costumes
Potential areas of focus
Date of
include: Mar. 2016 Jan.2016 Aug. 2015 Mar. 2015 Oct. 2014 Jan. 2011 Sep. 2010
acquisition
– Broaden and deepen
product capabilities
Size $5mm $28mm $11mm $12mm $10mm $47mm $34mm
– Expand retail presence,
including domestic
franchisee buyouts – Will allow the – Market – Provides – Provides – Creates – Expanded – Provided
Company to consolidation opportunity significant ability to European costume
source up to , widening to earn full sourcing and capture full reach and design and
– Expand international 15% of its company- manufacturi vertical manufacturin enabled sourcing
presence costumes owned retail ng to retail integration g-to-retail direct supply capabilities
and capture territory, margin on synergies, as margin on of latex as well as
the full improve plastic well as balloons balloon additional
Rationale
Significant synergy potential manufacture- management products access to a that PRTY requirements resources in
through leveraging existing to-retail and brand including higher-end manufacture previously the U.K. and
distribution, production and margin on integrity of drinkware, costume s and sells at sourced from European
marketing capabilities these these serveware, customer company- 3rd party markets
products locations, and cutlery owned stores vendors
realize cost
synergies
31You can also read