Vinhomes JSC 1Q2021 Earning Presentation
←
→
Page content transcription
If your browser does not render page correctly, please read the page content below

where happiness lives

Vinhomes JSC                  28 April 2021
1Q2021 Earning Presentation

Disclaimer

Disclaimer
   IMPORTANT: The information contained herein is preliminary and subject to change without notice, its accuracy is not guaranteed,
    has not been independently verified and may not contain all material information concerning Vinhomes Joint Stock Company (the
    “Company”) and its subsidiaries (the “Group”). You should not rely upon it or use it to form the basis for any investment decision or
    commitment whatsoever.
    None of the Company, its shareholders, or any of their respective affiliates, directors, officers, employees, agents, advisers or any
    other person makes any representation or warranty (express or implied) or accepts any responsibility or liability for the accuracy or
    completeness of this presentation or any or all of the information in this presentation or otherwise made available. It is not the intention
    to provide, and you may not rely on these materials as providing, a complete or comprehensive analysis of the financial or trading
    position or prospects of the Group. No part of this presentation shall form the basis of or be relied upon in connection with any contract
    or commitment whatsoever. Further, nothing in this presentation should be construed as constituting legal, business, tax or financial
    advice. You should conduct such independent investigations and analysis of the Group as you deem necessary or appropriate in order
    to make an independent determination of the suitability, merits and consequences of investment in the Company.
    This presentation contains “forward-looking statements”. These forward-looking statements involve known and unknown risks and
    uncertainties, many of which are beyond the Company’s control and all of which are based on management’s current beliefs and
    expectations about future events. Forward-looking statements are sometimes identified by the use of forward-looking terminology such
    as “believe”, “expects”, “may”, “will”, “could”, “should”, “shall”, “risk”, “intends”, “estimates”, “aims”, “targets”, “plans”, “predicts”,
    “continues”, “assumes”, “positioned” or “anticipates” or the negative thereof, other variations thereon or comparable terminology.
    These forward-looking statements include all matters that are not historical facts. Forward-looking statements are not guarantees of
    future performance. These forward-looking statements speak only as at the date of this presentation, and none of the company, its
    shareholders, or any of their respective affiliates, directors, officers, employees, agents, advisers or any other person undertakes to
    update or revise any forward-looking statements as a result of new information or to reflect future events or circumstances.

                                                                                                                                                   1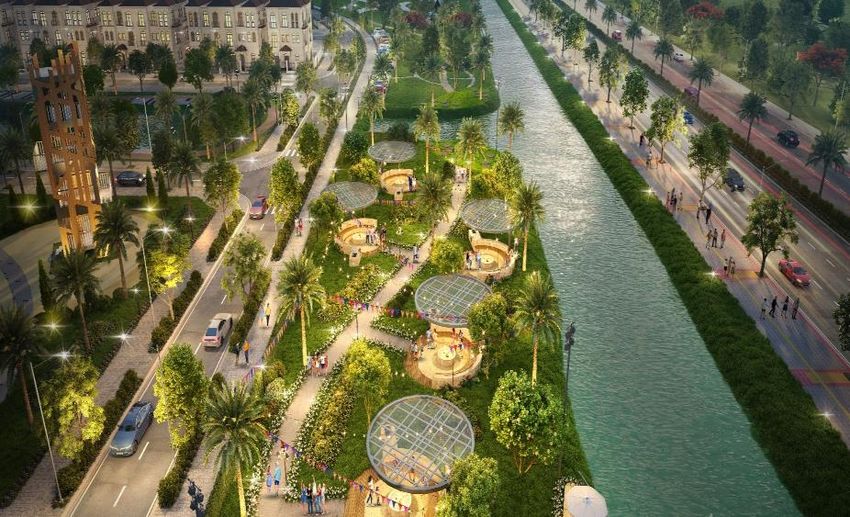
Key Messages

                COVID-19 outbreak well-contained, bolstering market confidence and economic recovery
                • The COVID-19 outbreak in 1Q 2021 was quickly contained. Vietnam’s economy continued its upward climb, surging ahead with a
                  4.48% GDP growth (YoY) for 1Q 2021.
                • Vietnam’s Manufacturing Purchasing Managers’ Index (PMI) reached 53.6 in March 2021 and saw USD 4.7 billion in registered
      1           FDI, the highest monthly print in the past 12 months, reflecting a strong rebound in manufacturing and business confidence
                • New orders increased for the seventh consecutive month at its fastest pace since July 2019. Public investment improved
                  significantly in 1Q, increasing 7.5% YoY and at its highest rate since 2011
                • The accelerating trend of urbanization, coupled with a low-interest rate environment, are expected to drive a strong growth cycle
                  in Vietnam’s real estate

                Robust pre-sales despite the impact of COVID-19 and Lunar New Year
                • Nearly 1,600 units presold to retail customers in 1Q 2021 with a total contracted value of VND 6 trillion (+97% YoY)
     2
                • Condominiums contributed VND 3 trillion (50%) in pre-sales, maintaining a balanced mix of high- and low-rise sales in 1Q
                • Approximately 92% high-rise units sold in 1Q 2021 attributable to Vinhomes Ocean Park and Smart City project

                Healthy backlog maintain revenue and profit recognition momentum
      3         • Around 2,900 retail units delivered in 1Q2021 mostly from mega projects
                • Total converted revenue(1) and profit after tax in 1Q2021 reaching VND 15.6 trillion and VND 5.5 trillion

Note: (1) Converted revenue includes revenue recognition from retail sales, bulk sales sales of BCC projects and revenue from other activities.
Source: IHS Markit, VnEconomy, Company Information.                                                                                               2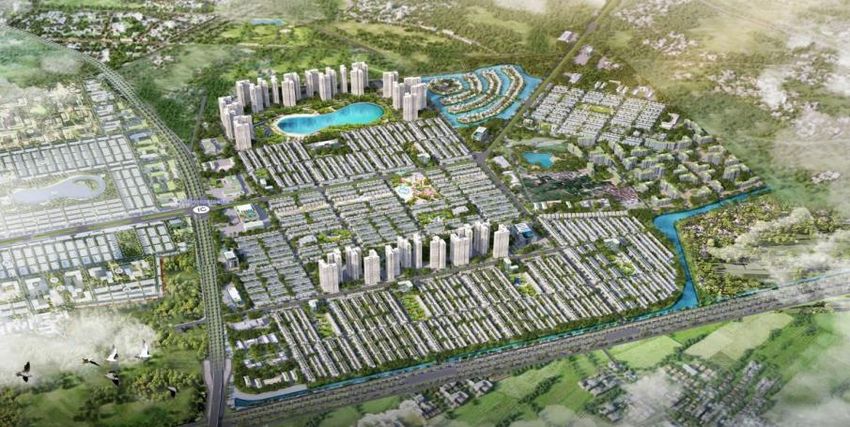
1Q2021 Highlights

                      Retail Units Pre-sold
                         and Deposits                                                                                   New Retail Booking(1)                                                                             Unbilled Bookings(2)
                           secured(1)
                        1Q20                                    1Q21                                                      1Q20                                   1Q21                                                          1Q20                                1Q21

                    1,216                                    1,592                                                      VND                                     VND                                                          VND                                  VND
                    units                                    units                                                     3.1 tn                                 6.0 tn                                                      79.6 tn                              55.4 tn
                                                      31% yoy                                                                                          97% yoy                                                                                            30% yoy

                             Revenue from                                                                                                                                                                                    Profit after Tax &
                                                                                                                                 Gross Profit(3)
                            Property Sales(3)                                                                                                                                                                                Minority Interest
                       1Q20                                     1Q21                                                      1Q20                                      1Q21                                                  1Q20                                     1Q21

                    VND                                      VND                                                       VND                                       VND                                                   VND                                      VND
                    5.7 tn                                  10.0 tn                                                    2.8 tn                                    5.6 tn                                                6.8 tn                                   5.4 tn
                                                      75% yoy                                                                                        103% yoy                                                                                              21% yoy

Note: Based on Vinhomes JSC VAS 1Q2021 unaudited consolidated financial statements. (1) Estimated pre-sale under SPAs and pre-sale bookings under deposits, including BCC projects deposits; (2) Include retail and bulk sales value. Doesn’t include certain bulk sales transactions at
      advanced stage of discussion at the time of reporting; (3) Represents gross profit of property sales only, does not include BCC projects and bulk sales in form of share transfer transactions.                                                                                      3
COVID–19 Update: Vietnam Accelerates its Growth Momentum

                                                                                        Number of COVID-19 Cases

                                                                                                                                               Outbreak in Quang
                       1st wave                                                  2nd wave
                                                                                                                                                Ninh, Hai Duong
     800
                                                                                                                                                      611
     600                                                                                 457
     400
                                                                                                                                             238
     200         97                                                        93                                                                                       61
                                43             0              0                                         1        0                0     2
        0
                 Mar           Apr           May            Jun            Jul           Aug          Sep        Oct             Nov   Dec   Jan      Feb          Mar
                                                                                                   Community Cases

                                                                                  Vietnam Monthly Economic Indicators
                                                                                                                                                            Highest level in the
                                                                                                                                                              past 12 months
  Registered FDI                                                                                                                                                            PMI Index
    (USD bn)
      6.0                                                                                              52        52                    52    51       52            54        60
                                                             51                                                                  50
                                                                            48              46
      5.0         42                           43                                                                                                                             50

      4.0                                                                                                                                                                     40

      3.0                              33                                                                                                                                     30

      2.0                                                                                                                                                                     20

      1.0                                                                                                                                                                     10
                 2.1           3.7            1.6            1.8           3.1            0.7          1.7       2.3             2.9   2.1   2.0      3.5           4.7
      0.0                                                                                                                                                                     -
                 Mar           Apr           May            Jun            Jul           Aug          Sep        Oct             Nov   Dec   Jan      Feb          Mar
                                                                                              Registered FDI         PMI Index

   Despite a third COVID-19 outbreak in 1Q21, Vietnam’s Registered FDI and PMI achieved its highest print over the last 12
                     months, reflecting the country’s strong growth momentum and recovery trajectory

Source: Vietnam Ministry of Health; Fact Set, IHS Markit, GSO Vietnam.
1. A PMI reading above 50 would indicate an overall expansion of the manufacturing economy.                                                                                             4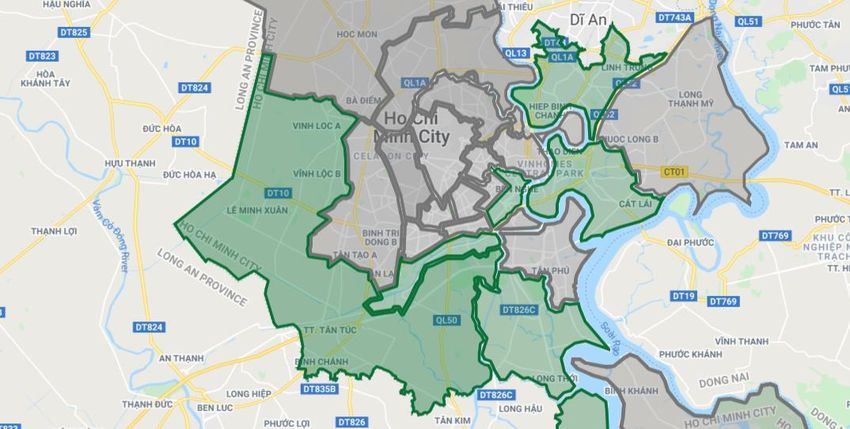
Moving into 2Q 2021

    Market optimism       • Smooth political leadership transition dispels market uncertainty and provides confidence to investors
       amidst new         • Availability of Covid-19 vaccines both in Vietnam and globally as catalysts to restore consumer
       government           confidence and business activities
     leadership and       • Adjustment to the Master plan for Tier 1 cities which includes new urban areas planned and continued
    the availability of     infrastructure investment to increase the rate of urbanization
        COVID-19
                          • Industrial real estate to further benefit from continued inflows of FDI inflow and supply
        vaccines
                            chain/manufacturing diversion into Vietnam

     Vinhomes’ new
       projects to        • Vinhomes’ new launches, most notably Dream City (Ocean Park 2) and Wonder Park in 2H 2021, are
        leverage            well-timed to take advantage of the market recovery
     market tailwind      • 3 mega projects (Ocean Park, Smart City, Grand Park) to continue their sales momentum to the end of
     and drive sales        2021
      performance

      Rolling out of
                          • O2O (online to offline) sales model roll out offers a seamless customer journey across multiple platforms
     O2O sales model        as Vinhomes strives to deliver a best-in-class customer experience
      and creating a      • Promoting a green and smart ecosystem with the introduction of Vinbus and EV charging stations at
        smart and           Vinhomes projects
       sustainable
                          • Technopark in Vinhomes Ocean Park to apply LEED premium certification for sustainability
       ecosystem
                            achievement, welcoming tenants in 2Q 2021

                                                                                                                                        5
where happiness lives

1Q2021 Market Updates
Hanoi – High Absorption Rate Affirms Robust Recovery

                                                  ASP trending higher in 1Q 2021, signaling improving market sentiment

                Sold units: 4,156                                                                                                                             Launched units: 4,421
                      44%                94%                                 Sold Units         Launched Units                                                     39%      170%
                      QoQ                YoY                                                                                                                       QoQ       YoY
     15,000
                                                                                               15,000

     10,000
                                                                                               10,000

      5,000                                                                                     5,000

            0                                                                                       0
                 Q1 Q2 Q3 Q4 Q1 Q2 Q3 Q4 Q1 Q2 Q3 Q4 Q1 Q2 Q3 Q4 Q1                                     Q1 Q2 Q3 Q4 Q1 Q2 Q3 Q4 Q1 Q2 Q3 Q4 Q1 Q2 Q3 Q4 Q1
                        2017                    2018               2019     2020      2021                 2017              2018                 2019                 2020         2021

 Hanoi Condominium Market – Average Selling Price (1)                                                                    Affordable      Mid-end         High-end

                                                                          2,500
                                                               9% QoQ
           High-end                                                       2,000
                                                               18% YoY
                                                                          1,500

                                                                          1,000
                                                               1% QoQ
            Mid-end                                                        500
                                                               5% YoY
                                                                             -
                                                                                   Q1 Q2 Q3 Q4 Q1 Q2 Q3 Q4 Q1 Q2 Q3 Q4 Q1 Q2 Q3 Q4 Q1 Q2 Q3 Q4 Q1 Q2 Q3 Q4 Q1
                                                               5% QoQ                 2015          2016          2017                2018               2019               2020         2021
         Affordable
                                                               10% YoY                       High-end                     Mid-end                             Affordable
Source: CBRE Research, 1Q 2021                                                                                                                                    HIGH-END: US$2,000 – 4,000 psm
(1) Selling price: US$ psm (excluding VAT and quoted on NSA)                                                                          MID-END: US$1,000 – 2,000 psm AFFORDABLE: < US$1,000 psm
                                                                                                                                                                                                   7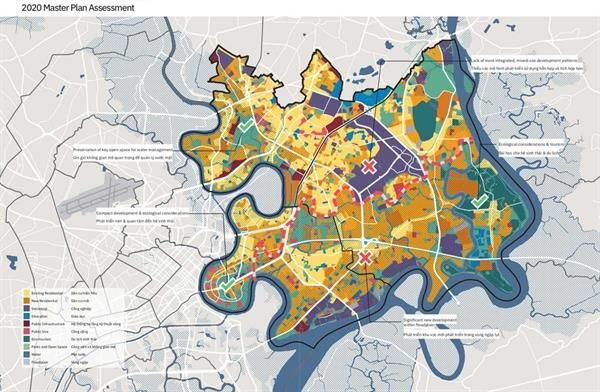
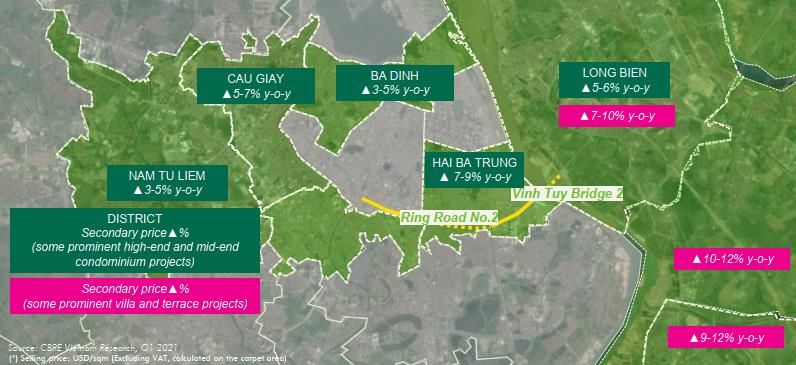
Hanoi – Thriving Secondary Market and Expansion of New Supply in Suburban Areas

              Increasing Secondary Prices in the Affordable Segment                                                   Strong Price Increases in Infrastructure Development Areas
                                          Q1 2019         Q1 2020        Q1 2021

                                          Change 1-3% YoY
    US$ psm

                                                                                               7% comp      8% comp
                                                                                                2019         2019

                  Strong YoY Growth in Supply in Outer Districts
                                                                                                                        • Price in suburban areas and projects near close-to-
    The East region was the                          270%
     leading contributor to                                                                                               completion infrastructure picked up rapidly in the
                                                      YoY
    new supply, followed by
      the West and South
                                                                                                                          secondary market
            regions
                                                                                                                        • New supply concentrated at locations outside of core
                                                                                                                          districts

Source: CBRE Research, 1Q 2021
Note: (1) Average secondary price, including land and construction cost, excluding VAT, and quoted on NSA                                                                          8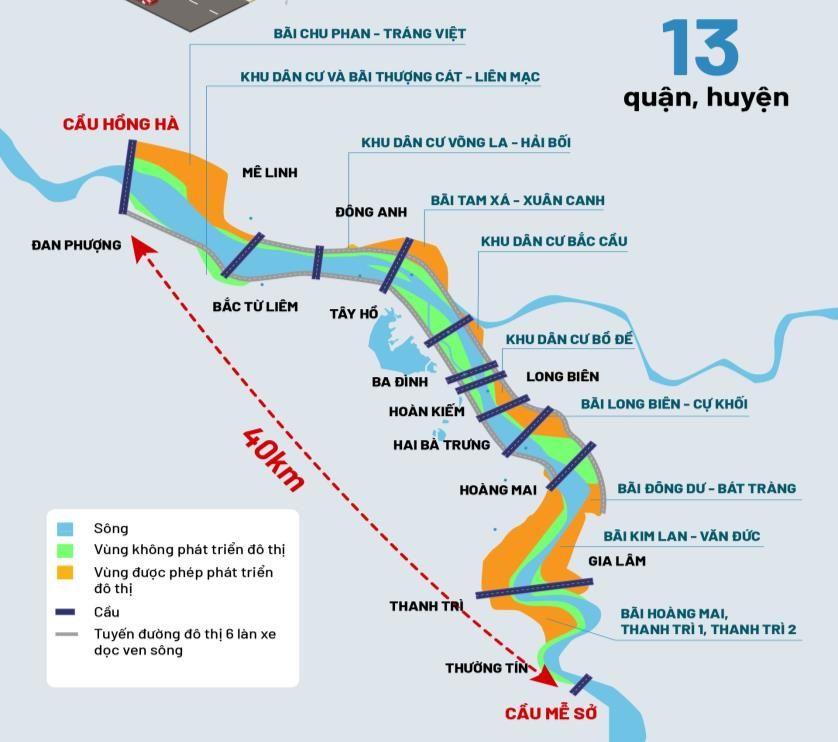
HCMC – Supply Shortage Across All Segments

                HCMC Condominium units sold in 1Q2021 outstripped launched units, depleting the current market supply

       Sold units: 2,624                                                     Sold Units               Launched Units                                        Launched units: 1,709
               48%               30%                                                                                                                                 74%            53%
               QoQ               YoY                                                                                                                                 QoQ            YoY
   15,000
                                                                                                     15,000

   10,000
                                                                                                     10,000

     5,000                                                                                            5,000

           0                                                                                             0
                Q1 Q2 Q3 Q4 Q1 Q2 Q3 Q4 Q1 Q2 Q3 Q4 Q1 Q2 Q3 Q4 Q1                                            Q1 Q2 Q3 Q4 Q1 Q2 Q3 Q4 Q1 Q2 Q3 Q4 Q1 Q2 Q3 Q4 Q1
                        2017                     2018              2019   2020       2021                          2017              2018               2019               2020         2021

      HCMC Condominium Market – Average Selling Price (1)                                                               Affordable        Mid-end       High-end          Luxury

                                                                             8,000
                                                               2.4% QoQ
                                                                             7,000
                 Luxury                                        4.7% YoY      6,000
                                                                             5,000
                                                               2.2% QoQ      4,000
               High-end
                                                               0.6% YoY      3,000
                                                                             2,000
                                                               1.6% QoQ      1,000
                 Mid-end
                                                               6.4% YoY          0
                                                                                     Q1     Q2   Q3     Q4    Q1   Q2     Q3   Q4    Q1     Q2   Q3    Q4      Q1    Q2    Q3     Q4    Q1
                                                                                             2017                   2018                     2019                      2020            2021
                                                               2.1% QoQ
               Affordable
                                                               1.6% YoY                     Luxury                 High-end                  Mid-end                   Affordable
Source: CBRE Research, 1Q 2021                                                                                                           LUXURY: >US$4,000 psm HIGH-END: US$2,000 – 4,000 psm
(1) Selling price: US$ psm (excluding VAT and quoted on NSA)                                                                         MID-END: US$1,000 – 2,000 psm AFFORDABLE: < US$1,000 psm
                                                                                                                                                                                                9
HCMC – Ongoing Development in Neighbor Provinces and New Thu Duc City
Strong Secondary Price Increases in New Development Areas HCMC Landed Property Prices Over the Years
6,000 1Q 2019 1Q 2020 1Q 2021
6,500 ▲ 7% y-o-y
Change 1-10% YoY
5,000 5,500
Primary price (US$ psm)
4,000 4,500 ▲ 2% y-o-y
US$ psm
3,500
3,000
128% comp 21% comp 2,500 ▲ 5% y-o-y
2019 2019
2,000
1,500
1,000 500
(500) Q1 Q2 Q3 Q4 Q1 Q2 Q3 Q4 Q1
0
District 1 Binh Thanh District 2 District 9 Nha Be 2019 2020 2021
Villa Townhouse Shophouse
New Supply Locations
• New development areas had a large step up in
New supply is still
concentrated in the EAST 1
5
secondary prices over the years, notably District 9
East driven by
ongoing • Townhouses and Shophouses are the preferred landed
3
urbanization 1
property formats as opposed to villas
2
projects in Thu Duc,
Dong Nai and Binh
6
• Similar to Hanoi, HCMC’s new supply also originates
Duong
7 from projects located outside of core districts, particularly
4 in the East
Landed Properties: 1 Luxury: 3 projects Mid-end: 2 projects
project High-end: 2 projects Affordable: NA
Source: CBRE Research, 1Q 2021 LUXURY: >US$4,000 psm HIGH-END: US$2,000 – 4,000 psm
MID-END: US$1,000 – 2,000 psm AFFORDABLE: < US$1,000 psm
Note: (1) Average secondary price, including land and construction cost, excluding VAT 10Vinhomes’ Continued Dominance in Vietnam’s Residential Market
25% Market Share in Vietnam across ALL 33% Market Share in Vietnam in the MID-END
Condominium Segments (2016 – 1Q 2021) Condominium Segment (2019 – 1Q 2021)
Vingroup
25%
Vingroup
Developer A
33%
Developer A
Developer B
Developer B
3% Developer C
3% 56% Developer C
65% 2%
2% Developer D
3% Developer D
2%
Others 2% Others
4%
44% Market Share in Vietnam in the HIGH-END 21% Market Share in Vietnam in the LANDED
Condominium Segment (2016 – 1Q 2021) PROPERTIES Segment (2016 – 1Q 2021)
21%
Vingroup Vingroup
38% Developer A Developer A
44%
7%
Developer B Developer B
59% 6%
Developer C Developer C
4%
Developer D Developer D
3% 3%
4%
5% 6% Others Others
Source: CBRE Research, 1Q 2021
11Master Plans Continue to Drive Ongoing Development Plans
Red River Master Plan Chu Phan- Trang Viet
Thuong Cat – Lien Mac
DISTRICTS
HONG HA BRIDGE
Vong La – Hai Boi
• 12 bridges across Red River Me Linh
Tam Xa - Xuan Canh
• 6-lane riverside road Dong Anh
Bac Cau
• 6 riverside areas with total area of 1,998 ha for new urban Dan Phuong
area/public construction
North Tu Liem Tay Ho
• Tentative approval: June 2021 Bo De
Long Bien
Ba Dinh
Moving out from Core Districts Hoan Kiem
Long Bien – Cu Khoi
Hai Ba Trung
Hoang Mai Dong Du – Bat Trang
Red River Kim Lan – Van Duc
Not develop urban area
Gia Lam
To develop urban area
• Move residences and State Agencies offices at Old Quarter, Thanh Tri Hoang Mai,
Bridge
universities, hospitals out of Hanoi center 6 lane road along with Thanh Tri 1,Thanh Tri 2
• Develop new area at North of Red River, East of Ring Road 4 for the river
Thuong Tin
relocation
ME SO BRIDGE
HCMC Review Master Plan
Northwestern Urban
Area Attraction
• Propose infrastructure development plan for new
areas: Thu Duc City, Hiep Phuoc Port, North
West Urban area, Binh Quoi-Thanh Da, Can
Gio
• Relocate industrial facilities outside of city,
promoting high technology industry
Source: CBRE Research, 1Q 2021
12Industrial – Vietnam Capitalizes on Manufacturing Shift to Attract Further Investment
Vietnam Passed New Law on Investment in Jan 2021 Supply Chain Restructuring: Shift to Vietnam
• The New Law on Investment and Law on Enterprise came into
effect on 1 Jan 2021, providing further incentives for foreign
investment
• Foreign investment in 1Q 2021 grew YoY by 18.5% to
$10.13bn, with 243 new projects recorded. Notable projects
include manufacturing relocations by Foxconn, JA Solar, and
Everwin as well as a local expansion project by Nikkei Asia
Manufacturing Relocation
Project Registered Capital Province
Fukang (Foxconn) $270mn Bac Giang
Top Provinces in Drawing Investment 1Q 2021 (1)
JA Solar $210mn Bac Giang
Accumulated Registered Capital Q1
Everwin $200mn Nghe An
946
$10.13bn 18.5%YoY
Registered Capital
679 649
446
Local Expansion
431 420
$mn
Hai Phong HCMC Bac Giang Binh Duong Daklak Tay Ninh
Source: FIA and Company research
1. Exclusive LNG projects in Long An, Can Tho
13where happiness lives 1Q2021 Operational Updates
Roll-out of Innovative Platforms to Drive Digital Transformation

                                                               Launch of the Online                         Introduction of O2O
              VHM Sales Agent App                                Leasing Platform                             Business Model

  • The VHM Sales Agent App equips                     • In March 2021, Vinhomes launched its       • In January 2021, Vinhomes
      sales agents with a smart, convenient              e-commerce leasing website                   announced its Online-to-Offline (O2O)
      and transparent platform to access                 https://stay.vinhomes.vn/                    business model
      updated information about new                    • Attractive promotions offered for first-   • An important milestone in the digital
      launches and existing projects                     time customers to lease Vinhomes’            transformation of the Company’s
                                                         serviced apartments through this             ecosystem covering sale, lease, and
                                                         platform                                     transfer

                               Vinhomes’ digital transformation to create an ecosystem that will enhance customer
                                                       engagement and build brand loyalty

Source: Company Information.
                                                                                                                                         15
Sales Mobile App as Supporting Tools for Agents
Intuitive UI Real Time Unit Description
Design Inventory Display (e.g. floor plan)
• Better experience not only for the
end-buyers but also for sales
agents
• VHM Sales Agent App is a smart
and convenient platform to provide
o News and information
about new launches and
existing projects
o Real-time availability of
inventory and prices
• Building a sustainable and
transparent market, benefitting all
stakeholders
2021 Target number of users
120 Agencies
20,000 Salespersons
Source: Company Information
16Promoting Green Initiatives and Sustainability within the Vinhomes Community
Technopark
VinBus Operations Charging Stations Green Office Building
• The very first electric bus Vinbus • Development of charging stations for • Technopark, our newest 43-storey
manufactured by VinFast started test- electric vehicles at Vinhomes’ urban office building in Ocean Park was
running in Vinhomes Ocean Park areas designed and operated according to
(Hanoi) the most rigorous criteria of LEED
Platinum certification, focusing on
Green – Smart – Wellness
Vinhomes remain committed towards green initiatives and sustainable development
Source: Company Information.
17Implementing Connected Smart City Solutions
Transportation Security
• Electric public Buses • Smart Traffic
• Smart Fire Alarm System
• Smart Camera
• Smart Access control
• Air Quality Monitoring
Community Management
• VinID Resident App • Smart Intercom
• AI Camera Facial • Smart Parking
Recognition • Smart City Hub
• Cashless Payment via • Smart Staff Management
App
• Central Command Centre
Home and Devices
• Smart Home
• Highly advanced comprehensive smart city solutions developed by VinSmart integrated into Vinhomes existing mega projects
• Pioneer of the smart city concept, first in SEA to implement comprehensive smart city of this scale, providing an unrivalled experience
to residents
Source: Company Information
18Exciting Sales & Marketing Activities and Recent Awards
Vinhomes Maintains its
Handover of the Manhattan’s Position as Vietnam’s Most
Lunar New Year Festival at First Units at Vinhomes Reputable Property Vinhomes Grand Park
Vinhomes Smart City Grand Park Developer Honored Excellent Agents
• In Jan 2021, a Spring • On 20 Mar 2021, the first • In Mar 2021, Vietnam • In Jan 2021, all 61 agents of
festival was held at villa and shophouse units at Report published the list of the Vinhomes Grand Park
Vinhomes Smart City The Manhattan – Vinhomes Top 10 most reputable project were invited to an
• Residents and visitors Grand Park project – were companies in the real year end party
enjoyed entertainment delivered to their owners estate sector in 2021 • An award ceremony was
activities representing • The Manhattan was sold out held to celebrate top
different Asian national within only 8 days and • Vinhomes once again was performance amongst all
cultures: Vietnam, Japan, completed in only 10 ranked No. 1, marking the Vinhomes agents nation-
Korea, and Hong Kong months. company’s 7th consecutive wide
year at this position
Strong commitment to delivery and smart and healthy lifestyle bolster Vinhomes reputation, gaining market
recognition
Source: Company Information
19Overview of Launched Projects
Project Name Vinhomes Ocean Park Vinhomes Smart City Vinhomes Grand Park
Total NSA (sqm) (1) 3,500,000 2,601,000 3,241,000
47,200 47,000 45,500
31,300 39,300
Cumulative Units Sold and
26,800 8,600
Delivered / To Be Delivered as 2,600
5,300
of 31 March 2021 (2)
30,700
28,700 21,500
Units sold Total units Units sold Total units Units sold Total units
Delivered To be delivered Total
Unbilled Sales (3)
13,435 10,110 29,405
(VND billion)
Construction progress 63% 38% 57%
Notes: (1) Numbers are rounded to the nearest ’000 (2) Numbers are rounded to the nearest ’00 and subject to design change in bulk sales transactions (3) Numbers are rounded to the nearest ’0
20New Project Launches in 2021
Vinhomes Dream City (Ocean Park 2) Vinhomes Wonder Park
Located at West of Hanoi and connected rapidly with My Dinh, Cau Giay,
Vinhomes Dream City is conveniently located next to Vinhomes Ocean
Ba Dinh, Hoan Kiem by metro line. The project will include parks complex
Park and will create a lively suburban community served by a complete
with high-end residential villas and townhouses – a model for ecological
ecosystem of life-essential products and services
urban living
Description Mega mixed-use integrated residential and Description Mega mixed-use integrated residential and commercial
commercial project project
Location Van Giang, Hung Yen Location Dan Phuong, Hanoi
Total project area (including
infrastructure)
~460ha Site Area ~133ha
Total Residential GFA(1) Key Components Apartments/Villas /Townhouses /Schools /Shopping Mall/
7,853,000 sqm
Eco-parks/Swimming Complex
Key Components Apartments / Villas / Shophouses / Schools / 16ha grand ecological park
Hospitals / Shopping Malls Vietnam’s biggest swimming pool complex (indoor and
outdoor)
Conveniently Located Ecosystem of Life-
Fast Track Connect Model for Ecological
next to Vinhomes Ocean essential Products And Urban Living
with Core Districts
Park Services
.
21where happiness lives 1Q2021 Financial Highlights
1Q2021 Highlights

                                                                                Vinhomes Projects (Consolidated)                                                                                   BCC Projects (Equity Accounting)

                                                           • Total: VND 10.0 tn                                                                                               • Total amount: VND 0.2 tn
                     Revenue from                          • Key contributors:                                                                                                • Key contributors:
           1
                     Property Sales                          − VH Ocean Park: VND 6.1 tn                                                                                        − VH Star City:    VND 0.1 tn
                                                             − VH Grand Park: VND 1.5 tn                                                                                        − VH Imperia:      VND 0.1 tn
                                                             − VH Smart City: VND 1.3 tn
                                                             − VH Symphony: VND 0.5 tn

                   Gross Profit &                          • Gross profit: VND 5.6 tn                                                                                         • Gross profit: VND 0.1 tn
            2       Margin from
                  Property Sales (1)                       • Gross profit margin: 56%                                                                                         • Gross profit margin: 56%

                                                           • Profit before tax was VND 7.1 tn, -30% yoy, in which VND 7 tn (2) was Vinhomes projects and VND 0.1 tn was from BCC projects
                        PBT, PAT &                         • Consolidated profit after tax was VND 5.5 tn, -28% yoy
            4
                          PATMI                            • Consolidated PATMI was VND 5.4 tn, -21% yoy

                                                           • Total number of pre-sold units : 1,566 units                                                                     • Total number of pre-sold units: 26 units
            5           Pre-sales           (3)
                                                           • Pre-sales value: VND 5.7 tn                                                                                      • Pre-sales value: VND 0.3 tn
                                                           • Unbilled pre-sales: VND 54.3 tn                                                                                  • Unbilled pre-sales: VND 1.1 tn

Notes: Based on Vinhomes JSC VAS 1Q2021 consolidated financial statements. YoY comparison is with Vinhomes JSC VAS 1Q2020 consolidated financial statements. (1) Represents gross profit of property sales only (2) Includes the recognition of bulk sales at Vinhomes Grand
       Park project (3) Estimated pre-sale under SPAs and pre-sale secured under non-cancellable deposits under both retail and bulk sales.
                                                                                                                                                                                                                                                                               23
Financial Performance 1Q2021 vs 1Q2020
Figures in VND bn 1Q2020(1) 1Q2021 (1) Change (%) Key Commentary
• Sale of inventory properties increase 75% thanks to great number of
(2) apartments handed over at Vinhomes Ocean Park and Vinhomes Grand Park
Sale of Inventory Properties 5,717 10,016 75%
projects in 1Q2021 and a recognition of VND 2,900 billion bulk sale
transaction with a local developer
Other Revenue 802 2,971 270%
Total Revenue 6,519 12,986 99%
Gross Profit 2,949 6,212 111%
% Margin 45% 48% 260 bps
• Profit distribution from BCC projects is contributed by Vinhomes Star City and
Vinhomes Imperia
Profit sharing from BCC projects 411 93 -77%
• Profit distribution reduced as BCC projects completed their hand-over
process
Other finance income 8,180 2,214 -73% • 1Q2020 recognized a significant gain of bulk sales at Vinhomes Grand Park
Operating Profit 10,128 7,054 -30%
Profit before Tax 10,124 7,085 -30%
Profit After Tax 7,645 5,478 -28%
Profit after Tax and Minority Interest 6,844 5,396 -21%
Note: (1) Based on Vinhomes JSC VAS 1Q2021 consolidated financial statements. YoY comparison is with Vinhomes JSC VAS 1Q2020 consolidated financial statements; (2) Does not include BCC projects which is recorded as finance Income
24Financial Performance 1Q2021 (Vinhomes Projects & BCC Projects)
Summary BCC Project Performance and Reconciliation
The Harmony Imperia Thanh Hoa Skylake
Figures in VND bn (Hanoi, low-rise) (Hai Phong, low-rise) (Thanh Hoa, Low-rise) (Hanoi, High-rise) Total BCC projects
Revenue - 61 155 - 216
Cost of Sale - (24) (71) - (95)
Gross Profit - 37 84 - 121
% Margin - 61% 54% - 56%
SG&A - (4) (7) - (11)
Profit attributable - 33 61 - 94
Profit attributable to Vinhomes (99%) - 33 60 - 93
Adding Performance of BCC into Vinhomes P&L Assuming Full Consolidation
Figures in VND bn Adjusted 1Q2021 VHM 1Q2021 BCC Projects Total Adjusted 1Q2021
(1)
Sale of Inventory Properties 12,424 216 12,640
Other Revenue 2,971 - 2,971
Total Revenue 15,395 216 15,611
Cost of Sale (7,486) (95) (7,581)
Gross Profit 7,909 121 8,030
Profit sharing from BCC projects 93 (93) -
Operating Profit 7,054 - 7,060
Profit before Tax 7,085 - 7,085
Profit for the Period 5,478 - 5,478
Profit after Tax and Minority Interest 5,396 - 5,396
(*) Due to delays in regulatory approval processes, a number of pipeline projects may have to be developed under BCC format.
Note: Based on Vinhomes JSC VAS 1Q2021 unaudited consolidated financial statements and management accounts of the BCC projects. (1) Adjusted finance performance includes gain from bulk sales in the form of share transfer transaction, which was recognized as financial
income in financial statements.
251Q2021 Financial Performance Overview
Financial Performance Overview
Total Revenue Gross Profit and Gross Profit Margin
(VND bn)
(VND bn) 44.6% 46.1%
71,548 48.1% 55.8%
3,340 27,456 25,936
51,627
38,664 898
191 346
2,352
603 495
2,079 1,114
10,061
816 67,310 12,986 6,212
48,162 6,519 290 26,662 2,949
2,616 25,095 457
35,769 524 244 74
354 163
278 9,527 124
5,717 10,016 2,751 5,592
2018 2019 2020 1Q2020 1Q2021 2018 2019 2020 1Q2020 1Q2021
(1) (1) Margin for Sale of
Margin for Leasing
Sale of inventory property Leasing Others Sale of inventory property Leasing Others Inventory Properties
Profit before Tax Profit after Tax and Minority Interest
(VND bn) (VND bn)
36,517
29,746 27,351
21,747
19,719
14,284
10,124
7,085 6,844 5,396
2018 2019 2020 1Q2020 1Q2021 2018 2019 2020 1Q2020 1Q2021
Note: Based on VAS Audited Consolidated Financial Statements for 2018, 2019, 2020 and Unaudited Consolidated Financial Statements for 1Q2021 (1) Includes revenue from general contractor services, shared profit from VCR, Vinschool, Vinpearl (until such components are
completely transferred to those respective Vingroup’s subsidiaries) and others
261Q2021 Financial Performance Overview
Financial Performance Overview (adjusted)
Total Adjusted Revenue Adjusted Gross Profit and Gross Profit Margin
(VND bn) (VND bn)
29.9% 54.1% 55.1% 44.6% 46.1%
98,746 31.2% 54.2% 45.6% 61.0% 58.6%
43,928
74,863 3,340 35,281 346
67,084 898 495
2,079 191
22,959
816 2,352 603
1,114 18,535 290 11,013
94,508 15,611 8,029
244 43,087
71,968 524 2,617 34,487 74
63,618 124 457
278 354 22,425 163
17,733 12,640 10,815 7,409
2018 2019 2020 1Q2020 1Q2021 2018 2019 (1) 2020 1Q2020 1Q2021
(1) (2) (2) Margin for Sale of
Sale of Inventory Properties
(1)
Leasing Others Sale of Inventory Properties Leasing Others Margin for Leasing
Inventory Properties
Adjusted EBITDA and Margin Adjusted PATMI
(VND bn) (VND bn)
Margin 29.9%(3) 47.4% 40.6% 58.5% 50.9%
27,351
21,747
40,060
32,475 14,284
22,363
10,834 6,844 5,396
7,941
2018 2019 2020 1Q2020 1Q2021 2018 2019 2020 1Q2020 1Q2021
PATMI
EBITDA Adjusted EBITDA Margin
Notes: The financials as presented above are illustrative and based on the arithmetic aggregation of (i) Vinhomes JSC audited general purpose financials for FY2018-2020, (ii) Excluded Projects financials for FY2018-2010 and (iii) Unaudited Consolidated Financial Statements 1Q2021. (1): Adjusted for Revenue and Gross profit of BCC projects and bulk sales
recognized as finance income. (2) Others principally comprises revenue from general contractor services, shared profit from VCR, Vinschool and Vinpearl and others
27Balance Sheet Overview
Total Assets Inventory
Balance Sheet Overview
VND bn VND bn
215,326
197,241 207,714
60,297
57,686
113,014
113,671
119,689 42,984 41,596
36,858
28,486
139,555
91,203 102,312 94,043
31-Dec-18 31-Dec-19 31-Dec-20 31-Mar-21 31-Dec-18 31-Dec-19 31-Dec-20 31-Mar-21
Current Assets Non-current Assets
Total Cash & Cash Equivalents(1) and Total Borrowings Total Equity
VND bn VND bn
31,909
94,605
26,505 89,130
24,955
23,096
64,715
13,693 15,768 48,145
9,542
4,525
31-Dec-18 31-Dec-19 31-Dec-20 31-Mar-21 31-Dec-18 31-Dec-19 31-Dec-20 31-Mar-21
Total Borrowings Cash and Cash Equivalents
Note: Based on VAS Audited Consolidated Financial Statements for 2018, 2019, 2020 and Unaudited Consolidated Financial Statements for 1Q2021.
(1) Cash and cash equivalents includes short-term investments.
28Key Credit Metrics
Net Debt(1) / (Total Assets – Cash & Cash Equivalent(2)) Net Debt(1) / Equity
7.0% 6.8%
19.8%
4.6% 14.3%
10.3%
31-Dec-19 31-Dec-20 31-Mar-21 31-Dec-19 31-Dec-20 31-Mar-21
Total Debt / Total Assets Interest Coverage Ratio(3)
Times
13.4% 17.4
11.6% 11.1%
12.9
31-Dec-19 31-Dec-20 31-Mar-21 1Q2020 1Q2021
Notes: Based on VAS Audited Consolidated Financial Statements for 2019, 2020 and Unaudited Consolidated Financial Statements for 1Q2021
(1) Net Debt = (Short-term Borrowings + Long-term Borrowings) – Cash & Cash Equivalent. (2) Cash and cash equivalents includes short-term investments. (3) Interest coverage ratio = EBIT/Interest Expense
29Debt Profile
01 Total debt breakdown by funding sources 02 Total debt breakdown by currency Total debt breakdown by interest rate
03
VND
99.4% Fixed
Domestic 28.7%
Floating
bond
71.3%
68.7%
VND23 tn VND23 tn VND23 tn
Other
26.2%
USD
0.6%
Bank loans
5.1%
Domestic bond Bank loans Other VND USD Floating Fixed
Debt maturity (VNDbn)
04
Corporate bond Bank borrowings & others
13,534
9,365 Average debt
6,136
898 maturity:
1.34 years
8,467 7,398
196
–
Less than 1 year 1-3 years 3-5 years
Source: Unaudited VAS Consolidated Financial Statements for 1Q2021.
.
30where happiness lives Appendix Additional Materials
Continued Support from Customers and Mortgage Lenders

                                                                                                                                                          Proportion of sold units with a mortgage

                                                                 FOREIGN BUYERS(1)                                                                                                                                        MORTGAGES
                                                                                           7%                                                                                                                                          67%

                                                                                                                                                          • Projects with high number of sold units with a mortgage were
                                                                                                                     Percentage of                                                             Vinhomes Ocean Vinhomes Smart Vinhomes Grand
                  Project                                         Selling points                                                                                                                    Park           City           Park
                                                                                                                     foreign buyers
                        Vinhomes Golden River is constructed                                                                                                   Percentage (%)                             68%                             69%                              83%
                        along the Saigon river, in the heart of
        Vinhomes Golden District 1. The area is expected to become
                                                                                                                              28%
          River (HCMC)  home to new office skyscrapers,                                                                                                   • Proportion of sold units with a mortgage depends on clients’ preferences,
                        commercial centers, and beautiful
                                                                                                                                                               locations and sales policy
                        riverside walks
                                          Situated in the West of Hanoi, Vinhomes                                                                         • Vinhomes homebuyers often enjoy favorable interest rates relative to the
            PERCENTAGE OF FOREIGN BUYERS
                          West Point       DECLINED
                                     has been          BY 127
                                                developed   to BPS
                                                               set aFROM 31 DEC 18                                                                             market thanks to good relationships between Vinhomes (as the project
          Vinhomes  West OF VINHOMES SAPPHIRE APARTMENT UNITS ARE MOSTLY
           BECAUSE BUYERS new standard of living, with its harmonious         22%                                                                              developer) and large banks
           Point (Hanoi)          DOMESTIC    BUYERS
                          combination of water, trees and “All-in-
                                          one” facilities
                                                                                                                                                          • Interest supports offered to homebuyers by developers for 18 to 24 months,
                                                                                                                                                               and a grace period for principal payments during the period of interest
                                          A mixed use development in Nam Tu Liem
               Vinhomes                   new administrative area of Hanoi. It is                                                                              support
                Skylake                   adjacent and looks over the 32-hectare                                              14%                         • Vinhomes Ocean Park, Vinhomes Smart City, and Vinhomes Grand
                (Hanoi)                   Cau Giay park, with 19-hectare water                                                                                 Park buyers can take out a mortgage of up to 35 years.
                                          surface reservoir

Notes: Data as of 31 March 2021 (1) for all units sold in Vinhomes projects from the incorporation of the residential business in Vingroup until 31 March 2021, excluding projects launched before 2015 (i.e. Vinhomes Royal City and Vinhomes Times City) when foreign buyers were not
allowed to buy houses in Vietnam
                                                                                                                                                                                                                                                                                          32
where happiness lives Investor Relations Department Headquarters: No.7, Bang Lang 1, Vinhomes Riverside, Viet Hung Ward, Long Bien District, Hanoi, Vietnam Tel: +84 (24) 3974 9999 ext. 9462 Website: http://ir.vinhomes.vn/en Fax: +84 (24) 3974 8888 E-mail: ir@vinhomes.vn
You can also read