2016 FULL YEAR INVESTOR PRESENTATION - AVENTUS RETAIL PROPERTY FUND - Open Briefing
←
→
Page content transcription
If your browser does not render page correctly, please read the page content below
2016
            FULL YEAR INVESTOR PRESENTATION
            AVENTUS RETAIL PROPERTY FUND
            18 AUGUST 2016
                                              DARREN HOLLAND, CEO
                                              LAWRENCE WONG, CFO

Belrose Super Centre, NSW
Contents

Kotara Home South, NSW        Belrose Super Centre, NSW

   03 Strategy                  28 Outlook
   04 Key Achievements          31 Appendix 1 – Portfolio Summary
   05 Portfolio Performance     33 Appendix 2 – Industry Dynamics
   15 Financial Results
   20 Acquisitions
   23 Development
Delivering on Strategy
                             The Fund is implementing its four key growth initiatives to drive long term
                                          value creation and sustainable earnings growth

              Portfolio                            Development                    Consolidation                    Potential Benefits from
              Management                           Pipeline                       Opportunities                    Zoning & Planning Reforms

              Optimise and broaden the             Identify and deliver value     Selective acquisitions to        Take advantage of regulatory
                                                                                  enhance the Fund’s portfolio
 Initiative

              tenancy mix through                  enhancing development                                           reforms in zoning and planning
              proactive leasing, leveraging        opportunities within the       and entrench the Fund as the     regimes for the existing portfolio
              retailer relationships and           existing portfolio             leading pure-play LFR landlord
              delivering operational                                              in Australia
              excellence

              The portfolio continues to           Completion of revitalisation   Acquired seven centres valued    Acted on recent reforms in Victoria
              perform well with high               of Tuggerah Super Centre,      at $265.4m, growing the Fund’s   resulting in the introduction of an
 Outcome

              occupancy, positive leasing          expansion of Peninsula         portfolio to $1.3bn and LFR      Aldi supermarket to Peninsula
              spreads and low incentives           Home and gaining planning      centre ownership market share    Home, with active work through the
                                                   approvals for three            (by GLA) to 12%                  Large Format Retail Association for
                                                   developments to expand the                                      more flexible zoning in other states
                                                   development pipeline

Aventus Retail Property Fund | Full Year Results | 30 June 2016                                                                                           3
Key Achievements

                                              PORTFOLIO EXPANSION AND SUSTAINABLE INCOME GROWTH

             FY16 Financial Highlights                                                     Capital Management                                        Portfolio Performance

                          $41.0m                                                      35.7% gearing                                             97.7% occupancy
            Funds From Operations (FFO)1
                                                                                    within target range of 30% - 40%                               improved 50 bps from 97.2%2

                        11.7 cpu                                                              $2.02 NTA                                               $265.4m in
                    FFO per unit1
             up 4.5% from PDS of 11.2 cpu
                                                                                               per unit                                              acquisitions
                                                                                up 6.9% from $1.89 per unit at Dec 15                                 with seven new centres

                            24.7%                                                                      3.2%                                       $86.5m or 9.6%
         total annualised unitholder                    return3                       forecast cost of debt for FY17                            centre valuation uplift on 14 centres4

1.   For the period post IPO from 20 Oct 15 to 30 Jun 16
2.   Post acquisition as at May 2016 Entitlement Offer
3.   Source: Bloomberg
4.   Movement excludes revaluation adjustments relating to straight-lining of rental income and capitalisation of leasing and borrowing costs

Aventus Retail Property Fund | Full Year Results | 30 June 2016                                                                                                                          4
1. PORTFOLIO PERFORMANCE

Logan Super Centre, QLD
                                        5
Portfolio Achievements

                            FOCUSED ON OPERATIONAL EXCELLENCE AND INCOME OPPORTUNITIES

           STABLE WALE                                               33% NON-                      Approximately
               OF 4.1 years                                       HOUSEHOLD USES                     1.1m sqm
      compared to 3.8 years at Mar 16                                up from 31% at Dec 15             of land nationally

                                                                                                       84%
                 80% OF                                            PORTFOLIO VALUE              NATIONAL RETAILERS
               ALL LEASES                                            OF $1,273m
     have annual fixed or CPI increases                           up 31% from $976m at Dec 15

                                                                                                          7.53%
                                                                                                PORTFOLIO CAP RATE
   91 LEASES SIGNED OVER GLA of 73,000 SQM                                                      tightened from 7.88% at Dec 15
       for the year ended Jun 16 with low incentives and positive leasing spreads

Aventus Retail Property Fund | Full Year Results | 30 June 2016                                                                  6
Diversified and Growing Portfolio
                                                                         1

                              1
                                                          89%
                                                          EAST COAST
         4%
          WA                                                   1

                                                20
                                              Our

                                                centres
                                                          22% QLD

                                                               1
                                                          44%      NSW
LOCATIONS:
NSW                     QLD
Belrose Super Centre    Jindalee Home
Bankstown Home          Logan Super Centre
Caringbah Home          Macgregor Home
Highlands Hub           Sunshine Coast Home                    1
                                                           23%
Kotara Home South       SA
McGraths Hill Home
                        Mile End Home
                                                    1              VIC
                                              7%
Tuggerah Super Centre
Tweed Hub               WA
Warners Bay Home        Midland Home
VIC
Ballarat Home
Cranbourne Home
Epping Hub
Peninsula Home
                                               SA
Shepparton Home

1. By value

                                                                             77
National and Publicly Listed Retailers
National retailers represent 84% of the total portfolio by GLA
TOP 10 BY RETAILER GROUPS
RANK RETAIL GROUP PUBLIC COMPANY STORES % OF INCOME
1 Wesfarmers1 13 10%
2 Steinhoff Asia Pacific2 16 7%
3 Super Retail Group3 21 6%
4 Harvey Norman4 5 5%
5 Spotlight Group5 9 4%
6 The Muir Electrical Company6 10 4%
7 Fantastic Holdings7 12 4%
8 Woolworths8 4 3%
9 JB Hi-Fi 6 3%
10 Beacon Lighting 12 2%
TOTAL 108 48%
1. Bunnings, Officeworks, Coles and 1st Choice Liquor
2. Freedom, Snooze, Bay Leather Republic, Best & Less, Store and Order and Harris Scarfe
3. Supercheap Auto, BCF, Amart Sports and Rebel
4. Harvey Norman and Domayne
5. Spotlight and Anaconda
6. The Good Guys and Best Friends Pet Superstore
7. Fantastic Furniture, Plush and Original Mattress Factory
8. Masters, Dan Murphy’s, BWS and Woolworths Caltex
Aventus Retail Property Fund | Full Year Results | 30 June 2016 8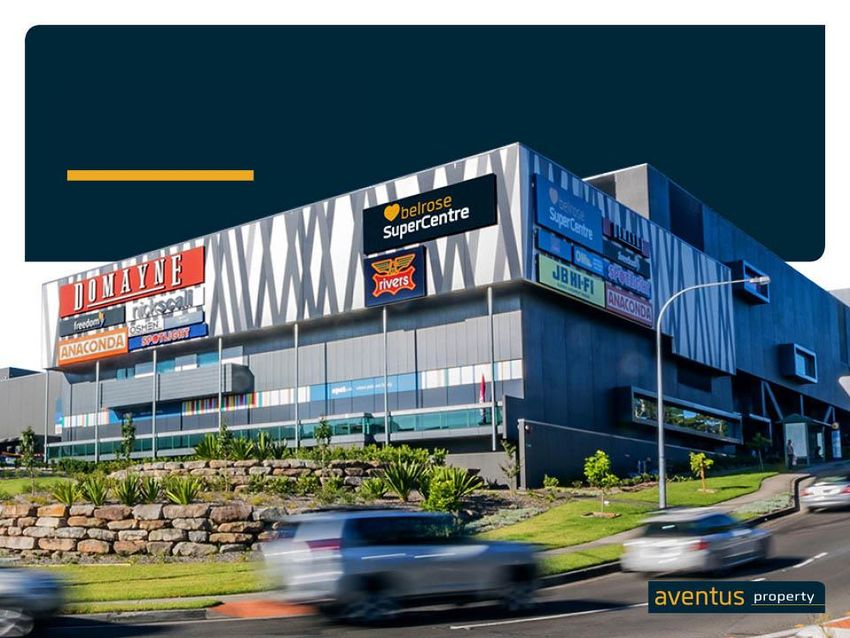
Diversified Tenancy Mix
• The Fund has increased the non-household goods and services category to 33% at 30 June 2016 from 31% in December 2015

• The Fund has greater exposure to non-household goods and services, and less in furniture, than the broader industry

                             AVN Tenancy Mix by GLA1                                                                                            Industry Tenancy Mix by GLA2

                                             2%2%                                                                                                           2% 5%
                                   9%
                                                                                                                                                10%                                                 26%
                                                                                   33%
                   12%
                                                                                                                                        8%

                    15%
                                                                                                                                          20%

                                                                                                                                                                                            30%
                                                             27%

                  Non-Household Goods and Services                     Furniture                                                       Non-Household Goods and Services                      Furniture
                  Hardware & Garden                                    Homewares                                                       Hardware & Garden                                     Homewares

                  Electrical                                           Coverings                                                       Electrical                                            Coverings
                                                                                                                                       Vacant
                  Vacant

1. As at 30 June 2016, non-household goods includes pet supplies, baby supplies, sporting, camping and leisure, cafes, restaurants, supermarkets, liquor, fitness centres, medical centres, offices, chemists and automotive
2. Source: Deep End Services (centres larger than 10,000 sqm) as at 30 June 2016

Aventus Retail Property Fund | Full Year Results | 30 June 2016                                                                                                                                                        9
Expanding the Non-Household Category
• Non-household goods and services retailers improve centre performance by driving greater weekday traffic, increasing visit frequency
  and lengthening customer visits

Tenants in this category include:

                     49                                           31                   25                       19
               Cafés & Restaurants                      Leisure & Sports Stores     Fitness & Medical        Automotive Stores

                     16                                           15                    10                         5
                                                             Pet Showrooms        Offices and Government   Children’s Play Centres
                 Supermarkets,
                                                                                     Service Providers         and Vocational
                   Liquor and
               Convenience Stores

Aventus Retail Property Fund | Full Year Results | 30 June 2016                                                                          10
Consistently High Occupancy
PORTFOLIO VACANCY HAS BEEN
CONSISTENTLY LOWER THAN THE INDUSTRY AVERAGE1
8.1%
7.2%
6.5%
6.1%
5.8% 5.6%
5.0% High occupancy
5.8%
3.8% Low incentives
3.1% 2.9%
2.0%
2.6%
2.3% Positive
1.6% leasing spreads
1.2%
Jun-09 Jun-10 Jun-11 Jun-12 Jun-13 Jun-14 Jun-15 Jun-16
2
AVN Portfolio National Average
Number of large format centres comprising the AVN Portfolio
4 6 7 9 11 12 14 20
1. Source: Deep End Services (centres larger than 10,000 sqm); By GLA
2. Historical metrics exclude centres prior to acquisition by the Fund
Aventus Retail Property Fund | Full Year Results | 30 June 2016 11Staggered Lease Expiry Profile
and Annual Rent Reviews
• Proactive leasing has resulted in 91 leases being signed and FY17 expiry was reduced from 18% down to 12%
SIGNIFICANT PROGRESS ON FY17 EXPIRIES1 80% OF LEASES HAVE
ANNUAL FIXED OR CPI INCREASES2
JUN 15: 18%
DEC 15: 17%
16%
14% 14%
MAR 16: 14%
20%
12% 12% 12%
8%
50%
5%
4%
30%
2%
1%
Vacant FY17 FY18 FY19 FY20 FY21 FY22 FY23 FY24 FY25 Beyond Fixed (Predominantly 3% - 5%) CPI Market/Expiry
1. Holdover tenancies as at 30 June 2016 treated as FY17 expiries
2. By gross rent
Aventus Retail Property Fund | Full Year Results | 30 June 2016 12Key Portfolio Updates
• Seven centres valued at $265.4m were acquired during
the period. These acquisitions are performing in-line
with expectations:
• Rebranding and relaunching of the centres acquired
including planned refurbishments
• Leasing strategy implemented and discussions with retailers
for vacancies and renewals underway
• Exploring potential for pad sites and value-add
expansion opportunities
• All three ex-Dick Smith tenancies are leased with minimal
downtime, incentives and variance to passing rent McGraths Hill Home, NSW
• Masters at Cranbourne Home continues to meet all obligations
under their 15-year lease, which is guaranteed by Woolworths
Limited, and their intentions have not been communicated
to the Fund
Aventus Retail Property Fund | Full Year Results | 30 June 2016 13Centre Valuation Uplift
• Centre valuations across the portfolio increased by $65.2 million1 or 9.7% over the six months to 30 June 2016 which brings the total
revaluation to $86.5m1, or 9.6% for FY16 across 14 centres post IPO
• The valuation increases take into account annual rent increases, market rent reviews, completion of a number of asset management
and development initiatives together with reductions in capitalisation rates
• As a result of these revaluations, the WACR of the portfolio tightened to 7.53% from 7.88% at 31 December 2015 and 8.01% at
30 June 2015
June 2016 Prior June 2016 Prior
Movement2 Variance
Valuation Valuation Cap Rate Cap Rate
($M) (%)
($M) ($M) (%) (%)
Internal Valuations
1 Caringbah Home 88.4 82.5 5.9 7.2 7.75 8.00
2 Cranbourne Home 120.1 114.1 6.0 5.3 7.35 7.83
3 Highlands Hub 29.8 28.5 1.3 4.6 8.00 8.25
4 Sunshine Coast Home 66.8 64.5 2.3 3.6 7.50 8.00
5 Tweed Hub 30.2 29.5 0.7 2.4 8.00 8.25
6 Warners Bay Home 33.3 32.5 0.8 2.5 8.00 8.25
Independent Valuations
7 Ballarat Home 36.5 30.6 5.9 19.3 8.00 8.75
8 Belrose Super Centre 122.0 105.0 17.0 16.2 7.00 7.53
9 Kotara Home South 107.0 95.5 11.5 12.0 7.00 7.50
10 Midland Home 54.5 48.5 6.0 12.4 8.00 8.75
11 Tuggerah Super Centre1 60.5 43.4 7.8 18.0 7.00 7.25
Total 749.1 674.6 65.2 9.7% 7.44% 7.90%
1. Final valuation increment adjusted for final development project costs at Tuggerah and Peninsula
2. Movement excludes revaluation adjustments relating to straight-lining of rental income and capitalisation of leasing and borrowing costs
Aventus Retail Property Fund | Full Year Results | 30 June 2016 142. FINANCIAL RESULTS
15
Highlands Hub, NSWFinancial Performance
PRE IPO POST IPO
FULL YEAR
1 JULY 2015 TO 20 OCT 2015 TO
19 OCT 2015 30 JUN 2016
2016 Comments
$M
$M $M
• Pre IPO results relate
solely to the Kotara
Home South centre
Rental and other property income 2.7 74.4 77.1
• Finance costs include
mark-to-market loss of
Net movement in fair value (0.1) 82.0 81.9 interest rate swaps of
of investment properties $3.5m
Other income - 0.5 0.5 • Portfolio acquisition and
transaction costs are
Property expenses (0.8) (19.2) (20.0) comprised of $54.0m of
IPO costs and $16.7m of
post IPO acquisition
Finance costs (0.8) (11.5) (12.3) costs which include the
purchase of Epping Hub,
Management fees - (4.3) (4.3) Belrose Gateway Centre
and the May portfolio
Portfolio acquisition and - (70.7) (70.7) acquisition
transaction costs
Other expenses - (1.2) (1.2)
Result for the period 1.0 50.0 51.0
Aventus Retail Property Fund | Full Year Results | 30 June 2016 16Funds From Operations (FFO)
POST IPO
POST IPO 20 OCT 2015 TO 30 JUN 2016
$M
Profit for the period 50.0
Straight-lining of rental income (2.2)
Amortisation of rental guarantees 0.5
Amortisation of debt establishment costs 0.5
Net movement in fair value of investment properties (82.0)
Net movement in fair value of derivative financial instruments 3.5
Portfolio acquisition and transaction costs 70.7
FFO 41.0
Maintenance capex (2.4)
Leasing costs (2.2)
Adjusted FFO (AFFO) 36.4
Distribution per unit (cents) 10.3
FFO per unit (cents) 11.7
Payout ratio (% of FFO) 90%
Aventus Retail Property Fund | Full Year Results | 30 June 2016 17Balance Sheet
ACTUAL ACTUAL
MOVEMENT
JUN 16 DEC 15
$M
$M $M
Comments
Assets
• The increase in investment
Cash and cash equivalents 4.3 5.8 (1.5) properties compared to Dec 15
is mainly due to acquisitions
Investment properties1 1,273.3 975.6 297.7 and fair value adjustments
during the period
Other assets 8.5 3.5 5.0
• The increase in borrowings is
Liabilities mainly attributable to debt
funded acquisitions during the
Borrowings (459.1) (315.7) 143.4
period
Other liabilities (30.6) (21.2) 9.4 • The increase in other liabilities
is mainly attributable to a
Net Assets 796.4 648.0 148.4
$4.6m increase in distributions
Units on issue (million) 394.7 343.2 51.5 payable and a $3m increase in
interest rate swap liabilities
NTA per unit ($) $2.02 $1.89 $0.13
Gearing (%)2 35.7% 31.9% 3.8%
1. Investment properties includes rental guarantees of $4.4m at 30 June 2016
2. The gearing ratio is calculated as total debt less cash divided by total assets less cash
Aventus Retail Property Fund | Full Year Results | 30 June 2016 18Debt and Hedging Activities
DEBT AND HEDGING PROFILE
AT 30 JUNE 2016
JUN 16 DRAWN UNDRAWN
KEY METRICS $M BANK DEBT $M $M MATURITY
Bank debt (excluding establishment costs) 462.0 Tranche A 200.0 - October 2020
Facility limit 500.0 Tranche B 200.0 - October 2018
Cash and undrawn debt capacity 42.3 Tranche C 62.0 38.0 May 2021
Gearing (%)1 35.7% Total 462.0 38.0
Weighted average cost of debt (%)2 3.3%
INTEREST RATE NOTIONAL AMOUNT
Weighted average debt maturity (years) 3.5 SWAP MATURITY $M
Weighted average hedged debt maturity (years) 3.6
LVR (%)3 (max. 55%) 36.9% FY19 80.0
ICR (min. 2.0x) 6.3x FY20 60.0
Interest rate swaps 240.0 FY21 100.0
Hedged debt to drawn debt (%) 51.9% Total 240.0
• The gearing ratio of 35.7% is within the target range of 30% to 40%
• Fixed rates on interest rate swaps range from 1.83% to 2.36%
1. The gearing ratio is calculated as total bank debt less cash and cash equivalents divided by total assets less cash and cash equivalents
2. WACD is calculated based on historical finance costs excluding debt establishment costs
3. The LVR ratio is calculated as total bank debt divided by the total fair value of investment properties. Fair value is calculated by reference to the most recent independent valuation for each property
Aventus Retail Property Fund | Full Year Results | 30 June 2016 193. ACQUISITIONS
20
Kotara Home South, NSWFY16 Acquisitions Summary
• Seven centres were acquired during the period for $265.4m at a weighted average cap rate of 7.49% and at an average rate of $2,386 per sqm
Macgregor Home, QLD Logan Super Centre, QLD
$26.1m $81.9m
QLD
McGraths Hill Home, NSW Belrose Gateway Centre, NSW Bankstown Home, NSW
$36.1m $6.4m $53.3m
NSW
Epping Hub, VIC Shepparton Home, VIC
VIC $40.0m $21.6m
Aventus Retail Property Fund | Full Year Results | 30 June 2016 21Consolidating a Fragmented Market
FY16 Buyers2
3%
Australian LFR centre ownership1 25% 41%
Aventus
15%
Institutional
Syndicates
38%
12% Private
23%
(9% at IPO)
8% Retailer (Listed)
FY16 Sellers2
10%
Private
7%
40%
151 Property /
35% 4% Blackstone
Institutional
Harvey Norman
Retailer (Listed)
Aventus
Smaller portfolios (2+ centres) 14% Syndicates
Other centres (single ownership) A-REIT
1. Source: Deep End Services, centres larger than 10,000 sqm; By GLA 25%
2. Source: Colliers International, centres larger than 10,000 sqm; By value
Aventus Retail Property Fund | Full Year Results | 30 June 2016 224. DEVELOPMENT
23
Tuggerah Super Centre, NSWDevelopment Update
Highlights
• The estimated development pipeline to 30 June 2017 is $20.2 million and
is a key driver of the Fund’s portfolio enhancement strategy
• Peninsula Home (Victoria) was successfully completed in May 2016, is 99% leased
and includes the addition of a new Aldi supermarket and a 165-seat restaurant Peninsula Home, VIC
• The Tuggerah Super Centre (New South Wales) revitalisation achieved Practical
Completion (PC) in May 2016
• Commenced expansion at Belrose Super Centre to add an additional 2,250 sqm of
GLA to the existing rooftop car park which is due for completion in early 2017
• Re-development of the Bunnings tenancy at Sunshine Coast Home in
Queensland is due to commence in early 2017 subject to pre-commitments
and authority approvals
Tuggerah Super Centre, NSW
Post Balance Date Acquisition
• On 1 July 2016, the Fund acquired a 55,840 sqm vacant development site opposite
Tuggerah Super Centre for $3.8 million1 to increase control of the precinct and
provide for future development and expansion opportunities
Belrose Super Centre, NSW
1. Excludes GST
Aventus Retail Property Fund | Full Year Results | 30 June 2016 24Development Pipeline
• The portfolio covers 1.1 million sqm of land nationally with an average site coverage of 43%
• The estimated development pipeline to 30 June 2017 consists of $20.2 million of projects identified across numerous states targeting
value add and centre enhancement opportunities
• There are an additional eight centres that have been identified outside the FY17 pipeline which are currently being investigated
and planned
• Gained approvals for three developments during FY16 to expand the portfolio
FY16 FY17
2Q 3Q 4Q 1Q 2Q 3Q 4Q
Rem. Cost1
Oct-Dec Jan-Mar Apr-Jun Jul-Sep Oct-Dec Jan-Mar Apr-Jun
Peninsula Home, VIC | $0.3m
Tuggerah Super Centre, NSW | $1.5m
Belrose Super Centre, NSW | $6.4m
Cranbourne Home Stage 8, VIC | $2.5m
Caringbah Home, NSW | $1.2m2
Sunshine Coast Home, QLD | $8.3m2
Complete Underway Under Investigation
1. Project values represent remaining project cost
2. Works continue past current forecast period
Aventus Retail Property Fund | Full Year Results | 30 June 2016 25Case Study – Tuggerah Super Centre
• $11.2m centre revitalisation completed including external façade upgrades,
mall refurbishment and separation of level one
• More than 50% of centre retailers have now completed internal and/or
external store refurbishments to lift store presentation across the centre
• National retailers have increased to 86% of the centre and average gross
rents across the centre increased by 15% since acquisition
• Nine new leasing deals have been completed, including the expansion of two
existing retailers
• New categories introduced to the centre including government services, pet
supplies, homewares and food operators
• Total centre approach to development has delivered material valuation gains
on completion resulting in a net valuation increase to $60.5m from $54.0m1
(+12.0%)
Before
Ownership interest 100% Car park spaces 758
WALE at 30 June 2016 7.4 Zoning B5 Business
Development
Occupancy (by GLA) 93%
Total Catchment Size 206,013
Number of Retailers 22
Percentage of 86%
Site Area 71,570 National Retailers
Gross Lettable Area 28,907 List of Majors Bunnings, Spotlight,
(GLA) ex level 1 The Good Guys,
Fantastic Furniture
VALUE
Valuation Date 30-Jun-16
Type Independent
Valuation $60,500,000
Value per sqm $2,093
Capitalisation Rate 7.00%
After
1. Includes acquisition cost and redevelopment spend
Aventus Retail Property Fund | Full Year Results | 30 June 2016 26Case Study – Tuggerah Super Centre (cont.)
UNDER OFFER
RENEWAL
New 7 Year Lease & NEW ARRIVAL
Refurbishment
New 5 Year Lease
NEW ARRIVAL
New 5 Year Lease
RECENT EXPANSION
EXPANDED
New 12 Year Lease
New 7 Year Lease
NEW ARRIVAL
New 6 Year Lease
EXPANDED
NEW ARRIVAL
New 5 Year Lease
New 5 Year Lease
RENEWAL
Agreed
NEW ARRIVAL
Agreed
RENEWAL TERMS AGREED NEW ARRIVAL NEW ARRIVAL
New 5 Year Lease Agreed New 7 Year Lease
Aventus Retail Property Fund | Full Year Results | 30 June 2016 275. OUTLOOK
28
Belrose Super Centre, NSWOutlook
• The underlying portfolio is performing in-line with management’s expectations with net property income to grow from annual rent
reviews and continued optimisation of tenancy mix by leveraging strong national retailer relationships
• Continue to seek opportunities to grow the portfolio via value-adding development and selective acquisitions to supplement
organic centre income growth
• Maintain a disciplined and flexible capital structure by diversifying funding sources and lengthening debt expiries
• The Fund’s FY17 earnings guidance is1:
• FFO per unit of 17.5 – 18.0 cents (5.4 – 8.4% higher than annualised 1H17 PDS forecast)
• Distribution per unit of 15.8 – 16.2 cents (5.3 – 8.0% higher than annualised 1H17 PDS forecast)
based on a payout ratio of 90% of FFO
1. Assuming no material change to the operating environment
Aventus Retail Property Fund | Full Year Results | 30 June 2016 29Questions?
Aventus Property Group
Integrated and Leading investor with a track record Single sector
scalable platform for performance and adding value in LFR focus
Deep retail expertise Specialised team focused Long history of LFR
and insights on operational excellence retailer relationships
Aventus Retail Property Fund | Full Year Results | 30 June 2016 30APPENDIX 1:
PORTFOLIO OVERVIEW
31
Cranbourne Home, VICPortfolio Summary
Valuation Carrying Cap WALE No. of GLA Site Area National Development
CENTRE State Occupancy2
Date Value ($m)1 Rate (years)3 Tenancies (sqm) (sqm) Retailers Potential4
Ballarat Home VIC Jun-16 36.5 8.00% 100% 5.5 15 20,098 52,084 91% P
Bankstown Home NSW Mar-16 53.3 7.25% 100% 2.6 20 17,171 40,240 92% P
Belrose Super Centre5 NSW Jun-16 128.4 7.06% 100% 5.1 43 34,338 44,265 88% P
Caringbah Home NSW Jun-16 88.4 7.75% 100% 2.0 26 19,377 22,818 82% P
Cranbourne Home VIC Jun-16 120.1 7.35% 98% 7.4 32 54,316 193,900 90% P
Epping Hub VIC Oct-15 40.0 8.00% 96% 2.7 30 22,141 59,770 55% P
Highlands Hub NSW Jun-16 29.8 8.00% 98% 4.5 14 11,404 31,890 80% P
Jindalee Home QLD Dec-15 103.9 7.56% 99% 3.3 58 26,475 72,030 69% P
Kotara Home South NSW Jun-16 107.0 7.00% 98% 4.6 22 29,148 53,390 91% P
Logan Super Centre QLD Apr-16 81.9 7.25% 98% 2.6 28 26,998 26,790 77% P
Macgregor Home QLD Apr-16 26.1 7.75% 100% 1.3 6 12,505 29,128 69% P
McGraths Hill Home NSW Mar-16 36.1 7.25% 100% 3.1 9 16,478 37,840 100% O
Midland Home WA Jun-16 54.5 8.00% 100% 3.8 18 23,411 42,640 94% O
Mile End Home SA Dec-15 83.2 8.00% 98% 3.1 32 33,464 71,320 82% P
Peninsula Home VIC Dec-15 71.7 8.00% 99% 3.6 30 33,064 84,651 86% P
Shepparton Home VIC Apr-16 21.6 8.00% 81% 4.9 11 13,661 30,290 81% O
Sunshine Coast Home QLD Jun-16 66.8 7.50% 97% 3.7 32 27,584 68,877 84% P
Tuggerah Super Centre6 NSW Jun-16 60.5 7.00% 93% 7.4 22 28,907 71,570 86% P
Tweed Hub NSW Jun-16 30.2 8.00% 92% 3.2 17 9,763 26,200 58% O
Warners Bay Home NSW Jun-16 33.3 8.00% 100% 3.1 12 12,337 35,140 91% O
Total Portfolio 1,273.3 7.53% 97.7% 4.1 477 472,640 1,094,833 84%
1. Valuations are on ‘as if complete’ basis
2. By GLA as at 30 Jun 16
3. By gross income as at 30 Jun 16 (excluding rental guarantees)
4. Further development of certain centres may be subject to contractual and regulatory approvals including planning approvals from relevant local government authorities
5. Metrics are calculated on a weighted average basis (by value) including Belrose Super Centre and adjacent Belrose Gateway Centre; Belrose Gateway Centre last valued in Oct 15
6. Carrying value for Tuggerah includes $11.5m of capital expenditures completed since acquisition. Excludes $3.75 million of vacant land purchased in Jul 16
Aventus Retail Property Fund | Full Year Results | 30 June 2016 32APPENDIX 2:
INDUSTRY DYNAMICS
33
Jindalee Home, QLDThe Changing Nature of LFR Centres
Old Bulky Goods Centres Modern AVN LFR Centres
• Independent family
operated with high • Predominantly national / ASX listed / international retailers
Improving quality concentration of furniture with multi-brand strategy
of tenants and household goods, • Providing greater transparency of retailer performance
and few international • Ensuring income streams are more reliable and consistent
retailers
• Larger more dominant centres creating critical mass as a
Increasing centre • Smaller centres with single destination offering
size and improved basic design (industrial • Development of modern multi-level centres in mainly
design single level buildings) metropolitan locations with ample car parking, ease of
access and modern amenities
• All-week visits with increasing dwell time and preference
for comparison shopping
Changing • Mainly weekend visits for
discretionary products • Demand for family focused, higher quality and diverse
shopper habits goods and services (eg, food and beverage, small
supermarkets, medical, fitness and leisure)
• Expansion of new uses and removal of minimum store size
• Strictly bulky / household
Flexible planning has allowed for the introduction of new offerings in centres
goods and minimum
controls store size • Potential for other states to reform and improve planning
controls (eg WA and NSW)
Aventus Retail Property Fund | Full Year Results | 30 June 2016 34Industry Dynamics
• Large Format Retail (LFR) goods are a substantial retail
segment in Australia RETAIL TURNOVER GROWTH
12 MONTHS TO 30 JUN 161
– Approximately $65bn in sales or 20% of total retail
spend in Australia2 Supermarkets 2.9%
Liquor 3.4%
– Approximately 30% of total retail floor space Other specialised food 0.8%
in Australia2
Furniture 4.8%
• Large format retail spend continued to outperform
Electrical 5.5%
total retail in FY16
Hardware & garden 7.1%
• This trend is expected to continue however,
the rate of growth is expected to normalise Clothing 6.3%
Footwear & personal accessories 4.6%
– BIS Shrapnel predicts spending on household goods to Department stores 4.0%
continue to outperform total retail and grow at 5% per
annum for 2017 and 2018
Newspaper & books (6.8%)
Other recreational goods 1.3%
Pharmaceuticals, cosmetic & toiletries 5.2%
Other retailing 6.1%
Cafes & restaurants 2.1%
Takeaway 4.2%
1. Source: ABS retail trend; On previous year 3.4% avg sales excl household goods
2. Source: Large Format Retail Association (LFRA)
Aventus Retail Property Fund | Full Year Results | 30 June 2016 35Demand for Household Goods
Demand for household goods influenced by many factors
• Strong growth in house prices since 2013 (now moderating)
RESIDENTIAL PRICES
YEAR ENDED MAR 161
• Relatively high levels of dwelling approvals (lag effect of up to three 20% 140
years) and completions 120
15%
100
• Turnover of existing dwellings 10%
80
5%
• Home improvements are a natural hedge with renovations continuing 60
through the cycle (but with smaller scope) 0%
40
(5%) 20
– Bunnings recorded strong store-on-store growth during the last
downturn (2008 – 2010) and continued to roll out more stores (10%) 0
2006 2007 2008 2009 2010 2011 2012 2013 2014 2015 2016
Other factors affecting demand for LFR goods include Quarterly change (YoY) Residential Property Price Index
• Interest rate environment and employment levels impact
consumer sentiment ANNUAL DWELLING COMPLETIONS AND APPROVALS2
• Changes in life stages and population growth (births, ageing, divorce,
upgraders, downsizers and migration) 240,000
220,000
• Product trends and popularity of home renovations generate interest and
attention for large format retailers (eg The Block) 200,000
180,000
• Limited impact to date of online retailing as LFR goods are considered 160,000
major purchases and have a ‘touch and feel’ element
140,000
120,000
2006 2007 2008 2009 2010 2011 2012 2013 2014 2015 2016
Dwelling completions - year ending March
Dwelling approvals - year ending March
1. Source: ABS residential property price index
2. Source: ABS dwelling approvals and completions
Aventus Retail Property Fund | Full Year Results | 30 June 2016 36Important Notice This presentation has been prepared on behalf of the Aventus Retail Property Fund (ARSN 608 000 764) (AVN). Aventus Capital Limited (ABN 34 606 555 480 AFSL 478061) (ACL) is the Responsible Entity of AVN. The information contained in this document is current only as at 30 June 2016 or as otherwise stated herein. This document is for information purposes only and only intended for the audience to whom it is presented. This document contains selected information and should be read in conjunction with the Annual Report, the financial statements for the period and other ASX announcements released from time to time. This document may not be reproduced or distributed without AVN’s prior written consent. The information contained in this document is not investment or financial product advice and is not intended to be used as the basis for making an investment decision. AVN has not considered the investment objectives, financial circumstances or particular needs of any particular recipient. You should consider your own financial situation, objectives and needs, conduct an independent investigation of, and if necessary obtain professional advice in relation to, this document. Except as required by law, no representation or warranty, express or implied, is made as to the fairness, accuracy, completeness or correctness of the information, opinions and conclusions, or as to the reasonableness of any assumption, contained in this document. By receiving this document and to the extent permitted by law, you release AVN and ACL and its directors, officers, employees, agents, advisers and associates from any liability (including, without limitation, in respect of direct, indirect or consequential loss or damage or any loss or damage arising from negligence) arising as a result of the reliance by you or any other person on anything contained in or omitted from this document. This document contains certain forward-looking statements along with certain forecast financial information. The words “anticipate”, “believe”, “expect”, “project”, “forecast”, “guidance”, “estimate”, “outlook”, “upside”, “likely”, “intend”, “should”, “could”, “may”, “target”, “plan”, and other similar expressions are intended to identify forward-looking statements. The forward-looking statements are made only as at the date of this document and involve known and unknown risks, uncertainties, assumptions and other important factors, many of which are beyond the control of AVN. Such statements reflect the current expectations of AVN concerning future results and events, and are not guarantees of future performance. Actual results or outcomes for AVN may differ materially from the anticipated results, performance or achievements expressed, projected or implied by these forward-looking statements or forecasts. Other than as required by law, although they believe that there is a reasonable basis for the forward-looking statements, neither AVN nor any other person gives any representation, assurance or guarantee (express or implied) that the occurrence of these events, or the results, performance or achievements expressed in or implied by any forward-looking statements contained herein will actually occur and you are cautioned not to place undue reliance on such forward-looking statements. Risk factors (which could be unknown or unpredictable or result from a variation in the assumptions underlying the forecasts) could cause actual results to differ materially from those expressed, implied or projected in any forward-looking statements or forecast. Past performance is not an indicator or guarantee of future performance or results. Aventus Retail Property Fund | Full Year Results | 30 June 2016 37
You can also read