High-Priced Drugs: Estimates of Annual Per-Patient Expenditures for 150 Specialty Medications - High-Price Drugs Based Upon Estimated Annual ...
←
→
Page content transcription
If your browser does not render page correctly, please read the page content below

High-Price Drugs Based Upon Estimated Annual Per-Patient Expenditure

       High-Priced Drugs: Estimates
       of Annual Per-Patient Expenditures
       for 150 Specialty Medications

                                                                                      1
America’s Health Insurance Plans
                                                                         APRIL 2016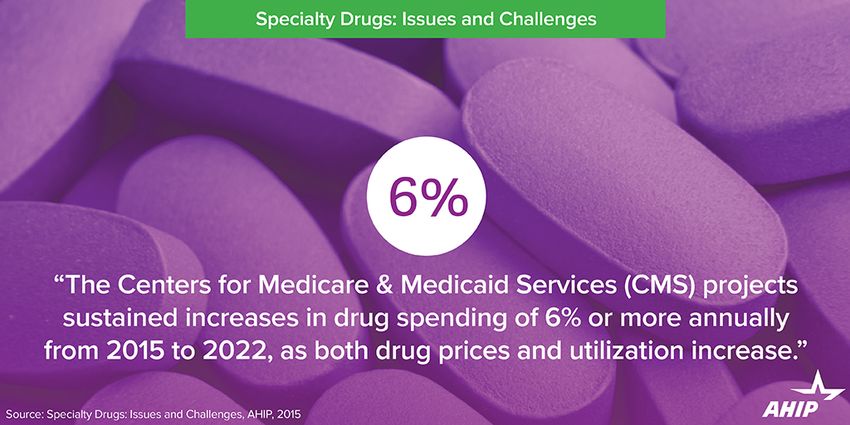
High-Price Drugs Based Upon Estimated Annual Per-Patient Expenditure

KEY TAKEAWAYS
                   Recent reports have         Examples of some of the most expensive
                   projected drug spending     medications include:
                   in the United States to     • RAVICTI costs $793,632 per patient per
grow to $560 billion - $590 billion by 2020,    year & CARBAGLU costs $585,408 per
up from $337 billion in 2015.                   patient per year (both prevent a build-up
                                                of nitrogen in the bloodstream that can
                  Much of this growth will      rapidly lead to coma and death);
                  be fueled by the growing
                  number of high-priced,       • LUMIZYME costs $626,400 per patient
specialty drugs coming to the market – an       per year (treats a progressive muscle
estimated 225 new specialty drugs over the      weakness that can lead to heart and
next five years.                                respiratory failure);
                                               • ACTIMMUNE costs $572,292 per patient
                  While specialty drugs          per year (treats conditions that can
                  account for less than          disrupt normal immune system
                  2 percent of all prescrip-     functioning and normal bone formation);
tions, they make up roughly 30 percent of
spending on all prescription drugs.            • SOLIRIS costs $542,640 per patient per
                                                 year (prevents the progressive destruction
                  Almost half (47.8              of red blood cells that can lead to other
                  percent) of the specialty      life-threatening conditions).
                  drugs included in this
analysis cost more than $100,000 per           Despite the growing crisis of increasingly
patient per year.                              more expensive drugs, the manner by
                                               which these prices are established by drug
                   A number of ongoing         companies remains a mystery. Without
                   state and federal efforts   greater transparency into these pricing
                   are developing to           decisions, unfortunately, drug prices will
address the significant challenges of high-    only continue to climb higher.
priced drugs; and in support of these
measures, this report attempts to quantify
the annual per-patient expenditures for an
initial sample of 150 specialty medications.

                                                                                            2
America’s Health Insurance Plans
High-Price Drugs Based Upon Estimated Annual Per-Patient Expenditure
Summary
Almost half of the 150 drugs studied cost in excess of $100,000 per year, with expenditures for 3 percent
of the drugs studied exceeding half-a-million dollars per patient per year. We reviewed the FDA-approved
dosing for a sample of 150 specialty medications prescribed to treat a variety of conditions and estimated
the typical amount used in a year for a typical patient. We then calculated the total annual per-patient
expenditure for a typical patient by multiplying the total quantity used per year by the pricing data
published in the Federal Supply Schedule and the REDBOOK, as of Sept. 30, 2015. Although these
medications are not the most commonly prescribed drugs, their financial impacts on the health care
system continue to grow and call into question the sustainability of these extraordinary prices.
Background
Recent reports have estimated overall spending on prescription medicines in the United States to be
$337 billion, in 2015.1 Global technology company IMS Health’s forecast of the world drug market,
Global Medicines Use in 2020: Outlook and Implications, projects drug spending worldwide to reach
$1.4 trillion by 2020, with U.S.-based spending totaling $560 billion - $590 billion.2
Although use of lower-priced generic medications is expected to exceed 90 percent of all prescriptions
dispensed in the United States over the next five years, IMS anticipates 225 new medications will be
introduced to the U.S. market during this same time period.2 Many of these agents will be specialty
pharmaceuticals, which are generally understood to be drugs that are structurally complex and often
require special handling and delivery; are often administered in an office-setting; and can include complex
molecules such as biologics.3 Another distinguishing feature of specialty pharmaceuticals is their high
prices. Previous studies have shown that specialty drugs together account for less than 2 percent of all
prescriptions written; however, these drugs make up almost one-third of total spending on prescription
medications.2 It is common for these medications to cost thousands of dollars per patient per month.
Both the current state of prescription drug pricing and the projections of continued increases in drug
spending in the years ahead have prompted a variety of proposals from both federal and state lawmakers.
In 2016 alone, 14 state legislatures — California; Colorado; Georgia; Massachusetts; Minnesota; New
Jersey; New Mexico; New York; North Carolina; Pennsylvania; Rhode Island; Tennessee; Texas; Virginia and
Washington State — considered bills addressing the rising costs of prescription medications. The aim of
many of these legislative efforts is to gain greater transparency into the manner by which drug companies
determine these exorbitant prices. Many of these bills are focused on those medications that exceed a
certain annual cost threshold, often $10,000 per patient per year.
Given the steadily increasing rate in the number of specialty pharmaceuticals coming to the market,
there is, more broadly, a need to assess the prevalence of high-priced drugs and begin to quantify the
magnitude of their costs to the health care system in general.
3
America’s Health Insurance PlansHigh-Price Drugs Based Upon Estimated Annual Per-Patient Expenditure
This analysis estimates the total annual drug expenditure for a typical patient, for an initial sample of 150
branded prescription medications having a total annual expenditure of at least $10,000. This list of drugs
was selected from the specialty drug formularies of leading payer organizations. It is not intended to
represent the entire universe of specialty medications but does provide a better understanding of what
exactly is meant by the term, “high-priced drugs.” Unlike other studies, which tend to report aggregated
drug expenditures, this analysis includes expenditures on a per-patient basis.
Methods
The following selection criteria were used for this Footnotes. Otherwise, 12 months of use was
initial study: assumed;
• Only patent-protected, branded prescription • For those medications having use in more than
drugs listed on specialty pharmacy formularies one disease, calculations of the annual utilization
were considered; for a typical patient were repeated for each
• Only those medications having Wholesale disease because the dosing for a particular drug
Acquisition Cost (WAC) and Average Wholesale may be different from one condition to the next.
Price (AWP) data available were included;
Next, the particular product strength and
• Vaccines, vitamins, nutritional supplements, packaging configuration, or in some cases, the
over-the-counter medications, and agents combination of various strengths and packaging
intended for diagnostic uses were excluded. configurations, that minimize any excess drug was
identified based upon the calculated annual
For each drug, estimates of the annual utilization, utilization. The corresponding National Drug Codes
for a typical patient, were calculated based upon (NDC); as well as, the quantity of required units by
the standard dosing information found in the packaging configuration(s) were recorded.
current FDA-approved labeling. We took the
following into consideration: Drug pricing data from the September 2015
• Commonly-accepted estimates of age- edition of The Federal Supply Schedule (FSS) were
appropriate body weight or body surface area recorded for each drug by NDC.4 Similarly, the WAC
were used for those medications dosed by body and AWP pricing data, as published in the
weight or surface area. The body weights and/or September 2015 REDBOOK5, were recorded. The
surface areas used are noted in the Appendix FSS is managed by the United States Department
Footnotes; of Veterans Affairs (VA) and supports the
• For those medications where dosing is acquisition of over one million healthcare products
individualized (e.g., titrated to tolerability), the and services for use by the VA as well as a number
dose and schedule were derived from clinical of other federal agencies. In many instances, the
trial data detailed in the package insert and FSS price is the lowest, publically-available price
noted in the Appendix Footnotes; point for a given drug. The WAC represents the
• For those medications having an indefinite prices paid by wholesalers to drug manufacturers
duration of use (e.g., dosing until disease while the AWP approximates the prices charged by
progression), the average duration of use was wholesalers to retailers and/or large purchasing
estimated from clinical trial data included in the groups. Neither the WAC nor AWP reflect any
package insert and noted in the Appendix discounts or rebates.
4
America’s Health Insurance PlansHigh-Price Drugs Based Upon Estimated Annual Per-Patient Expenditure
The total annual expenditure was calculated as the 203 drugs studied (some drugs have multiple FDA-
FSS price multiplied by the total quantity of product approved indications) exceeded $100,000 per
units to be consumed annually. The process was year (Appendix). Of note, FOLOTYN, used to treat
then repeated using the WAC and AWP pricing. lymphoma, can cost $540,648 per patient per
year. Patients suffering from genetic diseases are
Findings especially hard-hit as the annual expenditures for
drugs like RAVICTI ($793,632), LUMIZYME
This report estimates just how high the total ($626,400), CARBAGLU ($585,408), ACTIMMUNE
annual drug expenditures can be for a typical ($572,292), and SOLIRIS ($542,640) place
patient being prescribed one of these medications considerable strains on the budgets of private
using the standard FDA-approved dosing. As payers, public health programs (e.g., Medicaid and
summarized in Table 1, total annual drug Medicare), and patients alike. Interestingly total
expenditures, per patient, for many of these agents annual drug expenditures based on the Federal
reaches six figures, and worse still, some therapies Supply Schedule of the U.S. Department of
can exceed half-a-million dollars each year (see Veterans Affairs, one of the lowest, most heavily
Appendix for expenditures for each drug). discounted price points available, found many
drugs still approaching half-a-million dollars per
We investigated the total treatment costs of 150 patient annually.
specialty drugs for each of their FDA-approved
indications and found that almost half, or 97 of the
Table 1: Summary Of Annual Per-Patient Drug Expenditures By Indication
Condition Range of Annual Per-P atient Expenditures*
Low ($) High ($)
Hereditary Angioedema 14,292 98,040
Cancer, solid tumors 27,144 220,320
Cancer, hematological malignancies 12,897 540,648
Cancer, supportive care agents 14,183 41,576
Cystic Fibrosis 40,546 368,688
Ophthalmic Disorders 13,320 29,256
Genetic Diseases (including hereditary hypercholesteremia) 73,431 793,632
Growth Hormone Deficiency 30,064 38,944
Infectious Diseases 13,440 226,800
Immune System Disorders (including Multiple Sclerosis) 12,586 462,384
Pulmonary Arterial Hypertension 103,464 196,560
Organ Transplant 15,528 38,765
Other Miscellaneous Conditions 15,754 451,440
* Based upon Average Wholesale Prices; the “Low” entries above represent the medication with the lowest annual per-patient expenditure for the
disease state while the “High” entries represent the medication with the greatest annual per-patient expenditure.
5
America’s Health Insurance PlansHigh-Price Drugs Based Upon Estimated Annual Per-Patient Expenditure
Conclusion
The issue of high-priced medications has gained increasing attention in recent years from an array of
public and private organizations as patients, payers, and providers increasingly struggle with steadily rising
drug prices.6-8 Although specialty drugs make up only a small fraction of all medication use, they contribute
almost one-third of the total amount spent on prescriptions medications each year.2,3 Unfortunately, their
financial impact will only increase as more specialty pharmaceuticals gain FDA approval during the years
ahead. Yet, despite this growing crisis, the manner by which these prices are established by drug firms
remains a mystery. Without greater transparency into these pricing decisions, drug pricing will only
continue to grow unchecked, leaving the rest of the health care community, save the drug companies,
struggling to find ways to afford these critically important medications.
This initial report is not an exhaustive list of every drug that has an estimated annual per-patient cost of
$10,000 or more. However, it is illustrative of the growing challenges faced by the health care system in
making affordable medications available to all patients who need them. Going forward, this list of drugs
will be updated regularly as new medications enter the market.
6
America’s Health Insurance PlansHigh-Price Drugs Based Upon Estimated Annual Per-Patient Expenditure
Appendix
Annual Per-Patient Drug Expenditure By FDA-Approved Indication (As Of Sept. 30, 2015)
Hereditary Angioedema
Drug Mfr Indication Annual Per-Patient Expenditure ($)
FSS WAC AWP
Firazyr Shire Hereditary Angioedema (3 attacks/year)1 62,280 81,699 98,040
Firazyr Shire Hereditary Angioedema (3 attacks/year)1 41,520 54,466 65,360
Kalbitor Dyax Hereditary Angioedema (3 attacks/year)1 29,658 35,730 42,876
Firazyr Shire Hereditary Angioedema (1 attack/year)1 20,760 27,233 32,680
Kalbitor Dyax Hereditary Angioedema (2 attacks/year)1 19,772 23,820 28,584
Kalbitor Dyax Hereditary Angioedema (1 attack/year)1 9,886 11,910 14,292
Cancer, Colorectal
Drug Mfr Indication Annual Per-Patient Expenditure ($)
FSS WAC AWP
Cyramza Eli Lilly Metastatic Colorectal Cancer2 183,600 183,600 220,320
Imclone/Eli K-ras wild-type, EGFR+ Metastatic Colorectal
Erbitux 135,927 138,861 166,679
Lilly Cancer3
Avastin Genentech Metastatic Colorectal Cancer (10mg/kg dosing)2 114,478 124,908 149,893
Sanofi/
Zaltrap Metastatic Colorectal Cancer2 41,495 115,200 138,240
Regeneron
Vectibix Amgen K-ras wild-type, Metastatic Colorectal Cancer2 34,205 54,550 65,460
Stivarga Bayer Metastatic Colorectal Cancer 21,348 37,488 44,988
Cancer, Gastric
Drug Mfr Indication Annual Per-Patient Expenditure ($)
FSS WAC AWP
Advanced Gastric and Gastroesophageal
Cyramza Eli Lilly 183,600 183,600 220,320
Junction Adenocarcinoma2
Gleevec Novartis Gastrointestinal Stromal Tumors 98,952 121,464 145,764
Sutent Pfizer Gastrointestinal Stromal Tumors 81,896 61,872 74,240
Cancer, Thyroid
Drug Mfr Indication Annual Per-Patient Expenditure ($)
FSS WAC AWP
Lenvima Eisai Thyroid Cancer 125,304 167,400 200,880
Caprelsa AstraZeneca Thyroid Cancer 121,380 154,452 185,340
Cometriq Exelixis Metastatic Medullary Thyroid Cancer 21,048 38,988 46,788
7
America’s Health Insurance PlansHigh-Price Drugs Based Upon Estimated Annual Per-Patient Expenditure
Cancer, Lung
Drug Mfr Indication Annual Per-Patient Expenditure ($)
FSS WAC AWP
Xalkori Pfizer ALK+ Non-Small Cell Lung Cancer 143,100 161,592 193,908
Zykadia Novartis ALK+ Non-Small Cell Lung Cancer 148,896 151,176 181,416
Cyramza Eli Lilly Non-Small Cell Lung Cancer4 122,400 122,400 146,880
Avastin Genentech Non-Small Cell Lung Cancer (15mg/kg dosing)2 83,951 91,572 109,922
Tarceva Genentech Advanced Non-Small Cell Lung Cancer (150mg) 65,352 80,508 96,612
Iressa AstraZeneca EGFR+ Metastatic Non-Small Cell Lung Cancer 77,988 80,400 96,480
Gilotrif Boehringe-Ing EGFR+ Non-Small Cell Lung Cancer 50,676 77,688 93,216
Cancer, Kidney
Drug Mfr Indication Annual Per-Patient Expenditure ($)
FSS WAC AWP
Nexavar Bayer/Onyx Renal Cell Carcinoma 113,316 158,196 189,840
Inlyta Pfizer Advanced Renal Cell Carcinoma 121,896 136,356 163,632
Afinitor Novartis Renal Cell Carcinoma 113,208 126,456 151,740
Avastin Genentech Metastatic Renal Cell Carcinoma (10mg/kg dosing)2 114,478 124,908 149,893
Votrient Novartis Renal Cell Carcinoma 98,196 105,288 126,348
Sutent Pfizer Renal Cell Carcinoma 81,896 61,872 74,240
Cancer, Prostate
Drug Mfr Indication Annual Per-Patient Expenditure ($)
FSS WAC AWP
Sanofi-
Jevtana Refractory Metastatic Prostate Cancer5 105,312 156,024 187,236
Aventis
Xtandi Astellas Castration-Resistant Metastatic Prostate Cancer 61,032 106,176 127,416
Zytiga Janssen Castration-Resistant Metastatic Prostate Cancer 64,212 95,952 115,152
Cancer, Melanoma
Drug Mfr Indication Annual Per-Patient Expenditure ($)
FSS WAC AWP
Zelboraf Genentech BRAF V600E+ Melanoma 129,552 130,200 156,240
Mekinist Novartis BRAF V600E+ or V600K+ Melanoma 118,908 120,852 145,032
Yervoy BMS Metastatic Melanoma6 114,692 119,862 143,838
Erivedge Genentech Metastatic Basal Cell Carcinoma 94,728 112,692 135,228
Keytruda Merck Metastatic Melanoma7 110,616 110,064 132,072
Tafinlar Novartis BRAF V600E+ Melanoma 103,872 105,564 126,696
8
America’s Health Insurance PlansHigh-Price Drugs Based Upon Estimated Annual Per-Patient Expenditure
Cancer, Brain
Drug Mfr Indication Annual Per-Patient Expenditure ($)
FSS WAC AWP
Afinitor Novartis Subependymal Giant Cell Astrocytoma 113,208 126,456 151,740
Avastin Genentech Glioblastoma Multiforme (10mg/kg dosing)2 114,478 124,908 149,893
Temodar Merck Glioblastoma Multiforme3 37,872 51,000 61,212
Temodar Merck Refractory Anaplastic Astrocytoma3 32,388 43,620 52,344
Wafers Eisai/Arbor Malignant Glioma and Glioblastoma Multiforme 25,971 29,035 34,841
Cancer, Breast
Drug Mfr Indication Annual Per-Patient Expenditure ($)
FSS WAC AWP
Kadcyla Genentech HER2+ Metastatic Breast Cancer8 148,548 150,888 181,056
Ibrance Pfizer ER+ HER2+ Breast Cancer 116,424 117,660 141,840
Tykerb Novartis Advanced Breast Cancer (1500mg dosing) 62,268 66,768 80,124
Tykerb Novartis Advanced Breast Cancer (1250mg dosing) 41,512 44,512 53,416
Cancer, Other Tumor Types
Drug Mfr Indication Annual Per-Patient Expenditure ($)
FSS WAC AWP
Nexavar Bayer/Onyx Hepatocellular Carcinoma 113,316 158,196 189,840
Sutent Pfizer Pancreatic Neuroendrocine Tumor 126,576 139,200 167,052
Imclone/Eli
Erbitux Head-and-Neck Cancer 135,927 138,861 166,679
Lilly
Lynparza AstraZeneca BRCA+ Ovarian Cancer 131,023 134,400 161,280
Avastin Genentech Advanced Ovarian Cancer (10mg/kg dosing)2 114,478 124,908 149,893
Votrient Novartis Soft-Tissue Sarcoma 98,196 105,288 126,348
Avastin Genentech Cervical Cancer (15mg/kg dosing)2 83,951 91,572 109,922
Tarceva Genentech Advanced Pancreatic Cancer 57,780 71,184 85,416
Xgeva Amgen Bone Metastases/Giant Cell Tumor of Bone 20,658 22,620 27,144
9
America’s Health Insurance PlansHigh-Price Drugs Based Upon Estimated Annual Per-Patient Expenditure
Cancer, Lymphomas
Drug Mfr Indication Annual Per-Patient Expenditure ($)
FSS WAC AWP
Folotyn Allos Peripheral T-Cell Lymphoma9 344,664 450,540 540,648
Seattle Hodgkin’s Lymphoma and Large Cell
Adcetris 232,608 281,376 337,632
Genetics Lymphoma10
Abbvie/
Imbruvica Mantel Cell Lymphoma 98,988 146,700 176,040
Janssen
Zolinza Merck Cutaneous T-Cell Lymphoma 102,192 140,676 168,804
Revlimid Celgene Mantel Cell Lymphoma 99,036 121,800 146,172
Chronic Lymphocytic Leukemia; Non-Hodgkin’s
Zydelig Gilead 65,136 94,956 113,940
& Small Cell Lymphoma
ARRANON, T-Cell Acute Lymphoblastic Leukemia & T-Cell
Novartis 75,870 77,112 92,520
Adult Lymphoblastic Lymphoma
Treanda Cephalon Non-Hodgkin’s Lymphoma 74,208 75,341 90,416
Rituxan Genentech Non-Hodgkin’s Lymphoma 33,425 38,142 45,771
Velcade Millenium Mantel Cell Lymphoma 31,471 33,810 40,572
ARRANON, T-Cell Acute Lymphoblastic Leukemia & T-Cell
Novartis 31,614 32,130 38,550
Child Lymphoblastic Lymphoma
Cancer, Leukemias
Drug Mfr Indication Annual Per-Patient Expenditure ($)
FSS WAC AWP
Oncaspar Baxalta Acute Lymphoblastic Leukemia11 103,836 323,208 387,864
Revlimid Celgene Myelodysplastic Syndrome 116,556 162,408 194,892
Chronic Myelogenous Leukemia &
Iclusig Ariad Ph-Chromosome+ Acute Myelogenous 136,044 143,400 172,080
Leukemia
Ph-Chromosome+ Chronic Myelogenous
Bosulif Pfizer 112,212 130,776 156,939
Leukemia
Ph-Chromosome+ Chronic Myelogenous
Sprycel BMS/Otsuka 106,812 124,284 149,136
Leukemia & Acute Lymphocytic Leukemia
Gleevec Novartis Chronic Myelogenous Leukemia 98,952 121,464 145,764
Ph-Chromosome+ Chronic Myelogenous
Tasigna Novartis 102,684 116,040 139,248
Leukemia
Arzerra Novartis Chronic Lymphocytic Leukemia 107,316 112,344 134,808
Erwinaze Jazz Pharm. Acute Lymphoblastic Leukemia12 71,412 110,664 132,798
Abbvie/
Imbruvica Chronic Lymphocytic Leukemia 74,424 110,028 132,036
Janssen
Treanada Cephalon Chronic Lymphocytic Leukemia (6 treatment cycles) 43,131 52,322 62,787
Teva/
Trisenox Acute Promyelocytic Leukemia2 42,384 50,760 60,912
Cephalon
Gazyva Genentech Chronic Lymphocytic Leukemia 40,656 42,416 76,344
Rituxan Genentech Chronic Lymphocytic Leukemia (6 treatment cycles) 32,113 36,647 43,976
Oforta Sanofi Chronic Lymphocytic Leukemia (6 treatment cycles) ----- 16,971 18,885
10
America’s Health Insurance PlansHigh-Price Drugs Based Upon Estimated Annual Per-Patient Expenditure
Cancer, Myelomas
Drug Mfr Indication Annual Per-Patient Expenditure ($)
FSS WAC AWP
Pomalyst Celgene Multiple Myeloma13 119,736 141,072 169,296
Revlimid Celgene Multiple Myeloma 99,036 121,800 146,172
Farydak Novartis Multiple Myeloma14 54,000 54,880 65,856
Velcade Millenium Multiple Myeloma 49,455 53,130 63,756
Thalomid Celgene Multiple Myeloma 41,362 53,061 63,673
Zometa Novartis Multiple Myeloma 10,575 10,747 12,897
Cancer, Supportive Care Agents
Drug Mfr Indication Annual Per-Patient Expenditure ($)
FSS WAC AWP
Hyperuricemia Associated with Tumor
Elitek, Adults Sanofi 22,500 34,647 41,576
Lysis Syndrome
Hematopoietic Stem Cell Mobilizer for
Mozobil Genzyme 20,220 28,628 34,352
Autologous Transplant
Xgeva Amgen Hypercalcemia of Malignancy 20,658 22,620 27,144
Neulasta Amgen Prevention of Febrile Neutropenia in Cancer 13,720 19,659 23,591
Reduction of Chemotherapy-Associated
Ethyol MedImmune ----- 15,146 18,176
Renal Toxicity
Hyperuricemia Associated with Tumor
Elitek, Child Sanofi 9,000 13,859 16,631
Lysis Syndrome
Kepivance Sobi Severe Oral Mucositis 10,626 11,819 14,183
Cystic Fibrosis
Drug Mfr Indication Annual Per-Patient Expenditure ($)
FSS WAC AWP
Kalydeco Vertex Cystic Fibrosis 302,004 307,236 368,688
Tobi Podhaler Novartis Cystic Fibrosis15 43,320 48,384 58,062
Pulmozyme Genentech Cystic Fibrosis 24,681 33,789 40,546
High Cholesterol, Hereditary
Drug Mfr Indication Annual Per-Patient Expenditure ($)
FSS WAC AWP
Juxtapid Aegerion Homozygous Familial Hypercholesteremia16 220,788 346,620 415,944
Kynamro Genzyme Homozygous Familial Hypercholesteremia 159,996 253,188 303,828
11
America’s Health Insurance PlansHigh-Price Drugs Based Upon Estimated Annual Per-Patient Expenditure
Ophthalmic Disorders
Drug Mfr Indication Annual Per-Patient Expenditure ($)
FSS WAC AWP
Neovascular Macular Degeneration/
Lucentis Genentech 23,004 23,400 29,256
Macular Edema
Eylea Regeneron Diabetic Macular Edema/Retinopathy 14,726 14,800 17,760
Lucentis Genentech Diabetic Macular Edema/Retinopathy 13,800 14,040 16,848
Eylea Regeneron Neovascular, Age-Related Macular Degeneration 12,885 12,950 15,540
Eylea Regeneron Macular Edema/Retinal Vein Occlusion 11,044 11,100 13,320
Genetic Diseases
Drug Mfr Indication Annual Per-Patient Expenditure ($)
FSS WAC AWP
Ravicti Horizon Urea Cycle Disorders17 339,384 661,344 793,632
Lumizyme Genzyme Pompe’s Disease18 524,088 522,000 626,400
Carbaglu Recordati Acute and Chronic Hyperammonemia19 418,524 487,824 585,408
Severe, Malignant Osteopetrosis and Chronic
Actimmune Horizon 244,104 476,916 572,292
Granulomatous Disease
Soliris Alexion Paroxysmal Nocturnal Hemoglobinuria 432,240 452,220 542,640
Demser Valeant Pheochromocytoma Induced Hypertension 96,804 393,528 472,236
Cholbam Asklepion Bile Acid Synth & Peroxisomal Disorders20 227,544 297,900 357,480
Zavesca Actellion Type 1 Gaucher Disease 142,188 294,840 353,808
Aldurazyme Genzyme Mucopolysaccharidosis I 279,268 293,384 352,061
Fabrazyme Genzyme Fabry’s Disease21 229,488 251,328 301,584
Arcalyst Regeneron Cryopyrin-Associated Periodic Syndrome 236,376 240,000 288,000
Xenazine Prestwick Huntington’s Chorea22 66,282 111,810 134,172
Ilaris Novartis Cyropyrin-Associated Periodic Syndrome23 94,674 96,330 115,596
Kuvan BioMarin Treatment of Hyperphenylalaninemia 91,574 94,368 113,232
Exjade Novartis Non-Transfusion Dependent Thalassemia 54,785 61,193 73,431
Growth Hormone Deficiency
Drug Mfr Indication Annual Per-Patient Expenditure ($)
FSS WAC AWP
Norditropin Novo Nordisk Growth Hormone Deficiency ----- 32,453 38,944
Humatrope Eli Lilly Growth Hormone Deficiency 17,874 29,974 35,968
Genotropin Pfizer Growth Hormone Deficiency 22,547 25,053 30,064
12
America’s Health Insurance PlansHigh-Price Drugs Based Upon Estimated Annual Per-Patient Expenditure
Infectious Diseases, Hepatitis C
Drug Mfr Indication Annual Per-Patient Expenditure ($)
FSS WAC AWP
Harvoni Gilead Hepatitis C Infection (24-week course) 170,952 189,000 226,800
Sovaldi Gilead Hepatitis C Infection (24-week course) 99,720 168,000 201,600
Viekira Pak Abbvie Hepatitis C Infection (24-week course) 123,816 166,638 199,968
Olysio Janssen Hepatitis C Infection (24-week course) 130,722 132,720 159,264
Harvoni Gilead Hepatitis C Infection (24-week course) 85,476 94,500 113,400
Sovaldi Gilead Hepatitis C Infection (24-week course) 49,860 84,000 100,800
Viekira Pak Abbvie Hepatitis C Infection (24-week course) 61,908 83,319 99,984
Technivie Abbvie Hepatitis C Infection (24-week course) 56,589 76,653 91,983
Olysio Janssen Hepatitis C Infection (24-week course) 65,361 66,360 79,632
Daklinza BMS Hepatitis C Infection (24-week course) 47,157 63,000 75,600
Schering/
Pegintron Hepatitis C 19,744 39,804 47,765
Merck
Pegasys Roche Hepatitis C 27,864 39,612 47,535
Copegus Roche Hepatitis C ----- 39,271 47,125
Schering/
Rebetol Hepatitis C 17,512 17,802 21,362
Merck
Infectious Diseases, HIV/AIDS
Drug Mfr Indication Annual Per-Patient Expenditure ($)
FSS WAC AWP
Fuzeon Roche Anti-Retroviral Treatment of HIV-1 Infection 27,085 37,596 45,108
Viracept GSK/ViiV Treatment of HIV-1 Infection 10,150 11,692 14,031
Viread Gilead Treatment of HIV-1 Infection 6,807 11,200 13,440
Infectious Diseases, Other Infections
Drug Mfr Indication Annual Per-Patient Expenditure ($)
FSS WAC AWP
Valcyte Genentech Treatment of Cytomegalovirus Retinitis 37,417 54,752 65,702
Prevention of Respiratory Syncytial Virus
Synagis MedImmune 31,554 35,571 42,685
Disease
13
America’s Health Insurance PlansHigh-Price Drugs Based Upon Estimated Annual Per-Patient Expenditure
Immune System Disorders
Drug Mfr Indication Annual Per-Patient Expenditure ($)
FSS WAC AWP
Ilaris Novartis Systemic Juvenile Idiopathic Arthritis23 378,696 385,320 462,384
Promacta Novartis Idiopathic Thrombocytopenia Purpura 100,404 107,664 129,192
Esbriet Intermune Idiopathic Thrombocytopenia Purpura 92,184 93,600 112,320
Stelara Janssen Psoriasis (90mg dosing)24 47,770 81,900 98,275
Nplate Amgen Chronic Immune Thrombocytopenia 68,189 75,733 90,879
Tysabri BiogenIdec Crohn’s Disease 37,574 63,096 75,715
Simponi Janssen Ulcerative Colitis 38,372 56,345 67,614
Cosentyx Novartis Plaque Psoriasis 53,840 54,840 70,195
Enbrel Amgen Plaque Psoriasis 30,879 51,835 62,202
Humira AbbVie Crohn’s Disease/Ulcerative Colitis, adults 19,260 48,372 58,044
Humira AbbVie Plaque Psoriasis, adults 17,892 44,916 53,904
Rheumatoid Arthritis/Psoriatic
Simponi Janssen 20,837 41,997 50,396
Arthritis/Ankylosing Spondylitis
Rheumatoid Arthritis/Psoriatic
Enbrel Amgen 24,703 41,468 49,762
Arthritis/Ankylosing Spondylitis
Rheumatoid Arthritis/Psoriatic
Humira AbbVie 16,500 41,460 49,752
Arthritis/Ankylosing Spondylitis
Rheumatoid Arthritis/Psoriatic
Cimzia UCB Pharma 13,616 39,563 47,475
Arthritis/Ankylosing Spondylitis/Crohn’s Disease
Entyvio Takeda Ulcerative Colitis/Crohn’s Disease (8 doses/year) 38,556 38,556 46,260
Orencia BMS Adult Rheumatoid Arthritis (SC dosing) 18,175 38,436 46,128
Benlysta GSK Systemic Lupus Erythematosus 34,230 36,285 43,542
Orencia BMS Adult Rheumatoid Arthritis (IV dosing) 23,105 33,054 39,662
Crohn’s Disease/Ulcerative
Remicade Janssen 20,705 32,686 39,223
Colitis/Psoriasis/Psoriatic Arthritis
Xeljanz Pfizer Rheumatoid Arthritis 26,826 32,206 38,647
Rituxan Genentech Rheumatoid Arthritis 26,216 29,916 35,898
Stelara Janssen Psoriasis (45mg dosing)24 27,190 25,655 30,785
Xolair Genentech Chronic Idiopathic Urticaria 8,818 10,488 12,586
14
America’s Health Insurance PlansHigh-Price Drugs Based Upon Estimated Annual Per-Patient Expenditure
Multiple Sclerosis
Drug Mfr Indication Annual Per-Patient Expenditure ($)
FSS WAC AWP
H.P. Acthar
Mallinckrodt Exacerbations of Multiple Sclerosis25 151,035 170,170 204,205
Gel
Lemtrada Genzyme Multiple Sclerosis (5 day course/year)26 98,980 98,750 118,500
Gilenya Novartis Relapsing Multiple Sclerosis 64,644 69,972 83,964
Tecfidera BiogenIdec Relapsing Multiple Sclerosis 54,012 69,456 83,352
Rebif EMD Serono Relapsing Multiple Sclerosis (22 or 44ug dosing) 28,575 69,117 82,940
Betaseron Bayer Relapsing Multiple Sclerosis 34,809 67,775 81,330
Sanofi-
Aubagio Relapsing Multiple Sclerosis 50,232 64,596 77,520
Aventis
Avonex BiogenIdec Relapsing Multiple Sclerosis 49,948 64,032 76,836
Plegridy BiogenIdec Relapsing Multiple Sclerosis 59,496 64,032 76,836
Tysabri BiogenIdec Relapsing Multiple Sclerosis 37,574 63,096 75,715
Extavia Novartis Relapsing Multiple Sclerosis 51,516 60,576 72,696
Lemtrada Genzyme Multiple Sclerosis (3 day course/year)26 59,388 59,250 71,100
Pulmonary Arterial Hypertension
Drug Mfr Indication Annual Per-Patient Expenditure ($)
FSS WAC AWP
Tyvaso United Pulmonary Arterial Hypertension 106,872 163,800 196,560
Tracleer Acetilion Pulmonary Arterial Hypertension 58,488 98,640 118,368
Adempas Bayer Pulmonary Arterial Hypertension 83,328 98,268 117,912
Orenitram United Pulmonary Arterial Hypertension27 71,526 95,550 114,660
Letairis Gilead Pulmonary Arterial Hypertension 35,700 88,368 106,116
Opsumit Acetilion Pulmonary Arterial Hypertension 35,578 86,220 103,464
Organ Transplant Related
Drug Mfr Indication Annual Per-Patient Expenditure ($)
FSS WAC AWP
Prophylaxis of Organ Rejection/
Nulojix BMS 4,952 32,305 38,765
Kidney Transplant
Cellcept Genentech Cardiac or Hepatic Transplant (3g/day dosing) 15,558 30,858 37,029
Cellcept Genentech Renal Transplant (2g/day dosing) 10,372 20,572 24,686
Myfortic Novartis Organ Rejection/Kidney Transplant, adults 10,113 12,940 15,528
15
America’s Health Insurance PlansHigh-Price Drugs Based Upon Estimated Annual Per-Patient Expenditure
Other Miscellaneous Conditions
Drug Mfr Indication Annual Per-Patient Expenditure ($)
FSS WAC AWP
Gattex NPS Pharma Short Bowel Syndrome2 378,084 376,200 451,440
Krystexxa Savient Chronic Gout 113,160 336,000 403,200
Sabril Lundbeck Refractory Complex Partial Seizures28 101,580 158,508 190,224
Signifor Novartis Cushing’s Syndrome29 135,864 138,084 165,696
Exjade Novartis Transfusional Iron Overload 109,568 122,383 146,860
Jakafi Incyte Myelofibrosis 91,621 119,844 143,808
H.P. Acthar
Mallinckrodt Infantile Spasms30 90,621 102,102 122,523
Gel
Ofev Boehringer-Ing Idiopathic Pulmonary Fibrosis 71,664 96,000 115,200
Hetlioz Vanda Sleep Disorder 31,452 67,362 80,838
Xolair Genentech Asthma 52,908 62,930 75,516
Zorbtive EMD Serono Short Bowel Syndrome31 17,384 29,068 34,880
Epogen Amgen Anemia due to Zidovudine Treatment of HIV ----- 17,505 21,006
Epogen Amgen Anemia due to Chronic Kidney Disease ----- 13,128 15,754
Appendix Footnotes
1 Drugs used to treat Hereditary Angioedema (FIRAZYR and KALBITOR) 15 Patients being treated with TOBI PODHALER are treated on alternating
are administered only at the time of an attack. The number of attacks months.
any patient can experience over the course of a year can vary widely. 16 Assumes a 20mg/day dose.
Here, we assumed 1-3 attacks per year based upon counts of attacks 17 Assuming the daily maximum dose of 17.5mL X 1.1g/mL solution
reported in the clinical trials section of the package insert. (19g/day), then each package of four, 25mL vials is about a one week
2 Assumed a 75kg patient. supply.
3 Assumed a body surface area of 1.7m2. 18 Using the example in the package insert, assuming a 68kg patient and
4 Dosing is 10mg/kg on day 1 of a 21-day cycle; assuming a 75kg patient a dose of 20mg/kg would consume 28 of the 50mg vials per dose.
and 17 doses administered per year. Therefore, each infusion would require three of the ten-vial packages
5 Dosing is 25mg/m2 every three weeks; assuming a body surface area (50mg/vial X 10 vials/package). Assumed two infusions per month.
of 1.7m2 and 17 doses administered per year. 19 Assuming an 8kg infant and a dose of 200mg/kg/day would require a
6 YERVOY dosing is 3mg/kg every three weeks for a total of four doses. dose of 1600mg/day (8 X 200mg tablets per day). Therefore, a one
Assuming a 75kg patient, then one dose would be 225mg or 900mg month supply would require four bottles of the 60 X 200mg capsules.
for all four doses. 20 For pediatric patients, assuming a body weight of 15kg and a dose of
7 Dosing is 2mg/kg every three weeks; assumed a 75kg patient and 17 10mg/kg/day, will require 3 X 50 mg capsules per day.
doses administered per year. 21 Assuming a 75kg patient and 26 doses per year.
8 Dosing is up to 3.6mg/kg every three weeks; assuming a 75kg patient 22 Assumed a dose of 50mg per day administered as one 25mg capsule
and 17 doses administered per year. twice per day.
9 Each dose is 30mg/m2, and assuming an average body surface area of 23 ILARIS dosing in Juvenile Arthritis patients is 300mg every four weeks
1.7m2 and 36 doses per year. or two 180mg vials per month. Dosing in Periodic Syndrome patients is
10 Dosing is 1.8 mg/kg and assuming a 75kg patient and up to a 150mg every eight weeks or six of the 180mg vials per year.
maximum of 16 doses per year. 24 A total of five doses of STELARA, either 90mg or 45mg depending on
11 Dosing is 2500 IU/m2 twice per month; assuming a 12 year-old patient the patient’s body weight, are administered over one year.
with a body surface area of 1.33m2. 25 Assumes a middle-dose of 100 USP Units/day for 20 days; or one vial
12 Dosing is 25,000 IU/m2 for six doses administered over a two week every four days. Assumes one course of treatment per year.
period. Based upon clinical data reported in the package insert, an 26 LEMTRADA is administered as one 12mg vial per day for five days;
average ALL patient is about 10 years-old with a body surface area of followed one year later, by one 12 mg vial per day for three days. Thus
1.14m2; therefore, assumed each dose to be 28,500 IU’s. ERWINAZE in any given year, some patients will be taking their first, 5-day course;
is packaged in a carton of 3 vials X 10,000 IU/vial; thus, one carton is while other patients will be taking their second course of 3-days.
needed per dose. Assumed only one, six-dose course of therapy per 27 Dosing of ORENITRAM is titrated to tolerability and therefore
year. individualized. However, as reported in the FDA-approved package
13 Assumes the 4mg/day dose for days 1-21 or a 28-day cycle. insert, the average dosing of patients participating in clinical trials was
14 Assumed eight cycles of treatment per year. 3.4mg twice per day. Thus, an average patient will take on 2.5mg
16
America’s Health Insurance PlansHigh-Price Drugs Based Upon Estimated Annual Per-Patient Expenditure
tablet and one 1.0mg tablet per day. The average patient will need 29 Assumes the 0.9mg/mL dose twice daily.
seven prescriptions of the 2.5mg and 1.0mg tablets per year. 30 Dosing in infantile spasms is 75 USP Units/m2 twice daily. Assumed a
28 Dosing is 2000-3000mg/day, assuming a middle-dose of 2500mg/day body surface area of 0.30m2 yielding a dose of 45 USP Units per day.
then requires five of the 500mg tablets per day. Over the course of 31 Assumed an 8mg per day maximum dose administered daily for four
one year, a typical patient would require 18 bottles of the 100 X weeks.
500mg tablets per bottle.
Related Topics
1 Altarum Institute. Center for Sustainable Health Spending: Spending
Brief (#16-02). 16 Feb 2016.
http://altarum.org/sites/default/files/uploaded-related-files/CSHS-
Spending-Brief_February_2016.pdf
2 IMS Institute for Healthcare Informatics. Global Medicines Use in 2020:
Outlook and Implications. November 2015.
http://www.imshealth.com/en/thought-leadership/ims-
institute/reports/global-medicines-use-in-2020
ahip.org | info@ahip.org 3 America’s Health Insurance Plans. Specialty Drugs: Issues and
Challenges. AHIP Issue Brief. July 2015.
https://www.ahip.org/IssueBrief/Specialty-Drugs-Challenges-Issues/
601 Pennsylvania Avenue, NW South Building 4 U.S. Department of Veterans Affairs. The Office of Acquisitions and
Logistics. The Federal Supply Schedule: Pharmaceutical Pricing Data.
Suite 500, Washington, DC 20004 http://www.va.gov/oal/business/fss/pharmPrices.asp
5 Copyright 1974-2015 Truven Health Analytics Inc. All rights reserved.
6 S.W. Schondelmeyer and L. Purvis. Rx Price Watch Report: Trends in
Retail Prices of Specialty Prescription Drugs Widely Used by Older
Americans, 2006 to 2013. AARP Public Policy Institute. November 2015.
7 The Associated Press. Obama Administration Sets Stage for a Debate
on Drug Costs. The New York Times. 20 Nov 2015.
http://www.nytimes.com/aponline/2015/11/20/us/politics/ap-us-drug-
costs.html?r=0
8 A. Goldstein. Sharp Increase in Drug Costs Draw Hundreds to
Government Forum. The Washington Post. 20 Nov 2015.
https://www.washingtonpost.com/news/to-your-
health/wp/2015/11/20/sharp-increases-in-drug-costs-draw-hundreds-
to-government-forum/
17
America’s Health Insurance PlansYou can also read