Proposed Waiata Shores Local Centre - Retail Impact Assessment 7 August 2018 - draft - Auckland Council
←
→
Page content transcription
If your browser does not render page correctly, please read the page content below
Proposed Waiata Shores
Local Centre
Retail Impact Assessment

7 August 2018 – draft
Proposed Waiata Shores
Local Centre
Retail Impact Assessment

Prepared for
Woolworths New Zealand Ltd

Document reference: WNZ002.18
Date of this version: 7 August 2018
Report author(s): Derek Foy
Director approval: Greg Akehurst
www.me.co.nz

Disclaimer: Although every effort has been made to ensure accuracy and reliability of the information
contained in this report, neither Market Economics Limited nor any of its employees shall be held liable for
the information, opinions and forecasts expressed in this report.

Contents
1     INTRODUCTION ................................................................................................................. 1

1.1   KEY ISSUES............................................................................................................................ 1

1.2   OBJECTIVE ............................................................................................................................ 1

1.3   METHODOLOGY..................................................................................................................... 2

2     CURRENT ENVIRONMENT OVERVIEW ............................................................................... 4

2.1   LOCAL GEOGRAPHY AND CATCHMENT ......................................................................................... 4

2.2   HOUSEHOLD PROJECTIONS ....................................................................................................... 5

2.3   DEMAND PROJECTIONS ........................................................................................................... 6

2.4   CENTRES ASSESSMENT ............................................................................................................ 7

3     PROPOSED DEVELOPMENT ............................................................................................. 10

3.1   THE PROPOSED DEVELOPMENT ............................................................................................... 10

3.2   CENTRE PARAMETERS ........................................................................................................... 11

3.3   PERFORMANCE ASSESSMENT .................................................................................................. 12

4     IMPACT ASSESSMENT...................................................................................................... 15

4.1   IMPACT TYPES ..................................................................................................................... 15

4.2   DIRECT RETAIL IMPACTS......................................................................................................... 15

4.3   INDIRECT CENTRE IMPACTS ..................................................................................................... 20

5     ECONOMIC AND OTHER BENEFITS .................................................................................. 22

5.1   TRAVEL EFFICIENCY AND ACCESSIBILITY ..................................................................................... 22

5.2   SHORT TERM CONSTRUCTION EFFECTS ...................................................................................... 22

5.3   EMPLOYMENT EFFECTS .......................................................................................................... 22

6     PLANNING CONTEXT ....................................................................................................... 24

6.1   REGIONAL POLICY STATEMENT ............................................................................................... 24

6.2   UNITARY PLAN .................................................................................................................... 24

7     CONCLUSION................................................................................................................... 25

Figures
FIGURE 2.1: STUDY AREA CATCHMENTS ........................................................................................................ 5

FIGURE 2.2: STUDY AREA HOUSEHOLD PROJECTIONS ....................................................................................... 6

FIGURE 2.3: STUDY AREA SUPERMARKET AND GROCERY DEMAND PROJECTIONS ($M) ........................................... 6

FIGURE 2.4: STUDY AREA OTHER RETAIL DEMAND PROJECTIONS ($M, EXCLUDES SUPERMARKET AND GROCERY))....... 6

FIGURE 2.5: STUDY AREA EMPLOYMENT COUNTS (MECS, 2017) ..................................................................... 8

FIGURE 3.1: PROPOSED DEVELOPMENT SITE LOCATION AND SPATIAL CONTEXT................................................... 10

FIGURE 3.2: PROPOSED DEVELOPMENT SITE LAYOUT ..................................................................................... 11

FIGURE 3.3: WAIATA SHORES COUNTDOWN SALES POTENTIAL (2020) ........................................................... 13

FIGURE 4.1: SUPERMARKET SALES WITHOUT WAIATA SHORES COUNTDOWN .................................................... 16

FIGURE 4.2: DIRECT RETAIL IMPACTS ON SUPERMARKET SALES (IN 2020) ......................................................... 17

FIGURE 4.3: POTENTIAL EMPLOYMENT CHANGE DUE TO WAIATA SHORES’ NON-SUPERMARKET COMPONENT ........ 19
1          Introduction
Market Economics Ltd (M.E) has been commissioned by Woolworths New Zealand Ltd to assess the
potential economic and retail impacts of a proposed plan change and resource consent that would enable
a Countdown supermarket and co-located commercial and retail activities, adjacent to the new Waiata
Shores residential development that is occurring on the site of the former Manukau Golf Course, on Great
South Road, Takanini, in Auckland.

1.1        Key issues
The application is for a change to the Auckland Unitary Plan (Operative in Part) (AUP), from Residential –
Mixed Housing Urban, to Local centre. This report assesses the merits of the Plan Change application, and
draws conclusions as to whether the proposal is the best way to meet the objectives and policies of the
AUP.

The proposed Countdown store would represent an increase of retail, and particularly supermarket supply
in the Manurewa-Takanini area, and therefore change how consumers in the area access retail goods. That
change is likely to result in some of the spending that is currently directed to existing retail businesses in
the area being diverted away from those existing stores to instead be directed to the Waiata Shores centre.
This diversion will be likely to result in some decrease in sales of existing supermarkets, with potential flow-
on effects for the retail centres those supermarkets are in. The magnitude and distribution of those effects
may be influenced by the proposed co-location of a small amount of other business activity (potentially
retail, services and offices) on the site. These effects are a key consideration when assessing the merits of
the Plan Change, from a retail and economics perspective.

1.2        Objective
The specific objectives of this report are to:

                •   Examine current and future demand (to 2038) for supermarket capacity in the study
                    area (as defined in section 2.1).

                •   Determine current supermarket supply in the study area, and identify any likely changes
                    to that supply that is currently in the pipeline.

                •   Assess the likely direct retail effects of the proposed supermarket on existing retail
                    centres in the study area.

                •   Assess the likely cumulative direct retail effects of the proposed supermarket and any
                    other identified new supermarket supply on existing retail centres in the study area.

                •   Consider the likely flow-on, indirect effects of the proposed supermarket that will occur
                    as a result of the direct retail effects.

                •   Consider other positive and negative economic effects of the proposed supermarket.

Page | 1
• Draw conclusions as to whether the proposal is the best way to meet the objectives and
policies of the AUP.
1.3 Methodology
This section describes the methodology applied to estimate the direct and indirect retail impacts of the
proposed Countdown Waiata Shores supermarket. The key to the assessment is a model that analyses
consumer demand (in dollar terms) directed to supermarkets and food and grocery stores in Auckland, and
is built on an understanding of consumer origin-destination patterns. The model is calibrated to describe
the current demand-supply situation which serves as the basis to quantify the effect of changes (such as
through the creation of new supply in the market or market growth) to that situation. The model’s engine
identifies dollar spending power from households (according to socio-demography), tourists and
businesses, and includes demand projections based on household (and other growth). Modelled demand
projections take into account projected changes in retail spend per household, and estimated supermarket
sales for existing stores.
To assess the expected retail and economic effects of the proposed supermarket, the key steps have been:
• Quantify market size and growth.
• Assess how supermarkets and other retail and service activities in the southern part of
Auckland currently meet consumers’ demand.
• Assess how supermarket sales and other retail and service activity will change from
current levels given expected market growth, assuming no change in the competitive
environment (number or size of supermarkets). This becomes the assessment baseline
against the ‘with impacts’ scenarios are compared.
• Estimate sales performance of the proposed Waiata Shores Countdown, and
employment in the rest of the Waiata Shores centre.
• Identify any other expected changes in supermarket and retail supply in the study area,
and estimate the sales performance of that increased supply.
• Assess changes in the sales of existing supermarkets with the addition of Waiata Shores
Countdown to the supermarket supply environment, to produce trade competition
impact estimates.
• Assess the cumulative effects of changes in the sales of existing supermarkets with the
addition of both the Waiata Shores Countdown and any other changes in supply to the
local supermarket supply environment, to produce trade competition impact estimates.
• Repeat that cumulative effects assessment for other (non-supermarket) activities in the
proposed centre
• Assess the likely flow-on effects of the trade competition impacts, to produce estimates
of the indirect impacts of the proposed Local centre. It is these indirect impacts that are
relevant in RMA terms.
Page | 2• Summarise the implications and significance of these indirect impacts in RMA terms,
considering the distinction between trade competition and effects that are of
importance to urban form and sustainability.
• Identify other costs and benefits of the proposed Plan Change, and draw conclusions as
to whether the proposal is the best way to meet the objectives and policies of the AUP.
This approach has been applied in applications for a number of other retail consents and plan changes, and
the findings accepted as fit for purpose.
Page | 32 Current environment overview
This section describes how the supermarket marketplace currently operates in the Manurewa/Takanini
area, to place the proposed supermarket in context. The assessment covers the current (2018) demand
situation, and examines future growth projections for household growth and supermarket demand.
2.1 Local geography and catchment
The proposed store will be located on Great South Road, a busy arterial road that runs north-south through
South Auckland. The site is adjacent to the interchange between Great South Road and the Auckland
Southern Motorway. The catchment of the store will be constrained by the lower reaches of the Manukau
Harbour to the west, and will be heavily influenced by the location of the motorway to the east. The site is
also adjacent to areas of Light and Heavy Industry zone to the east and west, but is otherwise surrounded
by large areas of residential zone, including the Waiata Shores residential development, which is currently
being developed on the site of the former Manukau Golf Course site.
For this assessment we have split the main trading area of the proposed store into five subcatchments,
defined so as to delineate areas of similar accessibility, demography and proximity to competitor stores.
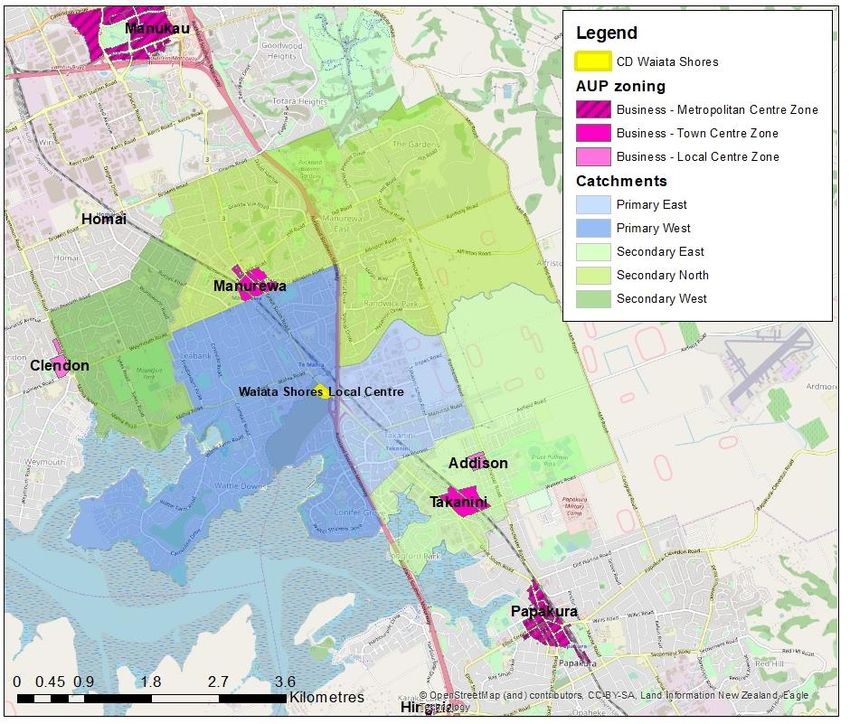
The five catchments are shown in Figure 2.1, and are:
• Primary West. This is the catchment the proposed centre is in, and takes in Wattle
Downs, the part of Conifer Grove west of the motorway, the parts of Manurewa south
of Weymouth/Alfriston Roads, and Manurewa, and as far west as James Cook High
School. There are no other supermarkets, Local or Town centres in this catchment,
although the Manurewa Town centre is adjacent to the northern edge of the
catchment. The proposed Local centre will be the closest centre larger than a
Neighbourhood centre for most of this catchment.
• Primary East. This catchment is immediately east of the Motorway, and extends as far
east as Porchester Road, south to the northern end of the Takanini commercial strip
(Bunnings Takanini) and north to the northern edge of the Light Industry zone. This is a
small catchment, both in terms of household numbers and geographic area, with
almost half zoned for industry. As for the Primary West, there are no other
supermarkets, Local or Town centres in this catchment. This catchment will access
Waiata Shores by passing under the Motorway, using Great South Road.
• Secondary East. This is immediately east of the Primary East catchment, and takes in
the Future Urban Zone (FUZ) between Porchester and Mill Road, taking in the new
Addison residential development, and the Takanini Town centre.
• Secondary North also takes in a large area of FUZ, as well as the established suburbs of
Randwick Park and The Gardens, wrapping around the northern edge of the Primary
West catchment, taking in both the Manurewa Town centre and Manurewa North
residential area.
Page | 4• Secondary West is the area west of the Primary West catchment, and extends as far as
the Clendon Local centre in the east. This catchment is predominantly residential, with
very little in the way of retail activity.
Figure 2.1: Study area catchments
2.2 Household projections
The largest catchment in terms of resident households now is the Secondary North (8,070 households),
followed by Primary West (7,010). The other three catchments are somewhat smaller, with between 1,500
and 3,000 households now (Figure 2.2). In total there are nearly 22,000 households resident in the Waiata
Shores Local centre’s main trading area (MTA, comprised of the Primary and Secondary catchments).
Ongoing growth will see this increase by around 21% in the next two decades to reach 26,460 households,
with the main drivers of this growth being the Primary West (+1,500 households), and Secondary East
(+1,150) and North (+1,430 households). The Primary East and Secondary West are very low growth
catchments.
Page | 5Figure 2.2: Study area household projections
Growth 2018-2038
Catchment 2018 2021 2023 2028 2033 2038
n %
Primary West 7,010 7,470 7,770 8,350 8,460 8,500 1,490 21%
Primary East 1,500 1,540 1,560 1,570 1,600 1,620 120 8%
Secondary East 2,300 2,530 2,680 3,030 3,250 3,450 1,150 50%
Secondary West 3,040 3,150 3,220 3,310 3,370 3,390 350 12%
Secondary North 8,070 8,410 8,630 8,990 9,290 9,500 1,430 18%
Total MTA 21,920 23,100 23,860 25,250 25,970 26,460 4,540 21%
2.3 Demand projections
Projections of supermarket and grocery store spending by study area households show similar patterns to
household projections. Household growth in the MTA is expected to drive an increase in demand for
supermarket and grocery store products of $93m to 2038 (42%) (Figure 2.3). These growth rates take into
account historically observed trends for households to spend more on retail goods over time1, which is why
the demand projections in Figure 2.3 exceed the household growth rates in Figure 2.2.
Figure 2.3: Study area supermarket and grocery demand projections ($m)
Growth 2018-2038
Catchment 2018 2021 2023 2028 2033 2038
n %
Primary West $ 67.3 $ 71.9 $ 75.0 $ 80.9 $ 86.2 $ 91.0 $ 23.6 35%
Primary East $ 16.2 $ 17.4 $ 18.1 $ 20.4 $ 22.3 $ 24.3 $ 8.1 50%
Secondary East $ 24.9 $ 28.2 $ 30.4 $ 34.3 $ 38.3 $ 42.5 $ 17.5 70%
Secondary West $ 30.2 $ 32.3 $ 33.7 $ 36.5 $ 39.1 $ 41.4 $ 11.2 37%
Secondary North $ 81.5 $ 86.9 $ 90.6 $ 98.5 $ 106.3 $ 113.6 $ 32.1 39%
Total MTA $ 220.1 $ 236.7 $ 247.9 $ 270.7 $ 292.0 $ 312.7 $ 92.6 42%
Figure 2.4: Study area other retail demand projections ($m, excludes supermarket and grocery))
Growth 2018-2038
Catchment 2018 2021 2023 2028 2033 2038
n %
Primary West $ 118.2 $ 126.4 $ 131.9 $ 142.4 $ 151.9 $ 160.8 $ 42.5 36%
Primary East $ 28.9 $ 31.0 $ 32.5 $ 36.6 $ 40.1 $ 43.8 $ 14.9 52%
Secondary East $ 45.9 $ 51.7 $ 55.6 $ 62.4 $ 69.4 $ 77.0 $ 31.0 68%
Secondary West $ 48.4 $ 51.8 $ 54.1 $ 58.8 $ 63.1 $ 67.1 $ 18.8 39%
Secondary North $ 144.3 $ 154.1 $ 160.6 $ 174.7 $ 188.6 $ 201.8 $ 57.5 40%
Total MTA $ 385.8 $ 415.1 $ 434.7 $ 475.0 $ 513.2 $ 550.5 $ 164.8 43%
1 Assumed to continue at the average annual rate of 1%, for this assessment
Page | 6Growth in other core retail2 and hospitality3 demand is projected to grow at a similar rate to supermarket demand, increasing 43% in the next two decades from $386m to $551m (+$165m) (Figure 2.4). Although these growth rates are not fast in an Auckland context, they still represent a significant new amount of spend that will be resident in the area in the future. 2.4 Centres assessment There are a number of centres near the proposed Waiata Shores Local centre that could potentially be impacted by a redistribution of customer movements as a result of the proposed Plan Change. The magnitude of those effects is assessed in section 4.3. In this section we provide an overview of the economic composition and role of these centres, so as to inform the subsequent impact assessment. The centres are defined as groupings of meshblocks for this assessment, because the underlying business demography is only published at that resolution. That means that some centres take in a broader area than just the centre zoning, and also include some centre-fringe activity which is not actually in the centre zone. The centres summarised below are the Manukau and Papakura Metropolitan centres, the Manurewa and Takanini Town centres, Clendon, Hingaia and Addison Local centres, and a number of neighbourhood centres. 2.4.1 Manukau Metropolitan centre Manukau is one of the largest centres in Auckland. The core of the centre is zoned Metropolitan centre, anchored by the large Westfield Mall (c. 47,000m2), and that is surrounded by large areas of Mixed Use and General Business zone, as well as both Light and Heavy Industry zones. Over 9,000 employees (MECs4) are employed in the core of the centre (Figure 2.5), in 700 businesses, with a further 7,500 MECs employed in surrounding Mixed Use and General Business zones. There are a wide range of retail businesses in the centre, including three supermarkets, most of New Zealand’s largest retail brands across both large and small formats, and a large presence of services and office-based businesses. Manukau is a transport hub, has many community services, a tertiary institute, large Council offices, and an increasing number of residential apartments. Manukau is some 5.5km north of Waiata Shores. 2.4.2 Papakura Metropolitan centre Papakura is a much smaller Metropolitan centre than Manukau, although there are still more than 2,600 MECs employed in the centre, in nearly 600 businesses. Compared to Manukau, Papakura has a more limited retail range, especially in the large format and comparison retail sectors, and less office-based employment (280 office MECs in Papakura). There are three supermarkets in the centre (two Countdowns and a Pak’n Save), and a wide range of hospitality and services businesses. Over at least the last decade Papakura has struggled to thrive as a retail destination, with the development of the Takanini Town centre to the north drawing away some (especially large format) retailers, and relatively limited development in the centre. 2 All retail excluding supermarkets and grocery stores, automotive, hardware stores and garden centres 3 Cafes, restaurants, bars and takeaways 4 Modified employment count: a measure of employment that includes both working proprietors and paid employees Page | 7
2.4.3      Manurewa Town centre
Manurewa is a large Town centre, with around 47,000m2 of GFA, including the 17,000m2 Southmall, which
is anchored by a New World supermarket. There is also 21,000m2 of other (mostly mainstreet) retail and
services space and nearly 9,000m2 of community services space (library, police station, Cosmopolitan Club).
There are over 1,250 MECs employed in Manurewa, making it about half the size of Papakura. A wide range
of retail and services storetypes are represented, although there is limited large format retail. The services
and food and beverage services sectors are particularly strong, and there are nearly 80 office-based jobs,
and nearly 300 public admin jobs (mostly based at the police station).

2.4.4      Takanini Town centre
The Takanini Town centre has developed around what was originally constructed as the Southgate large
format retail centre in 2004. The centre has now grown to 49,000m2 GFA, including The Warehouse
(6,200m2), Countdown supermarket (3,400m2), a Mitre 10 Mega hardware store (10,400m2), a 2,100m2
Carters building supplies store, and some 27,000m2 of (predominantly LFR) retail across the rest of the
centre. Other activities represented in the centre include food and beverage services, fresh food retail,
comparison retail, post office, several banks, travel and real estate agents, and a gym. The centre is very
heavily retail focussed, with 71% of the 840 MECs employed in the centre being engaged in retail, the same
proportion as Clendon, but much more than the larger centres in Figure 2.5 which have only 27-38% of
their employment in retail.

Figure 2.5: Study area employment counts (MECs, 2017)

                                 Manukau Papakura Manurewa Takanini             Clendon    Hingaia

Supermarket and grocery stores         310        309         117        133        125            9
Other food                              44         21          24          12         20       -
Comparison retail                    1,426        291         143        147          90           11
Food and beverage services             454        363         173        128          95           51
Hardware and garden                    304         26          15        179        -          -
Retail                               2,537      1,009         471        600        331            72
Office-based                         2,165        284          79          23         10           61
Public admin                         2,162        291         289        -            30       -
Health and education                    56         43          18          21       -           40
Services                             1,388        513         374          54         67       100
Offices and services                 5,771      1,131         760          98       107        200
Industry                               949        427          70        111          23        65
Automotive                             110         73          52          35          3         4
Industry                             1,059        500         122        146          25        69
Total                                9,367      2,640       1,353        844        463        340

2.4.5      Local centres
Addison

A 1.3ha Local centre has been zoned at Addison, less than 400m2 north of the existing Takanini Town centre,
and 2.5km south-east of Waiata Shores. The centre has not yet been developed, but will eventually provide
Page | 8
for the local needs of the population in the surrounding (80ha+) Addison residential development. Indicatively the 1.3ha centre might accommodate 4,000-6,000m2 GFA. Clendon Clendon is a large local centre, around 4km east of Waiata Shores. The largest tenants in the centre are The Warehouse, and a new 6,000m2 Pak’n Save (which opened at the end of 2017, replacing the Clendon New World). There are many smaller tenants, including a range of fresh food retail, takeaways (bakery, Subway, McDonalds café), service businesses (medical centre, banks), and a Work and Income NZ office. Total centre GFA is just over 20,000m2, and there is a further 2,600m2 building housing the Clendon community centre. Total centre employment is nearly 500 MECs. Hingaia Hingaia is a peninsula to the west of the Southern Motorway, some 5km south of Waiata Shores. Residential development has been underway in the area for the last decade, and will ultimately convert the formerly rural area into urban residential. A relatively large area of Mixed Use zone (15.3ha) and a 1.7ha Local centre has been zoned. Most of that land is as yet undeveloped, although there is already some 5,000m 2 of GFA on a 1.9ha block within the Mixed Use zone. That development includes a medical centre (physio, GP, pharmacy, orthodontist, dentist), dairy, fresh and takeaway food retail and household services, and a 700m2 daycare. Nearly 800m2 of that GFA is above ground floor space. There are 340 MECs employed in the single meshblock where the Hingaia Mixed Use zone is, although around half of that is likely to be employed in non-Mixed Use zone businesses, including a retirement village and daycare. 2.4.6 Neighbourhood centres There are 24 Neighbourhood centres5 in the Main Trade Area catchment shown in Figure 2.1. They are groups of a small number of businesses, predominantly retail, that service the local convenience needs of their communities. On average there are four tenancies per centre, with the largest (Conifer Grove) having 12 tenancies, and four centres having only one tenancy each. Every centre has a dairy or small grocery store, with some having two. Other common storetypes include takeaways, liquor retail, hairdressers and bakeries. A smaller number of centres have other stores such as a butcher, laundromat, pharmacy or restaurant. None of the 24 centres are closer than 400m to another Neighbourhood centre, with most being 600-700m apart. These distances reflect walkable catchments, and the local role these centres play. There are no parts of the residential zones inside the MTA that are more than 1km from either a Neighbourhood or higher order (i.e. Local or Town) centre. Parts of Waiata Shores would be further than 1km from their nearest centre without the proposed Waiata Shores centre, by virtue of inaccessibility between Waiata Shores and neighbouring areas due to the motorway (in the east) and the industrial area/creek (in the west). 5 Takanini (Manuroa Rd, Challen Cl); Conifer Grove, Wattle Downs (Moor Park, Clayton Park, Mcdivitt St), Manurewa South (Churchill Ave, Greenmeadows Ave), Manurewa Central (McAnnalley St, Alfriston Rd, Weymouth Rd, Beatty Ave), Manurewa West (Leabank, McKean Ave, Winsford St, Gloucester St), Clendon (Sharland Ave), Manurewa North (Halsey Rd, Browns Rd, Grand Vue Rd, Hillpark), The Gardens, Totara Park, Randwick Park. Page | 9
3 Proposed development
3.1 The proposed development
Woolworths New Zealand proposal is to develop a new 4,000m2 Countdown supermarket, and a maximum
of an additional 2,000m2 (gross floor area, or ‘GFA’) of space on the site of the former Manukau Golf Course
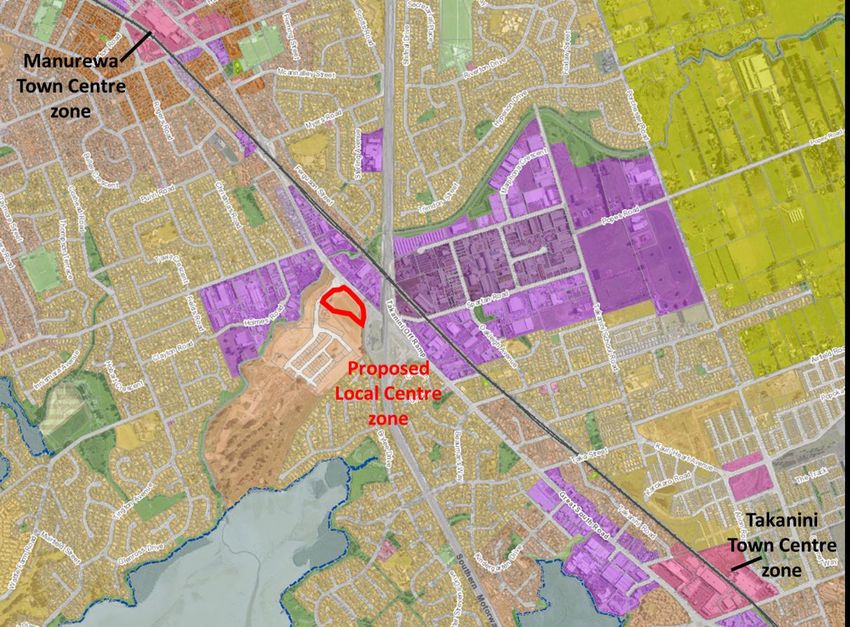
in Takanini (referred to in Council records as 1V Great South Road, Conifer Grove). The site is roughly half
way between the Manurewa and Takanini Town centres (Figure 3.1). The site is zoned Residential – Mixed
Housing Urban by the AUP, and is proposed to change to Local centre.
Figure 3.1: Proposed development site location and spatial context
The proposal is for a Plan Change, which will be lodged together with a resource consent application to
provide certainty as to the type and scale of activities that will locate on the site. The activities for which
consent is applied are:
• A 4,000m2 Countdown supermarket
• 2,000m2 of other commercial/retail space, to be split into three buildings of
approximately 500m2 footprint each, one of which will be two levels, with some sort of
non-retail space (indicatively offices or medical) upstairs.
The proposed site layout is shown in Figure 3.2.
Page | 10Figure 3.2: Proposed development site layout
3.2 Centre parameters
This section compares the proposed Waiata Shores Local centre against other Local centres in Auckland to
assess whether the parameters of the centre proposed are appropriate for a Local centre in the Auckland
context, notwithstanding that there is variability in the characteristics of these centres given historic
formation factors and local geography.
• Catchment size: There are 73 Local centres in Auckland, and around 577,000
households, so the average Local centre provides for the needs of around 8,000
households, although that catchment size varies due to topographic and access
constraints, and other variables. The Waiata Shores Local centre would have a
catchment generally consistent with that average size, given the household counts in
the Primary catchment described in section 2.1.
• Centre land area: The average Local centre in Auckland is 2.8ha, with 1-2ha being the
most common size. Overall, 27% of Auckland Local centres are 1-2ha, and 22% are 2-
3ha, so half are between 1 and 3ha. At 1.8ha, Waiata Shores is a fairly typical size for an
Auckland Local centre.
• Supermarket presence: Of the 73 Local centres, 30 (41%) have a supermarket, and 43
do not, so the Waiata Shores would not be atypical of Auckland Local centres on this
front.
• Retail GFA: The average Auckland Local centre has around 2,400m2 of non-supermarket
GFA, spread across a number of different retail and service types, often with some small
Page | 11office presence. At 2,000m2, Waiata Shores is similar to that average GFA, which is
consistent with the similarity to average centre land area described above.
• Location: Auckland’s Local centres are located in a wide range of different types of
places, having established organically over a long time to serve local needs, and
capitalising on land availability in a location accessible to the surrounding catchment.
This has meant that many Local centres are on Primary and Secondary Arterial roads.
Waiata Shores’ location on Great South Road is consistent with the type of location
where most of Auckland’s Local centres have established.
Overall, the proposed Waiata Shores Local centre is very similar to the ‘average’ Auckland Local centre in
terms of size, location, likely composition and catchment, and the parameters of the proposed centre are
therefore appropriate to have the centre zoned as a Local centre.
3.3 Performance assessment
This section assesses the potential performance of the proposed development, in terms of sales for the
supermarket component and employment for the balance. This performance will then be applied in the
impact assessment, where the sales attributed to the development will be diverted away from other nearby
stores, resulting in a decrease in sales at those stores, and the centres they are in (if any).
3.3.1 Supermarket
To assess the potential sales of the proposed Waiata Shores Countdown, we have used the catchments
described in section 2.1 as the base for estimating likely sales capture across the study area. The capture
rates we have applied are based on assumed market shares applied to each area, which are consistent with
what we know about how Countdowns attract consumers (the distance decay relationship with demand)
in various markets around NZ, being highest close by the store and much lower when there is another store
(of any brand) closer to consumers than the new store is. Capture rates for different parts of a
supermarket’s primary catchment can be over 30% close by (within 2km) a supermarket, depending on the
competitive environment, ease of access to other stores and the existence of other types of retail that
might keep visitors from leaving the primary catchment to do their shopping.
In this case we expect that the proposed Waiata Shores Countdown would attract some 32% of the
supermarket spend resident in the Primary West catchment (Figure 3.3). That is a relatively high share, but
all of the catchment is within 2km of the proposed store (or in the case of Wattle Downs the nearest retail
location), and there is no supermarket or other retail competition in the catchment (apart from small
Neighbourhood centres).
The next largest market share assumed is 25% from the Primary East catchment. There are also no
supermarkets in that catchment, although it is slightly closer to Takanini Countdown, and is to the east of
the Motorway, which may act as a barrier to some customers.
Page | 12Figure 3.3: Waiata Shores Countdown Sales Potential (2020)
Spend to
Market Waiata Origin of
Catchment
share Shores sales
CD
Primary West 32% $ 22.7 50%
Primary East 25% $ 4.1 9%
Secondary East 4% $ 1.0 2%
Secondary West 6% $ 1.8 4%
Secondary North 8% $ 6.8 15%
Total MTA $ 36.4 80%
Outside MTA $ 9.1 20%
Total Waiata Shores CD sales $ 45.5 100%
The proposed supermarket is modelled to achieve market shares of 4-8% in each of the three other
catchments. Those shares are lower than the other two because they are in areas which are closer to
existing stores (Takanini, Manurewa and Clendon).
An additional amount of sales would be made to consumers not resident in these five catchments
(collectively referred to as the Main Trade Area, or MTA). This assessment assumes that 20% of the
proposed store’s sales would be made to non-MTA residents, and so 80% of the Waiata Shores
Countdown’s sales would be made to MTA consumers. That 20% includes:
• people working in the area, and shopping in conjunction with a work commute;
• pass-by traffic stopping at the store while travelling through the area; and,
• non-locals visiting friends and family in the area.
That 80% share is consistent with the expected market capture for MTA’s of this size, given the location of
the proposed Countdown on the busy Great South Road arterial.
In total then, on opening (assumed for the purposes of this assessment to be in 2021) some $36.4m in
spending is projected to be directed to the Waiata Shores Countdown from consumers resident in the MTA
catchment, while sales to non-MTA households would be around $9.1m (20%). Total sales of the proposed
store would be $45.5m on opening, or $11,400/m2. That is slightly below the average sales productivity of
the other stores in the catchment, which is influenced by the geographically constrained (by the Manukau
Harbour and the Motorway) extent of the catchment.
3.3.2 Non-supermarket component
The non-supermarket component of the proposed centre will contain 2,000m2 GFA, including both retail
and non-retail space (which may potentially include offices and healthcare). The non-supermarket activities
within the proposed Local centre will contribute to changing the patterns of retail spending in the area,
and to the effects on nearby centres. The non-retail component of the 2,000m2 will likely have some effect
on retail patterns and centre impacts, due to the propensity of consumers to be influenced by total centre
Page | 13offer when undertaking multi-purpose centre visits. The impact assessment flowing from these numbers is
discussed in the assessment provided in section 4.
For the purposes of this assessment the potential employment, rather than sales, for the non-supermarket
component of the proposal is assessed. This is appropriate because:
• The likely tenants, and even the type of tenants (retail vs non-retail) of the non-
supermarket component are not yet known; and,
• For the non-retail components of the centre, including service businesses such as
medical practitioners, it is appropriate to base the impact assessment off employment
rather than sales. This allows the potential impacts of non-retail components to be
considered, whereas using a sales-based approach to impacts makes that inclusion
difficult.
The 2,000m2 of non-supermarket space in the proposed centre would indicatively yield up to 110 workers,
at an average of 18m2/worker. This assessment makes no attempt to disaggregate that total to different
storetypes or other business types, because ultimately it is the total impact on each other centre that is
important, not the impact on each individual store within that centre. IF the assessment were to assume
particular types of stores for Waiata Shores, that would result in a trade competition impact on their
competitors in other centres (or non-centre locations), and no impact on non-competitors. Averaged out
across the broader impacted centre, the total sales impact should be comparable to an assessment
undertaken at the aggregate level.
It is noted that a maximum of 1,500m2 of the 2,000m2 would be retail space, because the other 500m2 will
be above ground floor level, and therefore not suitable for retail.
Page | 144 Impact assessment
This section summarises the results of the impact assessment.
4.1 Impact types
There are two main types of potential effects of the proposed development relevant to this assessment:
• Direct Impacts: These arise when a new store opens and causes a redistribution of retail
spending among existing stores, and a decrease in sales at some existing stores. Impacts
of this type are the effects of trade competition, and cannot be considered under the
RMA.
• Indirect Impacts: These arise as the flow-on consequence of direct impacts, and are
relevant under the RMA. As consumer travel patterns change, patronage of the centres
that those stores are in could also change. A decrease in patronage could have adverse
impacts on centres’ amenity, vitality or vibrancy, making them less attractive places to
visit. Indirect impacts may not occur if centre patronage does not change, such as when
trips to a new development are additional to, and not a replacement for an existing
centre visit.
4.2 Direct retail impacts
4.2.1 Approach
By applying the expected market shares that the Countdown Waiata Shores will capture from each
catchment to the total demand from that catchment, we have, in section 3.3.1, estimated the sales
potential of the proposed store. We have then assessed the current origin-destination pattern (where
people from each part of the study area spend at supermarkets), to the amount of spend that we expect
the Countdown Waiata Shores to capture from each catchment. That process yields an estimate of the
amount of spend that will be diverted from each existing supermarket, based on the assumption that spend
will be diverted from existing stores pro rata to their draw from each catchment, although with greater
diversion from other Countdown stores (because they are of the same brand). In our opinion that is a sound
assumption to make, and it is likely to represent the patterns of diverted spend, and therefore be a robust
basis for assessing direct sales impacts.
The impacts presented describe the difference in store sales with the Countdown Waiata Shores in
operation in 2020 compared to their expected sales if the Countdown Waiata Shores was not to open.
4.2.2 Results
The 11 supermarkets in the study area have current (2018) turnover of an estimated $600m, at an average
turnover of $13,200/m2. By 2021 their sales (the assumed opening date of the proposed Waiata Shores
Countdown) are projected to increase to $652m, an 8.0% increase in three years, which is consistent with
Page | 15population growth in that time, and an allowance for a 1% increase in real spend per household, in line
with recent trends (Figure 4.1).
Figure 4.1: Supermarket sales without Waiata Shores Countdown
2018 2021 projected
GFA
Sales $/sqm Sales $/sqm
Manukau Countdown 4,160 $ 61.7 $ 14,800 $ 66.6 $ 16,000
Manukau City Mall Countdown 3,790 $ 35.7 $ 9,400 $ 38.6 $ 10,200
Manukau Pak'n Save 5,810 $ 102.8 $ 17,700 $ 111.0 $ 19,100
Clendon Pak'n Save 6,000 $ 80.0 $ 13,300 $ 86.4 $ 14,400
Southmall New World 3,490 $ 48.7 $ 14,000 $ 52.6 $ 15,100
Takanini Countdown 3,390 $ 52.0 $ 15,300 $ 56.1 $ 16,600
Manurewa Countdown 2,950 $ 34.6 $ 11,700 $ 37.4 $ 12,700
Roselands Mall Countdown 2,780 $ 26.0 $ 9,300 $ 28.0 $ 10,100
Papakura Countdown 3,990 $ 48.4 $ 12,100 $ 52.3 $ 13,100
Papakura New World 3,000 $ 37.9 $ 12,600 $ 40.9 $ 13,600
Papakura Pak'n Save 6,210 $ 75.7 $ 12,200 $ 81.8 $ 13,200
Total 45,570 $ 603.6 $ 13,200 $ 651.7 $ 14,300
When the proposed Waiata Shores Countdown opens it would draw sales away from the existing stores,
and the sum of all sales diverted from other locations would be the $46m of sales estimated in section
3.3.1. The new store is assumed to not increase total supermarket spending at all, so all sales come from
diversions from other stores (whether in the MTA or not), rather than new spend being created.
The stores projected to be most impacted by the Waiata Shores Countdown opening are those closest to
the proposed store, and other Countdowns, given the brand loyalty of many supermarket shoppers, and
the similarity of experience Countdowns offer. Less affected would be stores further away, and other
brands (Pak’n Saves and New Worlds) which have a different market positioning to Countdowns. So,
generally speaking, a Countdown would be impacted by more in dollar terms than a Pak’n Save, and a
Countdown 1km away would be impacted more than one 2km away. There are, however, other factors
that also come into play, such ease of access at each store, quality of store fitout, store size and adjacent
amenities, and the size of the population living in part of each store’s catchment. All of those factors have
been accounted for in the sales diversion assessment summarised below.
The stores expected to be most impacted are:
• Countdown Takanini (2.2km away), projected sales impact of $11.2m (20%)
• New World Southmall (1.5km away), projected sales impact of $7.8m (15%) (Figure 4.2).
Those impacts are the change in each store’s 2021 sales before and after the Waiata Shores Countdown
opens. Those two stores would together provide $19.0m of the Panmure Countdown’s sales (42%), with a
further 20% coming from non-local origins. In total then 62% of the new store’s $45.5m would come from
the two stores or non-local origins. That 20% non-local share of impacts is at the high end of what an
average supermarket might expect to attract from outside its MTA, however that assumption is appropriate
Page | 16for the proposed Countdown given its highly accessible location adjacent to the Takanini motorway
interchange, and on the busy Great South Road arterial route.
Figure 4.2: Direct retail impacts on supermarket sales (in 2020)
2021 sales CD impact c.f. 2021 Change c.f. 2018
wo CD w CD $m % $m %
Manukau Countdown $ 66.6 $ 64.5 -$ 2.1 -3.1% $ 2.8 4.6%
Manukau City Mall Countdown $ 38.6 $ 36.8 -$ 1.7 -4.5% $ 1.1 3.1%
Manukau Pak'n Save $ 111.0 $ 109.5 -$ 1.5 -1.4% $ 6.7 6.5%
Clendon Pak'n Save $ 86.4 $ 81.0 -$ 5.4 -6.2% $ 1.0 1.3%
Southmall New World $ 52.6 $ 44.8 -$ 7.8 -14.8% -$ 3.9 -8.0%
Takanini Countdown $ 56.1 $ 44.9 -$ 11.2 -20.0% -$ 7.1 -13.6%
Manurewa Countdown $ 37.4 $ 33.0 -$ 4.4 -11.7% -$ 1.6 -4.6%
Roselands Mall Countdown $ 28.0 $ 26.8 -$ 1.3 -4.6% $ 0.8 3.0%
Papakura Countdown $ 52.3 $ 52.2 -$ 0.1 -0.1% $ 3.8 7.9%
Papakura New World $ 40.9 $ 40.4 -$ 0.5 -1.2% $ 2.5 6.7%
Papakura Pak'n Save $ 81.8 $ 81.3 -$ 0.5 -0.6% $ 5.5 7.3%
Total excl CD Waiata Shores $ 651.7 $ 615.3 -$ 45.5
CD Waiata Shores $ - $ 45.5
Total incl CD Waiata Shores $ 651.7 $ 660.8
Other stores would have lower impacts, with the Manurewa Countdown projected to experience a 12%
decrease in sales ($4.4m), Clendon Pak’n Save 6% ($5.4m), and Countdown Roselands Mall 4.6% ($1.3m).
Impacts on other supermarkets would all be less than 5%.
Another way to look at the impacts is to consider the change in each store’s sales relative to the current
level. This is the more appropriate metric to consider, because it speaks to the future viability of each store,
given stores can be assumed to be viable at their current level. Due to growth in the period 2018-2021,
many of the stores would have a higher level of sales in 2021 post-Waiata Shores Countdown opening than
they do now (with it not operating). In fact, relative to current sales, only three stores (Countdown Takanini
(14% impact), New World Southmall (8%), and Manurewa Countdown (5%)) would have lower sales after
the Waiata Shores Countdown opens that they do now. Those are the only three because they are the
closest stores to the Waiata Shores Countdown and those with the most similar market positioning.
4.2.3 Impact on dairies and grocery stores
Grocery stores and dairies play a much different retail role than supermarkets, having a smaller range of
products, more of a convenience role and a typically very localised customer base. Further, grocery stores
and dairies are much smaller stores than supermarkets, are often located outside of centres, and tend to
be of relatively small importance to the overall amenity of the centre if they are inside one, given their
small size and low customer drawing power.
There are at least 20 dairies and grocery stores within 1.5km of the proposed Countdown, which means
that any sales that are diverted from these stores to go to the Waiata Shores Countdown will be diverted
from many individual businesses, and so the share of sales diverted from each individual store would be
Page | 17small. Further, the total value of sales that would be likely to be diverted away from all of those stores in aggregate would be small, because of the relatively settled and localised nature of grocery store and dairy customers. For these reasons the new store is unlikely to significantly change the propensity of shoppers to shop at the smaller stores, and there is unlikely to be any noticeable change in sales at any of the 20+ nearby grocery stores and dairies. Even if there were a noticeable change in sales, that would have negligible impact on the centre those stores are in (if they are even in one), so any impacts on supermarkets and grocery stores would be limited to trade competition effects, with no likelihood of resulting in significant indirect (flow-on effects). 4.2.4 Impact on other retail stores As discussed in section 3.3.2 the non-supermarket components of the proposed Waiata shores Local centre will generate impacts on both centres and non-centre businesses. Those impacts are assessed here using employment as a centre performance proxy, which is an appropriate measure because employment, as for sales, is indicative of a level of activity in the centre. Employment is a more meaningful measure of this aggregate activity when considering a broad range of activities when retail sales is not a meaningful metric for many of those activities (such as medical services). The employment impacts presented below are not necessarily intended to indicate the change in employment in each centre per se, rather to be a proxy to represent change in total centre activity. Employment changes are difficult to predict because a fixed workforce can generate a wide range of sales, and will not necessarily require any changes (more or fewer workers) to generate different sales. The majority of the direct effects of Waiata Shores’ non-supermarket activities would be experienced by the Manurewa and Takanini Town centres. Those two centres are the nearest competing centres of any notable size, with the only closer centres being the number of small Neighbourhood centres which have a more convenience role, and less variety of storetypes. Manurewa (1.5km from Waiata Shores) and Takanini (2.2km) are modelled to each absorb 35% of the impact generated by Waiata Shores’ non-supermarket activities. The smaller Clendon Local centre (4.1km away) would take around 10% of those impacts, while 10% would come from places outside the study area, by virtue of Waiata Shores’ location on Great South Road, and consistent with how centres of this size tend to attract at least that proportion of their custom from non-locals. Other centres would experience much smaller shares of the impacts generated by Waiata Shores, by virtue of being further away (Manukau is 6.5km from Waiata Shores and Papakura is 4.5km), or smaller and therefore more locally-focussed on catchments from which Waiata Shores would capture low market shares (Hingaia). Waiata Shores would be expected to divert only low levels of spend away from the Neighbourhood centres around it, given the convenience role played by those centres for both a small geographic catchment and in some cases, such as the nearest Neighbourhood centre 800m south on Great South Rd) the accessibility of those centres to large numbers on non-locals. Given that distribution of impacts (i.e. where Waiata Shores’ non-supermarket sales will come from), the impacts on each centre are assessed in Figure 4.3. The largest direct impacts by the non-supermarket component of Waiata Shores would be around 5% on Takanini, up to 4% on any Neighbourhood centre, 3% on Manurewa and Clendon, and much less on all other centres. Those levels of impact are Page | 18
representative only, given uncertainty about the tenant composition of Waiata Shores, but provide a solid
indication that the direct effects will be small.

Figure 4.3: Potential employment change due to Waiata Shores’ non-supermarket component

                                          Share of       MEC          Direct
                               MECs
                                          impacts       change       impact

Manukau                          9,060           2%            2           0%
Papakura                         2,330           2%            2           0%
Manurewa                         1,240          35%           39           3%
Takanini                           710          35%           39           5%
Clendon                            340          10%           11           3%
Hingaia                            330           2%            2           1%
Neighbourhood centres               20           4%         0.6*           4%
Other                                           10%           11
Waiata Shores                      110
Total                                                        110
                   * this is the effect per centre, assuming 8 affected centres

4.2.5       Interpretation of direct retail impacts
These impacts are the direct retail impacts, and would be classified as trade competition impacts under the
RMA. In our opinion the direct retail impacts assessed would not be significant enough to result in the
closure of any supermarket or dairy, because:

               •     Some of the loss in sales by existing stores will be mitigated by market growth between
                     now and the time the impacts occur (i.e. on opening in 2021). As described above, only
                     three stores (New World Southmall, Takanini Countdown and Manurewa Countdown)
                     would be expected to experience a decrease in sales between now and the time
                     immediately after the Waiata Shores Countdown opens.

               •     Foodstuffs’ relatively low representation near Waiata Shores means it is very unlikely
                     that a New World or Pak’n Save would close, given their strategic importance in the
                     MTA.

               •     All stores in the MTA are estimated to be performing well above average for their brand,
                     with the possible exception of Roselands Mall Countdown, which is performing at about
                     average, and would experience only minor trade competition effects.

               •     There are currently more than 20 dairies and grocery stores within 2km of Waiata
                     Shores, and as described above we do not anticipate that any of these stores would
                     close given the convenience role they play for typically quite localised catchments and
                     pass-by traffic.

In our opinion the non-supermarket direct retail impacts assessed would not be considered anywhere near
‘significant’ on any centre, given a maximum impact of 5% on any one centre, and average annual demand
growth of more than 2% across the MTA. That growth indicates that any decrease in sales or custom at

Page | 19
services businesses would be expected to be only short-lived, and in all likelihood imperceptible at a centre- level, and to return to pre-impact levels within say two and a half years. Further, Waiata Shores residents will support much of the business activity that establishes in their Local centre, and they will all be net additional customers in the catchment. 4.3 Indirect centre impacts 4.3.1 Background Related to the direct (trade competition) effects are the potential flow-on effects on other types of retail and service activity, and the centres those activities are in. Those effects can arise where changes in travel patterns induced by a new centre (or at an elemental level the supermarket and other retail activities in the proposed development) lead to changes in the other outlets that were previously visited in conjunction with that trip. Changes in those shopping patterns, such as the frequency with which other centres are visited and how much is spent there, are the indirect effects of the new retail development, and it is these effects that can be relevant under the RMA. However, for effects to be able to be considered under the RMA, they must go beyond direct (trade competition) effects and result in a serious decline in the viability of the centre as a whole, or the loss of employment on a significant scale. By way of indication, although notwithstanding that each case must be assessed depending on the specific factual context, indirect (not direct) impacts of as high as 26-31% have not been considered to be significant6. As described above, we consider it improbable that there would be any noticeable change in centre patronage as a result of a new Local centre opening at Waiata Shores, and any effect would fall far short of a level of significance. 4.3.2 Results A position seeking to prevent the proposed Countdown Waiata Shores on the grounds of indirect impacts will therefore only be valid if a significant level of decline was likely for any impacted centre. This report finds that the maximum direct effects on any existing supermarket, relative to the current 2018 sales, would be 14% (on Takanini Countdown), and less than 8% on all other supermarkets, and 5% or less on the non- supermarket component of all centres. Overall, Manurewa and Takanini are both much larger centres than Waiata Shores will be, and will absorb the majority of the impacts created by the creation of that new Local centre. The very limited indirect impacts fall far short of a level of significance that means they are able to be considered under the RMA, and the impacts expected will be limited to a trade competition impact, which is not a relevant consideration under the RMA. 6 Bilimag Holdings v Waipa District Council, 8 June 2008, Whiting J, A72/08, Auckland. Page | 20
4.3.3       Conclusion on indirect effects
For these reasons we do not expect that the proposed development would result in significant adverse
effects on any centre that would go beyond trade competition effects, and in fact those impacts would be
no more than minor. There would be no grounds for seeking to prevent the proposed Local centre due to
indirect impacts on centres in the study area.

Page | 21
5           Economic and other benefits
While the proposed Countdown Waiata Shores would have some trade competition impacts and
consequent, but smaller, indirect impacts, it will also provide some economic and other benefits, and these
benefits are a relevant consideration under the RMA.

5.1         Travel efficiency and accessibility
A new centre in the area located on Great South Road, close to the Southern Motorway interchange, would
provide efficient access for consumers to retail goods and services. There is a spatial gap in the supply of
Local centre space, due to the historic land uses that have dominated in the area. The Takanini Town centre
has helped to fill some of that gap, and will supply large parts of the needs of the growing population in
Addison and other parts of the FUZ to the east. Waiata Shores will play a role filling in the gap in supply
between Manurewa and Takanini, which currently sees no larger than Neighbourhood centres servicing
the needs of Wattle Downs, Manurewa South and Conifer Grove. The addition of more than 600
households to Waiata Shores will also require some local provision of retail goods and services, and a small
supermarket-based centre is an appropriate way to provide for those needs. Per the assessment above in
section 3.2 the Waiata Shores Local centre would be appropriately sized for its catchment, and in relation
to other Local centres in Auckland.

Given the high frequency (typically weekly) with which supermarket types of products, especially, are
purchased, this local provision will improve efficiency, and result in a reduction in travel distance over the
course of a year. Not all of the trips to the Waiata Shores Local centre will result in more efficient travel,
because some consumers will choose less efficient (longer) travel to visit the centre, however on balance
it is likely that a reduction in total vehicle kilometres would result.

5.2         Short term construction effects
For a short time, indicatively around one year, there will be additional economic activity stimulated in the
area while the centre is being constructed. This activity will arise from the construction and site preparation
works required, and is likely to result in the employment of local residents on the site, potentially by local
businesses. These construction effects will flow through to other parts of the economy due to the
construction firms purchasing goods and services from other businesses (the multiplier effect). Although
the duration of this positive benefit will be relatively short, and some of the construction activity may occur
on other jobs even in the absence of the centre being developed (i.e. the centre would simply transfer
otherwise engaged activity), the economic effect will be positive.

5.3         Employment effects
The Waiata Shores Local centre would indicatively employ between 120 and 150 staff in the supermarket,
and around another 110 in the rest of the centre, a total of 230-260 workers. The trade competition impacts
on existing stores might result in very small decreases in the employment of those stores, although that
would be expected to be much less than the employees needed for the proposed Local centre, resulting in

Page | 22
the Waiata Shores Local centre creating a net increase in employment in South Auckland. Again, the
magnitude of this effect will be very small, especially in an Auckland-wide context, but the effect will be
positive.

Page | 23
You can also read